Carriers Identifies Novel Loci Associated with Breast and
Ovarian Cancer Risk
Fergus J. Couch1.
*, Xianshu Wang2, Lesley McGuffog3, Andrew Lee3, Curtis Olswold4,
Karoline B. Kuchenbaecker3, Penny Soucy5, Zachary Fredericksen4, Daniel Barrowdale3, Joe Dennis3, Mia M. Gaudet6, Ed Dicks3, Matthew Kosel4, Sue Healey7, Olga M. Sinilnikova8,9, Adam Lee10,
Franc¸ois Bacot11, Daniel Vincent11, Frans B. L. Hogervorst12, Susan Peock3,
Dominique Stoppa-Lyonnet13,14,15, Anna Jakubowska16, kConFab Investigators17, Paolo Radice18,19, Rita Katharina Schmutzler20, SWE-BRCA21, Susan M. Domchek22, Marion Piedmonte23,
Christian F. Singer24, Eitan Friedman25, Mads Thomassen26, Ontario Cancer Genetics Network27, Thomas V. O. Hansen28, Susan L. Neuhausen29, Csilla I. Szabo30, Ignacio Blanco31, Mark H. Greene32, Beth Y. Karlan33, Judy Garber34, Catherine M. Phelan35, Jeffrey N. Weitzel36, Marco Montagna37, Edith Olah38, Irene L. Andrulis39, Andrew K. Godwin40, Drakoulis Yannoukakos41, David E. Goldgar42, Trinidad Caldes43, Heli Nevanlinna44, Ana Osorio45, Mary Beth Terry46, Mary B. Daly47,
Elizabeth J. van Rensburg48, Ute Hamann49, Susan J. Ramus50, Amanda Ewart Toland51, Maria A. Caligo52, Olufunmilayo I. Olopade53, Nadine Tung54, Kathleen Claes55, Mary S. Beattie56, Melissa C. Southey57, Evgeny N. Imyanitov58, Marc Tischkowitz59, Ramunas Janavicius60, Esther M. John61, Ava Kwong62, Orland Diez63, Judith Balman˜a64, Rosa B. Barkardottir65, Banu K. Arun66, Gad Rennert67,
Soo-Hwang Teo68, Patricia A. Ganz69, Ian Campbell70, Annemarie H. van der Hout71,
Carolien H. M. van Deurzen72, Caroline Seynaeve73, Encarna B. Go´mez Garcia74, Flora E. van Leeuwen75, Hanne E. J. Meijers-Heijboer76, Johannes J. P. Gille76, Margreet G. E. M. Ausems77, Marinus J. Blok78, Marjolijn J. L. Ligtenberg79, Matti A. Rookus75, Peter Devilee80, Senno Verhoef12, Theo A. M. van Os81, Juul T. Wijnen82, HEBON83, EMBRACE3, Debra Frost3, Steve Ellis3, Elena Fineberg3, Radka Platte3, D. Gareth Evans84, Louise Izatt85, Rosalind A. Eeles86, Julian Adlard87, Diana M. Eccles88, Jackie Cook89, Carole Brewer90, Fiona Douglas91, Shirley Hodgson92, Patrick J. Morrison93, Lucy E. Side94,
Alan Donaldson95, Catherine Houghton96, Mark T. Rogers97, Huw Dorkins98, Jacqueline Eason99, Helen Gregory100, Emma McCann101, Alex Murray102, Alain Calender8, Agne`s Hardouin103, Pascaline Berthet103, Capucine Delnatte104, Catherine Nogues105, Christine Lasset106,107, Claude Houdayer13,15, Dominique Leroux108,109, Etienne Rouleau110, Fabienne Prieur111, Francesca Damiola9, Hagay Sobol112, Isabelle Coupier113,114, Laurence Venat-Bouvet115,
Laurent Castera13, Marion Gauthier-Villars13, Me´lanie Le´one´8, Pascal Pujol113,116, Sylvie Mazoyer9, Yves-Jean Bignon117, GEMO Study Collaborators118, Elz_bieta Złowocka-Perłowska16, Jacek Gronwald16, Jan Lubinski16, Katarzyna Durda16, Katarzyna Jaworska16,119, Tomasz Huzarski16, Amanda B. Spurdle7, Alessandra Viel120, Bernard Peissel121, Bernardo Bonanni122, Giulia Melloni121, Laura Ottini123,
Laura Papi124, Liliana Varesco125, Maria Grazia Tibiletti126, Paolo Peterlongo18,19, Sara Volorio127, Siranoush Manoukian121, Valeria Pensotti127, Norbert Arnold128, Christoph Engel129, Helmut Deissler130, Dorothea Gadzicki131, Andrea Gehrig132, Karin Kast133, Kerstin Rhiem20, Alfons Meindl134,
Dieter Niederacher135, Nina Ditsch136, Hansjoerg Plendl137, Sabine Preisler-Adams138, Stefanie Engert134, Christian Sutter139, Raymonda Varon-Mateeva140, Barbara Wappenschmidt20, Bernhard H. F. Weber141, Brita Arver142, Marie Stenmark-Askmalm143, Niklas Loman144, Richard Rosenquist145,
Zakaria Einbeigi146, Katherine L. Nathanson147, Timothy R. Rebbeck148, Stephanie V. Blank149, David E. Cohn150, Gustavo C. Rodriguez151, Laurie Small152, Michael Friedlander153,
Victoria L. Bae-Jump154, Anneliese Fink-Retter24, Christine Rappaport24, Daphne Gschwantler-Kaulich24, Georg Pfeiler24, Muy-Kheng Tea24, Noralane M. Lindor155, Bella Kaufman25, Shani Shimon Paluch25, Yael Laitman25, Anne-Bine Skytte156, Anne-Marie Gerdes157, Inge Sokilde Pedersen158,
Mark Robson160, Noah Kauff160, Anna Marie Mulligan161,162, Gord Glendon27, Hilmi Ozcelik39,161, Bent Ejlertsen163, Finn C. Nielsen28, Lars Jønson28, Mette K. Andersen164, Yuan Chun Ding29, Linda Steele29, Lenka Foretova165, Alex Teule´31, Conxi Lazaro166, Joan Brunet167, Miquel
Angel Pujana168, Phuong L. Mai32, Jennifer T. Loud32, Christine Walsh33, Jenny Lester33, Sandra Orsulic33, Steven A. Narod169, Josef Herzog36, Sharon R. Sand36, Silvia Tognazzo37, Simona Agata37,
Tibor Vaszko38, Joellen Weaver170, Alexandra V. Stavropoulou41, Saundra S. Buys171, Atocha Romero43, Miguel de la Hoya43, Kristiina Aittoma¨ki172, Taru A. Muranen44, Mercedes Duran173, Wendy K. Chung174, Adriana Lasa175, Cecilia M. Dorfling48, Alexander Miron176, BCFR177, Javier Benitez178, Leigha Senter179, Dezheng Huo53, Salina B. Chan180, Anna P. Sokolenko58, Jocelyne Chiquette181, Laima Tihomirova182, Tara M. Friebel183, Bjarni A. Agnarsson184, Karen H. Lu66, Flavio Lejbkowicz185, Paul A. James186, Per Hall187, Alison M. Dunning188, Daniel Tessier11, Julie Cunningham1, Susan L. Slager4, Chen Wang4, Steven Hart4, Kristen Stevens1, Jacques Simard5, Tomi Pastinen189, Vernon S. Pankratz4,
Kenneth Offit160, Douglas F. Easton3.
, Georgia Chenevix-Trench7.
, Antonis C. Antoniou3* on behalf of CIMBA
Finland,173Institute of Biology and Molecular Genetics, Universidad de Valladolid (IBGM–UVA), Valladolid, Spain,174Departments of Pediatrics and Medicine, Columbia University, New York, New York, United States of America,175Genetics Service, Hospital de la Santa Creu i Sant Pau, Barcelona, Spain,176Department of Cancer Biology, Dana-Farber Cancer Institute, Boston, Massachusetts, United States of America,177Breast Cancer Family Registry, Cancer Prevention Institute of California, Fremont, California, United States of America,178Human Genetics Group and Genotyping Unit, Spanish National Cancer Centre (CNIO), and Biomedical Network on Rare Diseases (CIBERER), Madrid, Spain,179Divison of Human Genetics, Department of Internal Medicine, The Comprehensive Cancer Center, The Ohio State University, Columbus, Ohio, United States of America,180Cancer Risk Program, Helen Diller Family Cancer Center, University of California San Francisco, San Francisco, California, United States of America,181Unite´ de Recherche en Sante´ des Populations, Centre des Maladies du Sein Descheˆnes-Fabia, Centre de Recherche FRSQ du Centre Hospitalier Affilie´ Universitaire de Que´bec, Que´bec, Canada,182Latvian Biomedical Research and Study Centre, Riga, Latvia,183University of Pennsylvania, Philadelphia, Pennsylvania, United States of America,184Landspitali University Hospital and University of Iceland School of Medicine, Reykjavik, Iceland,185Clalit National Israeli Cancer Control Center and Department of Community Medicine and Epidemiology, Carmel Medical Center, Haifa, Israel,186Familial Cancer Centre, Peter MacCallum Cancer Centre, Melbourne, Australia,187Department of Medical Epidemiology and Biostatistics, Karolinska Institutet, Stockholm, Sweden,188Centre for Cancer Genetic Epidemiology, Department of Oncology, University of Cambridge, Cambridge, United Kingdom,189Department of Human Genetics, McGill University and Ge´nome Que´bec Innovation Centre, McGill University, Montre´al, Canada
Abstract
BRCA1-associated breast and ovarian cancer risks can be modified by common genetic variants. To identify further cancer
risk-modifying loci, we performed a multi-stage GWAS of 11,705BRCA1carriers (of whom 5,920 were diagnosed with breast
and 1,839 were diagnosed with ovarian cancer), with a further replication in an additional sample of 2,646BRCA1carriers.
We identified a novel breast cancer risk modifier locus at 1q32 forBRCA1carriers (rs2290854, P = 2.761028, HR = 1.14, 95%
CI: 1.09–1.20). In addition, we identified two novel ovarian cancer risk modifier loci: 17q21.31 (rs17631303, P = 1.461028,
HR = 1.27, 95% CI: 1.17–1.38) and 4q32.3 (rs4691139, P = 3.461028, HR = 1.20, 95% CI: 1.17–1.38). The 4q32.3 locus was not
associated with ovarian cancer risk in the general population orBRCA2carriers, suggesting aBRCA1-specific association. The
17q21.31 locus was also associated with ovarian cancer risk in 8,211BRCA2carriers (P = 261024). These loci may lead to an
improved understanding of the etiology of breast and ovarian tumors inBRCA1carriers. Based on the joint distribution of
the knownBRCA1breast cancer risk-modifying loci, we estimated that the breast cancer lifetime risks for the 5% ofBRCA1
carriers at lowest risk are 28%–50% compared to 81%–100% for the 5% at highest risk. Similarly, based on the known
ovarian cancer risk-modifying loci, the 5% ofBRCA1carriers at lowest risk have an estimated lifetime risk of developing
ovarian cancer of 28% or lower, whereas the 5% at highest risk will have a risk of 63% or higher. Such differences in risk may
have important implications for risk prediction and clinical management forBRCA1carriers.
Citation:Couch FJ, Wang X, McGuffog L, Lee A, Olswold C, et al. (2013) Genome-Wide Association Study inBRCA1Mutation Carriers Identifies Novel Loci Associated with Breast and Ovarian Cancer Risk. PLoS Genet 9(3): e1003212. doi:10.1371/journal.pgen.1003212
Editor:Kent W. Hunter, National Cancer Institute, United States of America
ReceivedSeptember 7, 2012;AcceptedNovember 14, 2012;PublishedMarch 27, 2013
Copyright:ß2013 Couch et al. This is an open-access article distributed under the terms of the Creative Commons Attribution License, which permits unrestricted use, distribution, and reproduction in any medium, provided the original author and source are credited.
Professorship. German Consortium of Hereditary Breast and Ovarian Cancer HBOC): The German Consortium of Hereditary Breast and Ovarian Cancer (GC-HBOC) is supported by the German Cancer Aid (grant no 109076, Rita K. Schmutzler) and by the Center for Molecular Medicine Cologne (CMMC). Genetic Modifiers of cancer risk in BRCA1/2 mutation carriers (GEMO): The GEMO study was supported by the Ligue National Contre le Cancer; the Association ‘‘Le cancer du sein, parlons-en!’’ Award and the Canadian Institutes of Health Research for the ‘‘CIHR Team in Familial Risks of Breast Cancer’’ program. Gynecologic Oncology Group (GOG): This study was supported by National Cancer Institute grants to the Gynecologic Oncology Group (GOG) Administrative Office and Tissue Bank (CA 27469), Statistical and Data Center (CA 37517), and GOG’s Cancer Prevention and Control Committtee (CA 101165). Drs. Mark H. Greene and Phuong L. Mai were supported by funding from the Intramural Research Program, NCI, NIH. Hospital Clinico San Carlos (HCSC): HCSC was supported by RETICC 06/0020/0021, FIS research grant 09/00859, Instituto de Salud Carlos III, Spanish Ministry of Economy and Competitivity, and the European Regional Development Fund (ERDF). Helsinki Breast Cancer Study (HEBCS): The HEBCS was financially supported by the Helsinki University Central Hospital Research Fund, Academy of Finland (132473), the Finnish Cancer Society, the Nordic Cancer Union, and the Sigrid Juselius Foundation. Study of Genetic Mutations in Breast and Ovarian Cancer patients in Hong Kong and Asia (HRBCP): HRBCP is supported by The Hong Kong Hereditary Breast Cancer Family Registry and the Dr. Ellen Li Charitable Foundation, Hong Kong. Molecular Genetic Studies of Breast and Ovarian Cancer in Hungary (HUNBOCS): HUNBOCS was supported by Hungarian Research Grant KTIA-OTKA CK-80745 and the Norwegian EEA Financial Mechanism HU0115/NA/2008-3/O¨ P-9. Institut Catala` d’Oncologia (ICO): The ICO study was supported by the Asociacio´n Espan˜ola Contra el Ca´ncer, Spanish Health Research Foundation, Ramo´n Areces Foundation, Carlos III Health Institute, Catalan Health Institute, and Autonomous Government of Catalonia and contract grant numbers: ISCIIIRETIC RD06/0020/1051, PI09/02483, PI10/ 01422, PI10/00748, 2009SGR290, and 2009SGR283. International Hereditary Cancer Centre (IHCC): Supported by the Polish Foundation of Science. Katarzyna Jaworska is a fellow of International PhD program, Postgraduate School of Molecular Medicine, Warsaw Medical University. Iceland Landspitali–University Hospital (ILUH): The ILUH group was supported by the Icelandic Association ‘‘Walking for Breast Cancer Research’’ and by the Landspitali University Hospital Research Fund. INterdisciplinary HEalth Research Internal Team BReast CAncer susceptibility (INHERIT): INHERIT work was supported by the Canadian Institutes of Health Research for the ‘‘CIHR Team in Familial Risks of Breast Cancer’’ program, the Canadian Breast Cancer Research Alliance grant 019511 and the Ministry of Economic Development, Innovation and Export Trade grant PSR-SIIRI-701. Jacques Simard is Chairholder of the Canada Research Chair in Oncogenetics. Istituto Oncologico Veneto (IOVHBOCS): The IOVHBOCS study was supported by Ministero dell’Istruzione, dell’Universita` e della Ricerca and Ministero della Salute (‘‘Progetto Tumori Femminili’’ and RFPS 2006-5-341353,ACC2/R6.9’’). Kathleen Cuningham Consortium for Research into Familial Breast Cancer (kConFab): kConFab is supported by grants from the National Breast Cancer Foundation and the National Health and Medical Research Council (NHMRC) and by the Queensland Cancer Fund; the Cancer Councils of New South Wales, Victoria, Tasmania, and South Australia; and the Cancer Foundation of Western Australia. Amanda B. Spurdle is an NHMRC Senior Research Fellow. The Clinical Follow Up Study was funded from 2001–2009 by NHMRC and currently by the National Breast Cancer Foundation and Cancer Australia#628333. Mayo Clinic (MAYO): MAYO is supported by NIH grant CA128978, an NCI Specialized Program of Research Excellence (SPORE) in Breast Cancer (CA116201), a U.S. Department of Defence Ovarian Cancer Idea award (W81XWH-10-1-0341) and grants from the Breast Cancer Research Foundation and the Komen Foundation for the Cure. McGill University (MCGILL): The McGill Study was supported by Jewish General Hospital Weekend to End Breast Cancer, Quebec Ministry of Economic Development, Innovation, and Export Trade. Memorial Sloan-Kettering Cancer Center (MSKCC): The MSKCC study was supported by Breast Cancer Research Foundation, Niehaus Clinical Cancer Genetics Initiative, Andrew Sabin Family Foundation, and Lymphoma Foundation. Modifier Study of Quantitative Effects on Disease (MODSQUAD): MODSQUAD was supported by the European Regional Development Fund and the State Budget of the Czech Republic (RECAMO, CZ.1.05/2.1.00/03.0101). Women’s College Research Institute, Toronto (NAROD): NAROD was supported by NIH grant: 1R01 CA149429-01. National Cancer Institute (NCI): Drs. Mark H. Greene and Phuong L. Mai were supported by the Intramural Research Program of the US National Cancer Institute, NIH, and by support services contracts NO2-CP-11019-50 and N02-CP-65504 with Westat, Rockville, MD. National Israeli Cancer Control Center (NICCC): NICCC is supported by Clalit Health Services in Israel. Some of its activities are supported by the Israel Cancer Association and the Breast Cancer Research Foundation (BCRF), NY. N. N. Petrov Institute of Oncology (NNPIO): The NNPIO study has been supported by the Russian Foundation for Basic Research (grants 11-04-00227, 12-04-00928, and 12-04-01490), the Federal Agency for Science and Innovations, Russia (contract 02.740.11.0780), and through a Royal Society International Joint grant (JP090615). The Ohio State University Comprehensive Cancer Center (OSU-CCG): OSUCCG is supported by the Ohio State University Comprehensive Cancer Center. South East Asian Breast Cancer Association Study (SEABASS): SEABASS is supported by the Ministry of Science, Technology and Innovation, Ministry of Higher Education (UM.C/HlR/MOHE/06) and Cancer Research Initiatives Foundation. Sheba Medical Centre (SMC): The SMC study was partially funded through a grant by the Israel Cancer Association and the funding for the Israeli Inherited Breast Cancer Consortium. Swedish Breast Cancer Study (SWE-BRCA): SWE-BRCA collaborators are supported by the Swedish Cancer Society. The University of Chicago Center for Clinical Cancer Genetics and Global Health (UCHICAGO): UCHICAGO is supported by grants from the US National Cancer Institute (NIH/NCI) and by the Ralph and Marion Falk Medical Research Trust, the Entertainment Industry Fund National Women’s Cancer Research Alliance, and the Breast Cancer Research Foundation. University of California Los Angeles (UCLA): The UCLA study was supported by the Jonsson Comprehensive Cancer Center Foundation and the Breast Cancer Research Foundation. University of California San Francisco (UCSF): The UCSF study was supported by the UCSF Cancer Risk Program and the Helen Diller Family Comprehensive Cancer Center. United Kingdom Familial Ovarian Cancer Registries (UKFOCR): UKFOCR was supported by a project grant from CRUK to Paul Pharoah. University of Pennsylvania (UPENN): The UPENN study was supported by the National Institutes of Health (NIH) (R01-CA102776 and R01-CA083855), Breast Cancer Research Foundation, Rooney Family Foundation, Susan G. Komen Foundation for the Cure, and the Macdonald Family Foundation. Victorian Familial Cancer Trials Group (VFCTG): The VFCTG study was supported by the Victorian Cancer Agency, Cancer Australia, and National Breast Cancer Foundation. Women’s Cancer Research Initiative (WCRI): The WCRI at the Samuel Oschin Comprehensive Cancer Institute, Cedars Sinai Medical Center, Los Angeles, is funded by the American Cancer Society Early Detection Professorship (SIOP-06-258-01-COUN). The funders had no role in study design, data collection and analysis, decision to publish, or preparation of the manuscript.
Competing Interests:The authors have declared that no competing interests exist.
* E-mail: couch.fergus@mayo.edu (Fergus J Couch); Antonis@srl.cam.ac.uk (Antonis C Antoniou)
.These authors contributed equally to this work.
Introduction
Breast and ovarian cancer risk estimates forBRCA1 mutation carriers vary by the degree of family history of the disease, suggesting that other genetic factors modify cancer risks for this population [1–4]. Studies by the Consortium of Investigators of Modifiers of BRCA1/2 (CIMBA) have shown that a subset of common alleles influencing breast and ovarian cancer risk in the general population are also associated with cancer risk inBRCA1
mutation carriers [5–11]. In particular, the breast cancer associations were limited to loci associated with estrogen receptor (ER)-negative breast cancer in the general population (6q25.1, 12p11 andTOX3) [8–11].
To systematically search for loci associated with breast or ovarian cancer risk forBRCA1carriers we previously conducted a
two-stage genome-wide association study (GWAS) [12]. The initial stage involved analysis of 555,616 SNPs in 2383BRCA1mutation carriers (1,193 unaffected and 1,190 affected). After replication testing of 89 SNPs showing the strongest association, with 5,986
BRCA1 mutation carriers, a locus on 19p13 was shown to be associated with breast cancer risk for BRCA1 mutation carriers. The same locus was also associated with the risk of estrogen-receptor (ER) negative and triple negative (ER, Progesterone and HER2 negative) breast cancer in the general population [12,13].
and prostate cancers and fine-map known susceptibility loci. A total of 32,557 SNPs on the iCOGS array were selected on the basis of the BRCA1GWAS for the purpose of identifying breast and ovarian cancer risk modifiers forBRCA1 mutation carriers. Genotype data from the iCOGS array were obtained for 11,705 samples from BRCA1carriers and the 17 most promising SNPs were then genotyped in an additional 2,646 BRCA1 carriers. In this manuscript we report on the novel risk modifier loci identified by this multi-stage GWAS. No study has previously shown how the absolute risks of breast and ovarian cancer forBRCA1 mutation carriers vary by the combined effects of risk modifying loci. Here we use the results from this study, in combination with previously identified modifiers, to obtain absolute risks of developing breast and ovarian cancer forBRCA1mutation carriers based on the joint distribution of all known genetic risk modifiers.
Materials and Methods
Ethics statement
All carriers participated in clinical or research studies at the host institutions, approved by local ethics committees.
Study subjects
BRCA1mutation carriers were recruited by 45 study centers in 25 countries through CIMBA. The majority were recruited through cancer genetics clinics, and enrolled into national or regional studies. The remainder were identified by population-based sampling or community recruitment. Eligibility for CIMBA association studies was restricted to female carriers of pathogenic
BRCA1 mutations age 18 years or older at recruitment. Information collected included year of birth, mutation description, self-reported ethnic ancestry, age at last follow-up, ages at breast or ovarian cancer diagnoses, and age at bilateral prophylactic mastectomy and oophorectomy. Information on tumour charac-teristics, including ER-status of the breast cancers, was also collected. Related individuals were identified through a unique family identifier. Women were included in the analysis if they carried mutations that were pathogenic according to generally recognized criteria.
GWAS stage 1 samples. A total of 2,727BRCA1 mutation
carriers were genotyped on the Illumina Infinium 610K array (Figure 1). Of these 1,426 diagnosed with a first breast cancer under age 40 were considered ‘‘affected’’ in the breast cancer
association analysis and 683 diagnosed with an ovarian cancer at any time were considered as ‘‘affected’’ in the ovarian cancer analysis. ‘‘Unaffected’’ in both analyses were over age 35 (Table S1) [12].
Replication study samples. All eligible BRCA1 carriers
from CIMBA with sufficient DNA were genotyped, including those used in Stage 1. In total, 13,310 samples from 45 centers in 25 countries were genotyped using the iCOGS array (Table S2). Among the 13,310 samples, those that were genotyped in the GWAS stage 1 SNP selection stage are referred to as ‘‘stage 1’’ samples, and the remainder are ‘‘stage 2’’ samples. An additional 2,646 BRCA1 samples ‘‘stage 3’’ were genotyped on an iPLEX Mass Array of 17 SNPs from 12 loci selected after an interim analysis of iCOGS array data and were available for analysis after quality control (QC) (Figure 1). Carriers of pathogenic mutations inBRCA2were drawn from a parallel GWAS of genetic modifiers for BRCA2 mutation carriers. BRCA2 mutation carriers were recruited from CIMBA through 47 studies which were largely the same as the studies that contributed to the BRCA1GWAS with similar eligibility criteria. Samples fromBRCA2mutation carriers were also genotyped using the iCOGS array. Details of this experiment are described elsewhere [14]. A total of 8,211 samples were available for analysis after QC.
iCOGS SNP array
The iCOGS array was designed in a collaboration among the Breast Cancer Association Consortium (BCAC), Ovarian Cancer Association Consortium (OCAC), the Prostate Cancer Association Group to Investigate Cancer Associated Alterations in the Genome (PRACTICAL) and CIMBA. The general aims for designing the iCOGS array were to replicate findings from GWAS for identifying variants associated with breast, ovarian or prostate cancer (including subtypes and SNPs potentially associated with disease outcome), to facilitate fine-mapping of regions of interest, and to genotype ‘‘candidate’’ SNPs of interest within the consortia, including rarer variants. Each consortium was given a share of the array: nominally 25% of the SNPs each for BCAC, PRACTICAL and OCAC; 17.5% for CIMBA; and 7.5% for SNPs of common interest between the consortia. The final design comprised 220,123 SNPs, of which 211,155 were successfully manufactured. A total of 32,557 SNPs on the iCOGS array were selected based on 8 separate analyses of stage 1 of the CIMBABRCA1GWAS that included 2,727 BRCA1 mutation carriers [12]. After imputation for all SNPs in HapMap Phase II (CEU) a total of 2,568,349 (imputation r2.0.30) were available for analysis. Markers were evaluated for associations with: (1) breast cancer; (2) ovarian cancer; (3) breast cancer restricted to Class 1 mutations (loss-of-function mutations expected to result in a reduced transcript or protein level due to nonsense-mediated RNA decay); (4) breast cancer restricted to Class 2 mutations (mutations likely to generate stable proteins with potential residual or dominant negative function); (5) breast cancer by tumor ER-status; (6) breast cancer restricted toBRCA1185delAG mutation carriers; (7) breast cancer restricted toBRCA1 5382insC mutation carriers; and (8) breast cancer by contrasting the genotype distributions inBRCA1
mutation carriers, against the distribution in population-based controls. Analyses (1) and (2) were based on both imputed and observed genotypes, whereas the rest were based on only the observed genotypes. SNPs were ranked according to the 1 d.f. score-test for trend P-value (described below) and selected for inclusion based on nominal proportions of 61.5%, 20%, 2.5%, 2.5%, 2.5%, 0.5%, 0.5% and 10.0% for analyses (1) to (8). SNP duplications were not allowed and SNPs with a pairwise r2$0.90 with a higher-ranking SNP were only allowed (up to a maximum
Author Summary
BRCA1mutation carriers have increased and variable risks of breast and ovarian cancer. To identify modifiers of breast and ovarian cancer risk in this population, a
multi-stage GWAS of 14,351 BRCA1 mutation carriers was
performed. Loci 1q32 and TCF7L2 at 10q25.3 were
associated with breast cancer risk, and two loci at 4q32.2 and 17q21.31 were associated with ovarian cancer risk. The 4q32.3 ovarian cancer locus was not associated with
ovarian cancer risk in the general population or inBRCA2
carriers and is the first indication of aBRCA1-specific risk
locus for either breast or ovarian cancer. Furthermore, modeling the influence of these modifiers on cumulative
risk of breast and ovarian cancer in BRCA1 mutation
carriers for the first time showed that a wide range of individual absolute risks of each cancer can be estimated. These differences suggest that genetic risk modifiers may
be incorporated into the clinical management of BRCA1
of 2) if the P-value for association was,1024for analyses (1) and (2) and,1025for other analyses. SNPs with poor Illumina design scores were replaced by the SNP with the highest r2(among SNPs with r2.0.80 based on HapMap data) that had a good quality design score. The analysis of associations with breast and ovarian cancer risks presented here included all 32,557 SNPs on iCOGS that were selected on the basis of theBRCA1GWAS.
Genotyping and quality control
iCOGS genotyping. Genotyping was performed at Mayo
[image:7.612.65.495.58.576.2]Clinic. Genotypes for samples genotyped on the iCOGS array were called using Illumina’s GenCall algorithm (Text S1). A total of 13,510 samples were genotyped for 211,155 SNPs. The sample and SNP QC process is summarised in Table S3. Of the 13,510 samples, 578 did not fulfil eligibility criteria based on phenotypic
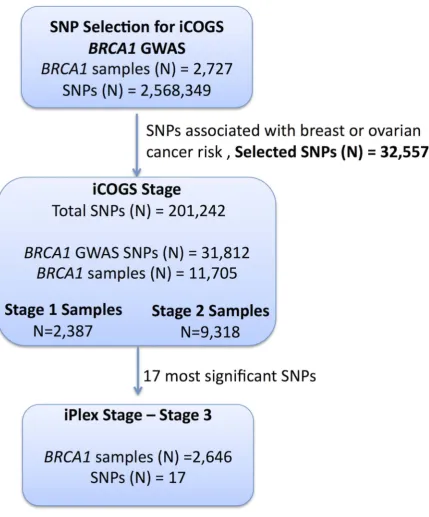
Figure 1. Study design for selection of the SNPs and genotyping ofBRCA1samples.GWAS data from 2,727BRCA1mutation carriers were
analysed for associations with breast and ovarian cancer risk and 32,557 SNPs were selected for inclusion on the iCOGS array. A total of 11,705BRCA1
samples (after quality control (QC) checks) were genotyped on the 31,812BRCA1-GWAS SNPs from the iCOGS array that passed QC. Of these samples, 2,387 had been genotyped at the SNP selection stage and are referred to as ‘‘stage 1’’ samples, whereas 9,318 samples were unique to the iCOGS study (‘‘Stage 2’’ samples). Next, 17 SNPs that exhibited the most significant associations with breast and ovarian cancer were selected for genotyping in a third stage involving an additional 2,646BRCA1samples (after QC).
data and were excluded. A step-wise QC process was applied to the remaining samples and SNPs. Samples were excluded due to inferred gender errors, low call rates (,95%), low or high heterozygosity and sample duplications (cryptic and intended). Of the 211,155 markers genotyped, 9,913 were excluded due to Y-chromosome origin, low call rates (,95%), monomorphic SNPs, or SNPs with Hardy-Weinberg equilibrium (HWE) P,1027under a country-stratified test statistic [15] (Table S3). SNPs that gave discordant genotypes among known sample duplicates were also excluded. Multi-dimensional scaling was used to exclude individ-uals of non-European ancestry. We selected 37,149 weakly correlated autosomal SNPs (pair-wise r2,0.10) to compute the genomic kinship between all pairs ofBRCA1carriers, along with 197 HapMap samples (CHB, JPT, YRI and CEU). These were converted to distances and subjected to multidimensional scaling (Figure S1). Using the first two components, we calculated the proportion of European ancestry for each individual [12] and excluded samples with.22% non-European ancestry (Figure S1). A total of 11,705 samples and 201,242 SNPs were available for analysis, including 31,812 SNPs selected by the BRCA1GWAS. The genotyping cluster plots for all SNPs that demonstrated genome-wide significance level of association or are presented below, were checked manually for quality (Figure S2).
iPLEX analysis. The most significant SNPs from 4 loci
associated with ovarian cancer and 8 loci associated with breast cancer were selected (17 SNPs in total) for stage 3 genotyping. Genotyping using the iPLEX Mass Array platform was performed at Mayo Clinic. CIMBA QC procedures were applied. Samples that failed for$20% of the SNPs were excluded from the analysis. No SNPs failed HWE (P,0.01). The concordance among duplicates was $98%. Mutation carriers of self-reported non-European ancestry were excluded. A total of 2,646BRCA1samples were eligible for analysis after QC.
Statistical methods
The main analyses were focused on the evaluation of associations between each genotype and breast cancer or ovarian cancer risk separately. Analyses were carried out within a survival analysis framework. In the breast cancer analysis, the phenotype of each individual was defined by age at breast cancer diagnosis or age at last follow-up. Individuals were followed until the age of the first breast cancer diagnosis, ovarian cancer diagnosis, or bilateral prophylactic mastectomy, whichever occurred first; or last observation age. Mutation carriers censored at ovarian cancer diagnosis were considered unaffected. For the ovarian cancer analysis, the primary endpoint was the age at ovarian cancer diagnosis. Mutation carriers were followed until the age of ovarian cancer diagnosis, or risk-reducing salpingo-oophorectomy (RRSO) or age at last observation. In order to maximize the number of ovarian cancer cases, breast cancer was not considered as a censoring event in this analysis, and mutation carriers who developed ovarian cancer after a breast cancer diagnosis were considered as affected in the ovarian cancer analysis.
Association analysis. The majority of mutation carriers
were sampled through families seen in genetic clinics. The first tested individual in a family is usually someone diagnosed with cancer at a relatively young age. Such study designs tend to lead to an over-sampling of affected individuals, and standard analytical methods like Cox regression may lead to biased estimates of the risk ratios [16,17]. To adjust for this potential bias the data were analyzed within a survival analysis framework, by modeling the retrospective likelihood of the observed genotypes conditional on the disease phenotypes. A detailed description of the retrospective likelihood approach has been published [17,18]. The associations
between genotype and breast cancer risk at both stages were assessed using the 1 d.f. score test statistic based on this retrospective likelihood [17,18]. To allow for the non-indepen-dence among related individuals, we accounted for the correlation between the genotypes by estimating the kinship coefficient for each pair of individuals using the available genomic data [16,19,20] and by robust variance estimation based on reported family membership [21]. We chose to present P-values based on the kinship adjusted score test as it utilises the degree of relationship between individuals. A genome-wide level of signif-icance of 561028was used [22]. These analyses were performed in R using the GenABEL [23] libraries and custom-written functions in FORTRAN and Python.
To estimate the magnitude of the associations (HRs), the effect of each SNP was modeled either as a per-allele HR (multiplicative model) or as genotype-specific HRs, and were estimated on the log-scale by maximizing the retrospective likelihood. The retro-spective likelihood was fitted using the pedigree-analysis software MENDEL [17,24]. As sample sizes varied substantially between contributing centers heterogeneity was examined at the country level. All analyses were stratified by country of residence and used calendar-year and cohort-specific breast cancer incidence rates for
BRCA1[25]. Countries with small number of mutation carriers were combined with neighbouring countries to ensure sufficiently large numbers within each stratum (Table S2). USA and Canada were further stratified by reported Ashkenazi Jewish (AJ) ancestry due to large numbers of AJ carriers. In stage 3 analysis involving several countries with small numbers of mutation carriers, we assumed only 3 large strata (Europe, Australia, USA/Canada). The combined iCOGS stage and stage 3 analysis was also stratified by stage of the experiment. The analysis of associations by breast cancer ER-status was carried out by an extension of the retrospective likelihood approach to model the simultaneous effect of each SNP on more than one tumor subtype [26] (Text S1).
Competing risk analysis. The associations with breast and
ovarian cancer risk simultaneously were assessed within a compet-ing risk analysis framework [17] by estimatcompet-ing HRs simultaneously for breast and ovarian cancer risk. This analysis provides unbiased estimates of association with both diseases and more powerful tests of association in cases where an association exists between a variant and at least one of the diseases [17]. Each individual was assumed to be at risk of developing either breast or ovarian cancer, and the probabilities of developing each disease were assumed to be independent conditional on the underlying genotype. A different censoring process was used, whereby individuals were followed up to the age of the first breast or ovarian cancer diagnosis and were considered to have developed the corresponding disease. No follow-up was considered after the first cancer diagnosis. Individuals censored for breast cancer at the age of bilateral prophylactic mastectomy and for ovarian cancer at the age of RRSO were assumed to be unaffected for the corresponding disease. The remaining individuals were censored at the last observation age and were assumed to be unaffected for both diseases.
Imputation. For the SNP selection process, the MACH
Absolute breast and ovarian cancer risks by combined
SNP profile. We estimated the absolute risk of developing
breast and ovarian cancer based on the joint distribution of all SNPs that were significantly associated with risk for BRCA1
mutation carriers based on methods previously applied toBRCA2
carriers [28]. We assumed that the average, age-specific breast and ovarian cancer incidences forBRCA1mutation carriers, over all modifying loci, agreed with published penetrance estimates for
BRCA1 [25]. The model assumed independence among the modifying loci and we used only the SNP with the strongest evidence of association from each region. We used only loci identified through theBRCA1GWAS that exhibited associations at a genome-wide significance level, and loci that were identified through population-based GWAS of breast or ovarian cancer risk, but were also associated with those risks for BRCA1 mutation carriers. For each SNP, we used the per-allele HR and minor allele frequencies estimated from the present study. Genotype frequen-cies were obtained under the assumption of HWE.
Results
Samples from 11,705BRCA1 carriers from 45 centers in 25 countries yielded high-quality data for 201,242 SNPs on the iCOGS array. The array included 31,812BRCA1GWAS SNPs, which were analyzed here for their associations with breast and ovarian cancer risk forBRCA1mutation carriers (Table S2). Of the 11,705 BRCA1 mutation carriers, 2,387 samples had also been genotyped for stage 1 of the GWAS and 9,318 were unique to the stage 2 iCOGS study.
Breast cancer associations
When restricting analysis to stage 2 samples (4,681 unaffected, 4,637 affected), there was little evidence of inflation in the association test-statistic (l= 1.038; Figure S3). Combined analysis of stage 1 and 2 samples (5,784 unaffected, 5,920 affected) revealed 66 SNPs in 28 regions with P,1024(Figure S4). These included variants from three loci (19p13, 6q25.1, 12p11) previously associated with breast cancer risk for BRCA1 mutation carriers (Table 1). Further evaluation of 18 loci associated with breast cancer susceptibility in the general population found that only the
TOX3,LSP1, 2q35 andRAD51L1loci were significantly associated with breast cancer forBRCA1carriers (Table 1, Table S4).
After excluding SNPs from the known loci, there were 39 SNPs in 25 regions with P = 1.261026–1.061024. Twelve of these SNPs were genotyped by iPLEX in an additional 2,646BRCA1carriers (1,252 unaffected, 1,394 affected, ‘‘stage 3’’ samples, Table S5). There was additional evidence of association with breast cancer risk for four SNPs at two loci (P,0.01, Table 2). When all stages were combined, SNPs rs2290854 and rs6682208 (r2= 0.84) at 1q32, near
MDM4, had combinedP-values of association with breast cancer risk of 1.461027and 461027,respectively. SNPs rs11196174 and rs11196175 (r2= 0.96) at 10q25.3 (in TCF7L2) had combined P-values of 7.561027and 1.261026. Analysis within a competing risks framework, where associations with breast and ovarian cancer risks are evaluated simultaneously [17], revealed stronger associa-tions with breast cancer risk for all 4 SNPs, but no associaassocia-tions with ovarian cancer (Table 3). In particular, we observed a genome-wide significant association between the minor allele of rs2290854 from 1q32 and breast cancer risk (per-allele HR: 1.14; 95%CI: 1.09– 1.20; p = 2.761028). Country-specific HR estimates for all SNPs are shown in Figure S5. Analyses stratified byBRCA1mutation class revealed no significant evidence of a difference in the associations of any of the SNPs by the predicted functional consequences ofBRCA1
mutations (Table S6). SNPs in theMDM4andTCF7L2loci were
associated with breast cancer risk for both class1 and class2 mutation carriers.
Both the 1q32 and 10q25.3 loci were primarily associated with ER-negative breast cancer for BRCA1 (rs2290854: ER-negative HR = 1.16, 95%CI: 1.10–1.22, P = 1.261027; rs11196174: HR = 1.14, 95%CI: 1.07–1.20, P = 9.661026), although the differ-ences between the ER-negative and ER-positive HRs were not significant (Table S7). Given that ER-negative breast cancers in
BRCA1 and BRCA2 mutation carriers are phenotypically similar [29], we also evaluated associations between these SNPs and ER-negative breast cancer in 8,211BRCA2mutation carriers. While the 10q25.3 SNPs were not associated with overall or ER-negative breast cancer risk forBRCA2carriers, the 1q32 SNPs were associated with ER-negative (rs2290854 HR = 1.16, 95%CI:1.01–1.34, P = 0.033; rs6682208 HR = 1.19, 95%CI:1.04–1.35, P = 0.016), but not ER-positive breast cancer (rs2290854 diff = 0.006; rs6682208 P-diff = 0.001). Combining theBRCA1andBRCA2samples provided strong evidence of association with ER-negative breast cancer (rs2290854: P = 1.2561028; rs6682208: P = 2.561027).
The iCOGS array included additional SNPs from the 1q32 region that were not chosen based on theBRCA1GWAS. Of these non-BRCA1 GWAS SNPs, only SNP rs4951407 was more significantly associated with risk than theBRCA1-GWAS selected SNPs (P = 3.361026, HR = 1.12, 95%CI:1.07–1.18, using stage 1 and stage 2 samples). The evidence of association with breast cancer risk was again stronger under the competing risks analysis (HR = 1.14, 95%CI: 1.08–1.20, P = 6.161027). Backward multiple regression analysis, considering only the genotyped SNPs (P,0.01), revealed that the most parsimonious model included only rs4951407. SNPs from the 1000 Genomes Project, were imputed for the stage 1 and stage 2 samples (Figure S6). Only imputed SNP rs12404974, located betweenPIK3C2BandMDM4(r2= 0.77 with rs4951407), was more significantly associated with breast cancer (P = 2.761026) than any of the genotyped SNPs. None of the genotyped or imputed SNPs from 10q25.3 provided P-values smaller than those for rs11196174 and rs11196175 (Figure S7).
Ovarian cancer associations
Analyses of associations with ovarian cancer risk using the stage 2 samples (8,054 unaffected, 1,264 affected) revealed no evidence of inflation in the association test-statistic (l= 1.039, Figure S3). In the combined analysis of stage 1 and 2 samples (9866 unaffected, 1839 affected), 62 SNPs in 17 regions were associated with ovarian cancer risk for BRCA1carriers at P,1024 (Figure S3). These included SNPs in the 9p22 and 3q25 loci previously associated with ovarian cancer risk in both the general population andBRCA1carriers [6,7] (Table 1). Associations (P,0.01) with ovarian cancer risk were also observed for SNPs in three other known ovarian cancer suscepti-bility loci (8q24, 17q21, 19p13), but not 2q31 (Table 1). For all loci except 9p22, SNPs were identified that displayed smaller P-values of association than previously published results [5–7].
After excluding SNPs from known ovarian cancer susceptibility regions, there were 48 SNPs in 15 regions with P = 561027 to 1024. Five SNPs from four of these loci were genotyped in the stage 3 samples (2,204 unaffected, 442 with ovarian cancer). Three SNPs showed additional evidence of association with ovarian cancer risk (P,0.02, Table 2; Table S5). In the combined stage 1– 3 analyses, SNPs rs17631303 and rs183211 (r2= 0.68) on chromosome 17q21.31 had P-values for association of 161028 and 361028respectively, and rs4691139 at 4q32.3 had a P-value of 3.461028(Table 2).
the associations within a competing risks framework, revealed no association with breast cancer risk (Table 3). The ovarian cancer effect size was maintained in the competing risk analysis but the significance of the association was slightly weaker (P = 261026–
[image:11.612.63.555.97.665.2]161025). This is expected because 663 ovarian cancer cases occurring after a primary breast cancer diagnosis were excluded for this analysis. The evidence of association was somewhat stronger under the genotype-specific model (2-df P = 1.661029
Table 2.Associations with breast and ovarian cancer risk for SNPs found to be associated with risk at all 3 stages of the experiment.
SNP, Chr, Position, Allele1/
Allele2 Stage Number Allele 2 Frequency HR* (95% CI)
Unaffected Affected Unaffected Affected Per Allele Heterozygote Homozygote P-trend
Breast Cancer
rs2290854, 1q32, 202782648, G/A Stage 1 1104 1283 0.30 0.34 1.19 (1.08–1.30) 1.28 (1.12–1.47) 1.31 (1.06–1.61) 4.261024
Stage 2 4681 4637 0.31 0.33 1.09 (1.03–1.16) 1.10 (1.02–1.19) 1.18 (1.03–1.35) 0.003
Stages1+2 5785 5920 0.31 0.33 1.12 (1.06–1.17) 1.15 (1.07–1.23) 1.21 (1.08–1.36) 1.761025
Stage 3 1252 1393 0.30 0.33 1.19 (1.07–1.32) 1.24 (1.07–1.43) 1.36 (1.06–1.74) 0.0013
Combined 7037 7313 0.31 0.33 1.13 (1.08–1.18) 1.16 (1.09–1.24) 1.24 (1.11–1.37) 1.461027
rs6682208, 1q32, 202832806, G/A Stage 1 1104 1283 0.32 0.35 1.14 (1.04–1.25) 1.24 (1.09–1.42) 1.20 (0.98–1.47) 0.0070
Stage 2 4681 4637 0.32 0.34 1.10 (1.04–1.17) 1.09 (1.01–1.19) 1.21 (1.06–1.38) 0.0014
Stages1+2 5785 5920 0.32 0.34 1.11 (1.05–1.17) 1.13 (1.05–1.21) 1.21 (1.08–1.35) 5.461025
Stage 3 1250 1394 0.30 0.34 1.19 (1.07–1.32) 1.31 (1.14–1.51) 1.28 (1.01–1.63) 8.661024
Combined 7035 7314 0.32 0.34 1.12 (1.07–1.17) 1.16 (1.09–1.23) 1.22 (1.11–1.35) 4.361027
rs11196174, 10q25.3, 114724086, A/G
Stage 1 1103 1282 0.27 0.32 1.15 (1.05–1.27) 1.17 (1.03–1.34) 1.31 (1.05–1.63) 0.0038
Stage 2 4681 4636 0.29 0.31 1.10 (1.04–1.17) 1.13 (1.04–1.23) 1.17 (1.01–1.35) 0.0017
Stages1+2 5784 5918 0.28 0.31 1.12 (1.06–1.18) 1.14 (1.06–1.23) 1.21 (1.07–1.37) 3.161025
Stage 3 1251 1393 0.28 0.31 1.16 (1.05–1.29) 1.08 (0.93–1.25) 1.46 (1.15–1.85) 0.0057
Combined 7035 7311 0.28 0.31 1.13 (1.07–1.18) 1.13 (1.06–1.21) 1.26 (1.13–1.40) 7.561027
rs11196175, 10q25.3, 114726604, A/G
Stage 1 1101 1280 0.27 0.31 1.15 (1.05–1.27) 1.18 (1.03–1.35) 1.29 (1.03–1.62) 0.0043
Stage 2 4674 4627 0.28 0.30 1.10 (1.03–1.17) 1.13 (1.04–1.22) 1.17 (1.01–1.35) 0.0020
Stages1+2 5775 5907 0.28 0.30 1.12 (1.06–1.18) 1.14 (1.06–1.22) 1.21 (1.07–1.37) 3.961025
Stage 3 1251 1394 0.27 0.31 1.16 (1.04–1.29) 1.06 (0.91–1.22) 1.48 (1.17–1.87) 0.0075
Combined 7026 7301 0.28 0.31 1.12 (1.07–1.18) 1.12 (1.05–1.20) 1.26 (1.13–1.41) 1.261026
Ovarian Cancer
rs17631303, 17q21, 40872185, A/G Stage 1 1797 574 0.19 0.25 1.46 (1.22–1.74) 1.36 (1.01–1.68) 2.46 (1.53–3.96) 1.361025
Stage 2 7996 1257 0.19 0.21 1.20 (1.07–1.35) 1.10 (0.96–1.26) 1.83 (1.34–2.48) 1.561023
Stages1+2 9793 1831 0.19 0.22 1.27 (1.16–1.40) 1.15 (1.03–1.29) 2.03 (1.16–2.61) 3.061027
Stage 3 2204 442 0.17 0.21 1.27 (1.07–1.51) 1.24 (0.99–1.56) 1.67 (1.07–2.62) 0.014
Combined 11997 2273 0.19 0.22 1.27 (1.17–1.38) 1.17 (1.06–1.29) 1.95 (1.57–2.42) 1.461028
rs183211, 17q21, 42143493, G/A Stage 1 1812 575 0.22 0.28 1.45 (1.23–1.71) 1.37 (1.11–1.69) 2.29 (1.53–3.41) 2.561025
Stage 2 8054 1264 0.23 0.25 1.20 (1.07–1.33) 1.13 (0.99–1.28) 1.62 (1.22–2.14) 1.161023
Stages1+2 9866 1839 0.23 0.26 1.25 (1.15–1.37) 1.16 (1.04–1.29) 1.83 (1.46–2.28) 5.761027
Stage 3 2204 442 0.22 0.26 1.25 (1.06–1.48) 1.15 (0.92–1.44) 1.79 (1.21–2.67) 0.018
Combined 12070 2281 0.23 0.26 1.25 (1.16–1.35) 1.16 (1.05–1.27) 1.82 (1.5–2.21) 3.161028
rs4691139, 4q32.3, 166128171, A/G Stage 1 1812 575 0.47 0.53 1.24 (1.08–1.42) 1.46 (1.13–1.88) 1.55 (1.16–2.05) 3.661023
Stage 2 8054 1264 0.48 0.52 1.18 (1.08–1.29) 1.29 (1.10–1.50) 1.40 (1.17–1.67) 1.361024
Stages1+2 9866 1839 0.48 0.52 1.20 (1.11–1.29) 1.33 (1.17–1.52) 1.44 (1.24–1.67) 1.161026
Stage 3 2204 441 0.47 0.52 1.20 (1.04–1.39) 1.19 (0.91–1.54) 1.44 (1.08–1.94) 961023
Combined 12070 2280 0.48 0.52 1.20 (1.17–1.38) 1.30 (1.16–1.46) 1.44 (1.26–1.65) 3.461028
and P = 2.661029for rs17631303 and rs183211 respectively in all samples combined) with larger HR estimates for the rare homozygote genotypes than those expected under a multiplicative model (Table 2).
Previous studies of the known common ovarian cancer susceptibility alleles found significant associations with ovarian cancer for both BRCA1 and BRCA2 carriers [6,7]. Thus, we evaluated the associations between the 17q21.31 SNPs and ovarian cancer risk for BRCA2 carriers using iCOGS genotype data (7580 unaffected and 631 affected). Both rs17631303 and rs183211 were associated with ovarian cancer risk for BRCA2
carriers (P = 1.9861024and 9.2661024), with similar magnitude and direction of association as for BRCA1 carriers. Combined analysis ofBRCA1and BRCA2mutation carriers provided strong evidence of association (P = 2.80610210and 2.0161029, Table 4). The combined analysis of stage 1 and 2 samples, and BRCA2
carriers, identified seven SNPs on the iCOGS array (pairwise r2 range: 0.68–1.00) from a 1.3 Mb (40.8–42.1 Mb, build 36.3) region of 17q21.31 that were strongly associated (P,1.2761029) with ovarian cancer risk (Table 4, Figure 2). Stepwise-regression analysis based on observed genotype data retained only one of the seven SNPs in the model, but it was not possible to distinguish between the SNPs. Imputation through the 1000 Genomes Project, revealed several SNPs in 17q21.31 with stronger associations (Figure 2, Table S8) than the most significant genotyped SNP in the combined
BRCA1/2 analysis (rs169201, P = 6.24610211). The most signifi-cant SNP (rs140338099 (17-44034340), P = 3610212), located in
MAPT, was highly correlated (r2= 0.78) with rs169201 in NSF
(Figure 2). This locus appears to be distinct from a previously identified ovarian cancer susceptibility locus located.1 Mb distal on 17q21 (spanning 43.3–44.3 Mb, build 36.3) [30]. None of the SNPs in the novel region were strongly correlated with any of the SNPs in the 43.3–44.3 Mb region (maximum r2= 0.07, Figure S8). The most significantly associated SNP from theBRCA1 GWAS from the 43.3–44.3 Mb locus was rs11651753 (p = 4.661024) (Table 1) (r2,0.023 with the seven most significant SNPs in the novel 17q21.31 region). An analysis of the joint associations of rs11651753 and rs17631303 from the two 17q21 loci with ovarian cancer risk forBRCA1carriers (Stage 1 and 2 samples) revealed that both SNPs remained significant in the model (P-for inclu-sion = 0.001 for rs11651753, 1.261026 for rs17631303), further suggesting that the two regions are independently associated with ovarian cancer forBRCA1carriers.
The minor allele of rs4691139 at the novel 4q32.3 region was also associated with an increased ovarian cancer risk forBRCA1
carriers (per-allele HR = 1.20, 95%CI:1.17–1.38, Table 2), but was not associated with breast cancer risk (Table 3). No other SNPs from the 4q32.3 region on the iCOGS array were more significantly associated with ovarian cancer for BRCA1carriers. Analysis of associations with variants identified through 1000 Genomes Project-based imputation of the Stage 1 and 2 samples, revealed 19 SNPs with stronger evidence of association (P = 5.461027to 1.161026) than rs4691139 (Figure S9). All were highly correlated (pairwise r2.0.89) and the most significant (rs4588418) had r2= 0.97 with rs4691139. There was no evidence for association between rs4691139 and ovarian cancer risk for
BRCA2carriers (HR = 1.08, 95%CI: 0.96–1.21, P = 0.22).
Absolute risks of developing breast and ovarian cancer
The current analyses suggest that 10 loci are now known to be associated with breast cancer risk for BRCA1 mutation carriers: 1q32, 10q25.3, 19p13, 6q25.1, 12p11, TOX3, 2q35, LSP1 and
RAD51L1all reported here andTERT[31]. Similarly, seven loci are associated with ovarian cancer risk for BRCA1 mutation
carriers: 9p22, 8q24, 3q25, 17q21, 19p13, 17q21.31 and 4q32.3. Figure S10 shows the range of combined HRs at different percentiles of the combined genotype distribution, based on the single SNP HR and minor allele estimates from Table 1, Table 2, and Table S4 and for TERT from Bojesen et al [31] and assuming that all SNPs interact multiplicatively. Relative to BRCA1
mutation carriers at lowest risk, the median, 5th and 95th percentile breast cancer HRs were 3.40, 2.27, and 5.35 respectively. These translate to absolute risks of developing breast cancer by age 80 of 65%, 51% and 81% for those at median, 5th and 95th percentiles of the combined genotype distribution (Figure 3, Figure S10). Similarly, the median, 5th and 95th percentile combined HRs for ovarian cancer were 6.53, 3.75 and 11.12 respectively, relative to those at lowest ovarian cancer risk (Figure S10). These HRs translate to absolute risks of developing ovarian cancer of 44%, 28% and 63% by age 80 for the median, 5th and 95th percentile of the combined genotype distribution (Figure 3).
Discussion
In this study we analyzed data from 11,705 BRCA1mutation carriers from CIMBA who were genotyped using the iCOGS high-density custom array, which included 31,812 SNPs selected on the basis of aBRCA1GWAS. This study forms the large-scale replication stage of the first GWAS of breast and ovarian cancer risk modifiers forBRCA1mutation carriers. We have identified a novel locus at 1q32, containing the MDM4 oncogene, that is associated with breast cancer risk for BRCA1 mutation carriers (P,561028). A separate locus at 10q23.5, containing theTCF7L2
gene, provided strong evidence of association with breast cancer risk for BRCA1 carriers but did not reach a GWAS level of significance. We have also identified two novel loci associated with ovarian cancer for BRCA1 mutation carriers at 17q21.31 and 4q32.2 (P,561028). We further confirmed associations with loci previously shown to be associated with breast or ovarian cancer risk for BRCA1 mutation carriers. In most cases stronger associations were detected with either the same SNP reported previously (due to increased sample size) or other SNPs in the regions. Future fine mapping studies of these loci will aim to identify potentially causal variants for the observed associations.
Although the 10q25.3 locus did not reach the strict GWAS level of significance for association with breast cancer risk, the association was observed at all three independent stages of the experiment. Additional evidence for the involvement of this locus in breast cancer susceptibility comes from parallel studies of the Breast Cancer Association Consortium (BCAC). SNPs at 10q25.3 had also been independently selected for inclusion on the iCOGS array through population based GWAS of breast cancer. Analyses of those SNPs in BCAC iCOGS studies also found that SNPs at 10q25.3 were associated with breast cancer risk in the general population [32]. Thus, 10q25.3 is likely a breast cancer risk-modifying locus forBRCA1mutation carriers. The most significant SNPs at 10q25.3 were located inTCF7L2, a transcription factor that plays a key role in the Wnt signaling pathway and in glucose homeostasis, and is expressed in normal and malignant breast tissue (The Cancer Genome Atlas (TCGA)). Variation in the
TCF7L2locus has previously been associated with Type 2 diabetes in a number of GWAS. The most significantly associated SNPs with Type 2 diabetes (rs7903146 and rs4506565) [22,33] were also associated with breast cancer risk forBRCA1mutation carriers in stage 1 and 2 analyses (p = 3.761024 and p = 2.561024 respec-tively); these SNPs were correlated with the most significant hit (rs11196174) forBRCA1breast cancer (r2= 0.40 and 0.37 based
Figure 2. Mapping of the 17q21 locus.Top 3 panels:P-values of association (2log10scale) with ovarian cancer risk for genotyped and imputed
SNPs (1000 Genomes Project CEU), by chromosome position (b.37) at the 17q21 region, forBRCA1,BRCA2mutation carriers and combined. Results based on the kinship-adjusted score test statistic (1 d.f.).Fourth panel:Genes in the region spanning (43.4–44.9 Mb, b.37) and the location of the most significant genotyped SNPs (in red font) and imputed SNPs (in black font).Bottom panel:Pairwise r2values for genotyped SNPs on iCOG array in the 17q21 region covering positions (43.4–44.9 Mb, b.37).
on stage 1 and 2 samples). This raises the possibility that variants in this locus influence breast cancer indirectly through effects on cellular metabolism.
We found that SNPs at 1q32 were primarily associated with ER-negative breast cancer risk for BRCA1 mutation carriers. There was also evidence of association with ER-negative breast cancer forBRCA2mutation carriers. SNPs at the 1q32 region were independently selected for inclusion on iCOGS through GWAS of breast cancer in the general population by BCAC. In parallel analyses of iCOGS data by BCAC, 1q32 was found to be associated with ER-negative breast cancer [34] but not overall breast cancer risk [32]. Taken together, these results are in agreement with our findings and in line with the observation that the majority ofBRCA1breast cancers are ER-negative. However, they are not in agreement with a previous smaller candidate-gene study that found an association between a correlated SNP in
MDM4 (r2.0.85) and overall breast cancer risk [35]. The 1q32 locus includes the MDM4 oncogene which plays a role in regulation of p53 and MDM2 and the apoptotic response to cell stress. MDM4 is expressed in breast tissue and is amplified and overexpressed along withLRRN2andPIK3C2Bin breast and other tumor types (TCGA) [36–38]. Although fine mapping will be
necessary to identify the functionally relevant SNPs in this locus, we found evidence of cis-regulatory variation impactingMDM4
expression [39–41] (Text S1, Table S9, Figure S11), suggesting that common variation in the 1q32 locus may influence the risk of breast cancer through direct effects onMDM4expression.
[image:15.612.70.532.61.380.2]Several correlated SNPs at 17q21.31 from the iCOGS array provided strong evidence of association with ovarian cancer risk in bothBRCA1andBRCA2mutation carriers. A subsequent analysis of these SNPs, which were selected through theBRCA1GWAS, in case-control samples from the Ovarian Cancer Association Consortium (OCAC), revealed that the 17q21.31 locus is associated with ovarian cancer risk in the general population [Wey et al, personal communication]. Thus, 17q21.31 is likely a novel susceptibility locus for ovarian cancer inBRCA1mutation carriers. The most significant associations at 17q21.31 were clustered in a large region of strong linkage disequilibrium which has previously been identified as a ‘‘17q21.31 inversion’’ (,900 kb long) consisting of two haplotypes (termed H1 and H2) [42]. The minor allele of rs2532348 (MAF = 0.21), which tags H2, was associated with increased ovarian cancer risk forBRCA1mutation carriers (Table 4). The 1.3 Mb 17q21.31 locus contains 13 genes and several predicted pseudogenes (Figure 2), several of which are
Figure 3. Predicted breast and ovarian cancer absolute risks forBRCA1mutation carriers at the 5th, 10th, 90th, and 95thpercentiles
of the combined SNP profile distributions.The minimum, maximum and average risks are also shown. Predicted cancer risks are based on the
associations of known breast or ovarian cancer susceptibility loci (identified through GWAS) with cancer risk forBRCA1mutation carriers and loci identified through the present study. Breast cancer risks based on the associations with: 1q32, 10q25.3, 19p13, 6q25.1, 12p11,TOX3, 2q35,LSP1,
RAD51L1(based on HR and minor allele frequency estimates from Table 1, Table 2, and Table S4) andTERT[31]. Ovarian cancer risks based on the associations with: 9p22, 8q24, 3q25, 17q21, 19p13 (Table 1) and 17q21.31, 4q32.3 (Table 2). Only the top SNP from each region was chosen. Average breast and ovarian cancer risks were obtained from published data [25]. The methods for calculating the predicted risks have been described previously [28].
expressed in normal ovarian surface epithelium and ovarian adenocarcinoma [43]. Variation in this region has been associated with Parkinson’s disease (MAPT, PLEKHM1, NSF, c17orf69) progressive supranuclear palsy (MAPT), celiac disease (WNT3), bone mineral density (CRHR1) (NHGRI GWAS catalog) and intracranial volume [44]. Of the top hits for these phenotypes, SNP rs199533 in NSF, previously associated with Parkinson’s disease [45] and rs9915547 associated with intracranial volume [44] were strongly associated with ovarian cancer (P,1029 in
BRCA1/2 combined). Whether these phenotypes have shared causal variants in this locus remains to be elucidated. Further exploration of the functional relevance of the strongest hits in the 17q21.31 locus (P,1028 in BRCA1/2 combined) provided evidence that cis-regulatory variation alters expression of several genes at 17q21, including PLEKHM1, c17orf69, ARHGAP27,
MAPT, KANSL1 and WNT3 [39,41] (Table S9, Figure S12), suggesting that ovarian cancer risk may be associated with altered expression of one or more genes in this region.
Our analyses revealed that a second novel locus at 4q32.3 was also associated with ovarian cancer risk for BRCA1 mutation carries (P,561028). However, we found no evidence of associ-ation for these SNPs with ovarian cancer risk forBRCA2mutation carriers using 8,211 CIMBA samples genotyped using the iCOGS array. Likewise, no evidence of association was found between rs4691139 at 4q32.3 and ovarian cancer risk in the general population based on data by OCAC data derived from 18,174 cases and 26,134 controls (odds ratio = 1.00, 95%CI:0.97–1.04, P = 0.76) [46]. The confidence intervals rule out a comparable effect to that found in BRCA1 carriers. Therefore, our findings may represent a BRCA1-specific association with ovarian cancer risk, the first of its kind. The 4q32.2 region contains several members of the TRIM(Tripartite motif containing) gene family,
c4orf39 and TMEM192. TRIM60, c4orf39 and TMEM192 are expressed in normal ovarian epithelium and/or ovarian tumors (TCGA).
In summary, we have identified a novel locus at 1q32 associated with breast cancer risk for BRCA1mutation carriers, which was also associated with ER-negative breast cancer forBRCA2carriers and in the general population. A separate locus at 10q23.5 provided strong evidence of association with breast cancer risk for
BRCA1 carriers. We have also identified 2 novel loci associated with ovarian cancer forBRCA1 mutation carriers. Of these, the 4q32.2 locus was associated with ovarian cancer risk for BRCA1
carriers but not forBRCA2carriers or in the general population. Additional functional characterisation of the loci will further improve our understanding of the biology of breast and ovarian cancer development inBRCA1carriers. Taken together with other identified genetic modifiers, 10 loci are now known to be associated with breast cancer risk for BRCA1 mutation carriers (1q32, 10q25.3, 19p13, 6q25.1, 12p11, TOX3, 2q35, LSP1,
RAD51L1andTERT and seven loci are known to be associated with ovarian cancer risk forBRCA1mutation carriers (9p22, 8q24, 3q25, 17q21, 19p13 and 17q21.31, 4q32.3).
As BRCA1 mutations confer high breast and ovarian cancer risks, the results from the present study, taken together with other identified genetic modifiers, demonstrate for the first time that they can result in large differences in the absolute risk of developing breast or ovarian cancer for BRCA1 between genotypes. For example, the breast cancer lifetime risks for the 5% of BRCA1
carriers at lowest risk are predicted to be 28–50% compared to 81–100% for the 5% at highest risk (Figure 3). Based on the distribution of ovarian cancer risk modifiers, the 5% of BRCA1
mutation carriers at lowest risk will have a lifetime risk of developing ovarian cancer of 28% or lower whereas the 5% at
highest risk will have a lifetime risk of 63% or higher. Similarly, the breast cancer risk by age 40 is predicted to be 4–9% for the 5% ofBRCA1carriers at lowest risk compared to 20–49% for the 5% at highest risk, whereas the ovarian cancer risk at age 50 ranges from 3–7% for the 5% at lowest risk and from 18–47% for the 5% at highest risk. The risks at all ages for the 10% at highest or lowest risk of breast and ovarian cancer are predicted to be similar to those for the highest and lowest 5%. Thus, at least 20% of BRCA1 mutation carriers are predicted to have absolute risks of disease that are different from the averageBRCA1carriers. These large differences in cancer risks may have practical implications for the clinical management ofBRCA1mutation carriers, for example in deciding the timing of interventions. Such risks, in combination with other lifestyle and hormonal risk factors could be incorpo-rated into cancer risk prediction algorithms for use by clinical genetics centers. These algorithms could then be used to inform the development of effective and consistent clinical recommenda-tions for the clinical management ofBRCA1mutation carriers.
Supporting Information
Figure S1 Multidimensional scaling of stage 1 and stage 2
(genotyped on iCOGS) samples. Panel A: Graphical representa-tion of the first two components, for the BRCA1 carriers, for subgroups defined by the common 185delAG (c.68_69delAG)
BRCA1 Jewish founder mutation, the 5382insC (c.5266dupC) Eastern European founder mutation and Hapap individuals (CEU: European; ASI: Includes CHB and JPT populations; YRI: African). Panel B: Red dots represent the samples with .22% non-European ancestry, excluded from the analysis. (PDF)
Figure S2 Genotyping cluster plots in the BRCA1samples for
the key associated SNPs. (PDF)
Figure S3 Quantile-quantile plot for the kinship adjusted score
test statistic for stage 2 samples (1 degree of freedomx2
trend test) for the associations with breast cancer (panel A) and ovarian cancer (panel B) risk forBRCA1mutation carriers. The y = x line corresponds to the expected distribution, under the hypothesis of no inflation. Inflation was estimated using the values of the lowest 90% test statistics.
(PDF)
Figure S4 P-values (on2log10scale) by chromosomal position,
for the associations of 31,812BRCA1 GWAS SNPs with breast (panel A) and ovarian (panel B) cancer risk forBRCA1mutation carriers in the combined stage 1 and stage 2 samples. Blue lines correspond to a P-value of 1025; red lines correspond to P-value 561028.
(PDF)
Figure S5 Forest plots of the associations by country of residence
P-het = 0.12, df = 18), or when restricting analyses to Stage 1 and 2 samples only (P-het = 0.09, df = 19). There was no evidence of heterogeneity for correlated SNP rs183211 (P-het = 0.10). There was no evidence of hereterogeneity in the country-specific HRs for any of the other SNPs (P.0.68).
(PDF)
Figure S6 MDM4regional association plot usingBRCA1stage 1
and stage 2 samples. P-values for association (2log10scale) with breast cancer risk for BRCA1 mutation carriers for genotyped SNPs (diamond symbols e) and SNPs imputed from the 1000 genomes project data (square symbols%), by position (hg18) on chromosome 1. Red gradient represents r2 value with the most significant genotyped SNP rs4951407. The blue peaks represent recombination rate in the region.
(PDF)
Figure S7 TCF7L2regional association plot usingBRCA1stage
1 and stage 2 samples. P-values for association (2log10scale) with breast cancer risk for BRCA1 mutation carriers for genotyped SNPs (diamond symbols e) and SNPs imputed from the 1000 genomes project data (square symbols%), by position (hg18) on chromosome 1. Missing genotypes were replaced by imputed results. Red gradient represents r2value with the most significant genotyped SNP rs11196174. The blue peaks represent recombi-nation rate in the region.
(PDF)
Figure S8 Linkage disequilibrium patterns between the SNPs in
the novel (17q21.31) and previously identified regions on 17q21. SNPs in the novel region are uncorrelated with SNPs in the 43.3– 44.3 Mb region (positions according to hg build 36.3).
(PDF)
Figure S9 4q32.3 regional association plot usingBRCA1stage 1
and stage 2 samples. P-values for association (2log10scale) with ovarian cancer risk for BRCA1 mutation carriers for genotyped SNPs (diamond symbols e) and imputed SNPs from the 1000 genomes project data (square symbols%), by position (hg18) on chromosome 1. Red gradient represents r2 value with the most significant genotyped SNP rs4691139. Blue peaks represent recombination rate in the region.
(PDF)
Figure S10 Combined Hazard Ratios (HR) for breast and
ovarian cancer for BRCA1mutation carriers. (A) HR for Breast Cancer based on 10 loci associated with breast cancer risk for
BRCA1 mutation carriers. (B) Ovarian Cancer based on 7 loci associated with ovarian cancer risk forBRCA1mutation carriers. All HRs computed relative to the lowest risk category. The Y-axes translate the combined HRs into absolute risks of developing breast or ovarian cancer by age 80. The absolute risks and HRs at different percentiles of the combined genotype distribution are also marked. The combined HRs were obtained under the assumption that the loci interact multiplicatively.
(PDF)
Figure S11 Cis-eQTL and allelic expression (AE) analyses at
MDM4 locus. A) Cis-eQTLs for SNPs at MDM4 locus using expression data from primary human osteoblasts (HOb). B) AE mapping for cis-regulatory variation inMDM4locus using primary skin fibroblasts. Coordinates (hg18) for locus shown on top; blue tracks indicate the 2log10(P value) of the association across all SNPs tested. The location of transcripts in this region is shown below.
(PDF)
Figure S12 Cis-eQTL and allelic expression (AE) analyses at
chr17q21.31 locus. (Upper panel) Cis-eQTLs for SNPs at c17orf69 locus using expression data from primary human osteoblasts. Allelic expression mapping for cis-regulatory variation inKANSL1(middle panel) and WNT3loci (lower panel) using a CEU population panel of lymphoblastoid cells. Coordinates (hg18) for loci are shown on top; blue tracks indicate the2log10(P value) of the association across all SNPs tested. The location of transcripts in these regions are shown.
(PDF)
Table S1 Affected and unaffectedBRCA1mutation carriers by
study country in the breast and ovarian cancer analysis used in SNP selection for the iCOGS array.
(DOCX)
Table S2 Origin ofBRCA1samples by Country and Stage used
in the current analysis. (DOCX)
Table S3 Sample and SNP quality control summary.
(DOCX)
Table S4 Associations with breast cancer risk for BRCA1
mutation carriers, for known breast cancer susceptibility variants. (DOCX)
Table S5 Associations withBRCA1breast or ovarian cancer risk
for SNPs genotyped at stages 1, 2, and 3. (DOCX)
Table S6 Analysis of breast cancer associations by BRCA1
mutation class. (DOCX)
Table S7 Associations with Breast Cancer ER status inBRCA1
carriers for SNPs genotyped in stages 1–3. (DOCX)
Table S8 Imputed SNPs at the novel 17q21 region with P-values
less than the most significant genotyped SNP (rs169201). (DOCX)
Table S9 SNPs associated (P,161025) with local expression
and Allelic Imbalance. (DOCX)
Text S1 Supplementary Methods.
(DOCX)
Acknowledgments
Antonis C. Antoniou is a Cancer Research–UK Senior Cancer Research Fellow. Douglas F. Easton is a Cancer Research UK Principal Research Fellow. Georgia Chenevix-Trench is an NHMRC Senior Principal Research Fellow.
iCOGS:CIMBA acknowledges the contributions of Kyriaki Michaili-dou, Jonathan Tyrer, and Ali Amin Al Olama to the iCOGS statistical analyses; Shahana Ahmed, Melanie J. Maranian, and Catherine S. Healey for their contributions to the iCOGS genotyping quality control process; and the staff of the genotyping unit in the Medical Genomics Facility at the Mayo Clinic under the supervision of Dr. Julie Cunningham.