This is a repository copy of
Accommodating underlying pro-environmental attitudes in a
rail travel context: application of a latent variable latent class specification
.
White Rose Research Online URL for this paper:
http://eprints.whiterose.ac.uk/91381/
Version: Accepted Version
Article:
Hess, S orcid.org/0000-0002-3650-2518, Shires, J and Jopson, A (2013) Accommodating
underlying pro-environmental attitudes in a rail travel context: application of a latent
variable latent class specification. Transportation Research Part D: Transport and
Environment, 25. pp. 42-48. ISSN 1361-9209
https://doi.org/10.1016/j.trd.2013.07.003
(c) 2013, Elsevier Ltd. This manuscript version is made available under the CC-BY-NC-ND
4.0 license http://creativecommons.org/licenses/by-nc-nd/4.0/
Reuse
Unless indicated otherwise, fulltext items are protected by copyright with all rights reserved. The copyright exception in section 29 of the Copyright, Designs and Patents Act 1988 allows the making of a single copy solely for the purpose of non-commercial research or private study within the limits of fair dealing. The publisher or other rights-holder may allow further reproduction and re-use of this version - refer to the White Rose Research Online record for this item. Where records identify the publisher as the copyright holder, users can verify any specific terms of use on the publisher’s website.
Takedown
If you consider content in White Rose Research Online to be in breach of UK law, please notify us by
Accommodating underlying pro-environmental
attitudes in a rail travel context: application of a latent
variable latent class specification
Stephane Hess∗ Jeremy Shires† Ann Jopson‡
Abstract
Using data from a stated preference survey conducted in the UK, we show how the relative importance that rail travellers attach to reductions in green-house gas emissions and faster journey times varies strongly as a function of underlying attitudes towards the environment. We specify a latent class structure that allocates respondents to two classes with substantially differ-ent valuations of greenhouse gas emissions, and show how the allocation of a given respondent to either class is a function of underlying attitudes that also drive the answers to a number of attitudinal questions. We also show how these underlying attitudes are a function of a number of socio-demographic characteristics, with female respondents, older respondents, and respondents with a university degree having a stronger pro-environmental attitude, with the opposite applying to respondents with regular car access.
Keywords: environmental attitudes; greenhouse gas emissions; rail transport; stated preference method
1
Introduction
Given increasing concerns about global warming, there is a growing interest in encouraging more sustainable travel behaviour. While ensuring a gradual shift towards more environmentally friendly modes of transport is a major policy topic, in particular through a shift away from air travel towards rail1, a further issue
∗Institute for Transport Studies, University of Leeds, [email protected] (corresponding
author)
†Institute for Transport Studies, University of Leeds, [email protected] ‡Institute for Transport Studies, University of Leeds, [email protected]
1
is whether the focus of new developments should be on reductions of travel time or ensuring a smaller environmental impact. This is especially relevant in the context of new high speed rail developments.
Policy and infrastructure decisions in this context require an understanding of the importance travellers assign to the environmental impact of their travel behaviour. Such measures go alongside more established indicators such as the monetary valuation of reductions in travel time. A number of studies have inves-tigated valuations of environmental impacts, drawing on diverse research areas, for example looking at the value of reducing greenhouse gas (GHG) emissions of water companies (Chalak et al., 2012), mitigating temperature changes and reducing overall GHG emissions (Ivanova and Rolfe,2010), carbon capture mech-anisms (Loschel et al.,2010;Diederich and Goeschl,2011), investments in green energy Wiser (2007) and offsetting of CO2 emissions by air travellers (Brouwer
et al., 2008). The majority of this work recognises the potential for significant variations across individual travellers in how they value environmental benefits, with the typical approach being to link them to socio-economic characteristics. Other work recognises that some variations are difficult to link to observed char-acteristics and makes use of a random treatment of inter-traveller heterogeneity (Carson et al.,2010).
Here, we put forward the notion that while some of the heterogeneity can indeed be linked to measured characteristics of respondents, underlying attitudes and convictions, specifically personal norms, may be the key driver of heterogene-ity. This is in line withPrillwitz and Barr(2011), who found that “attitudes to-wards the environment, sustainability and certain environmentally friendly trans-port modes have a significant impact on daily travel behaviour”. Using data from a stated preference survey conducted in the UK, we examine how such attitudes can be accommodated in a hybrid model that explains both the preferences for travel time and GHG reductions and the answers to attitudinal questions.
2
Data
Our analysis makes use of data collected in the UK in 20082. With only 40% of the UK rail network being electrified at present, there are active plans for increased electrification with a view to obtaining reductions in CO2 emissions.
2
At the same time, there are ongoing discussions about future highspeed rail de-velopments, where the initial construction process clearly has a major environ-mental impact. These contrasting directions are a motivation for understanding the relative importance that travellers place on reductions in travel time and in environmental impact of rail travel. We focus on rail travellers, whose rela-tive valuations could differ from those currently travelling on other modes. This was, however, unavoidable as our survey focussed on a current journey, and also allowed a higher degree of familiarity with the choice context.
It was recognised that the specific wording used in the survey could have a substantial impact on results, not least due to remaining uncertainty in the gen-eral population in relation to quantifying environmental impacts. With this in mind, four focus groups were held in UK cities in September 2008 with a view to guiding survey development. The groups explored people’s understanding about the environmental impacts of rail use and if and how environmental concerns fea-ture when choosing whether to travel by train. The data from the focus groups provided an understanding of people’s perceptions about rail and the environ-ment, and this was used to help design the questionnaire survey, in particular to word questions such that they were meaningful to respondents at the same time as collecting the data needed. It became clear that quantifying environ-mental impacts in terms of kilograms of CO2, as is generally done, was relatively
meaningless to most people. On the other hand, the focus groups showed that respondents could relate to the notion of greenhouse gas emissions’, even if they have a poor understanding of which emissions are included within that. Simi-larly, the groups highlighted that while respondents found it difficult to relate to a given figure in terms of tonnes of GHG emissions, they could easily understand the concept of a percentage reduction in such emissions.
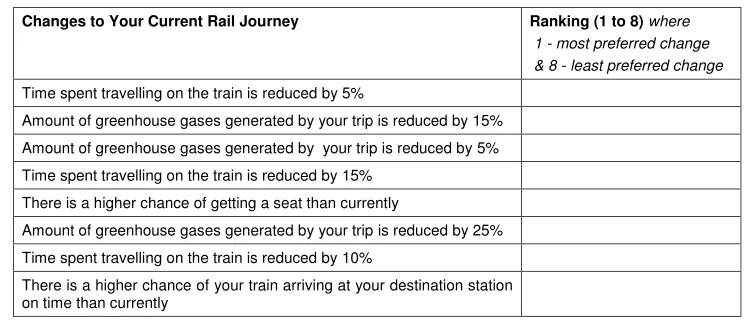
The survey made use of one specific type of stated preference elicitation method, namely a ranking experiment. Respondents were asked to rank differ-ent possible changes to their currdiffer-ent rail service in order of preference, focussing on reductions either in travel time for their current journey or in greenhouse gases, each time using percentage reductions. Journey time was preferred to fare because evidence from the focus groups suggested that it was considered a less contentious attribute, potentially avoiding strategic bias. Three levels of reductions in time were presented to each respondent, along with three levels of reductions in greenhouse gases. The respondents were instructed to rank the pos-sible outcomes under the assumption that all else stays equal, e.g. in a situation without increases in price.
anal-Changes to Your Current Rail Journey Ranking (1 to 8) where 1 - most preferred change & 8 - least preferred change Time spent travelling on the train is reduced by 5%
Amount of greenhouse gases generated by your trip is reduced by 15%
Amount of greenhouse gases generated by your trip is reduced by 5%
Time spent travelling on the train is reduced by 15%
There is a higher chance of getting a seat than currently
Amount of greenhouse gases generated by your trip is reduced by 25%
Time spent travelling on the train is reduced by 10%
[image:5.612.128.500.128.288.2]There is a higher chance of your train arriving at your destination station on time than currently
Figure 1: Ranking experiment
ysis3, and the levels associated with these two options were kept vague (“higher chance”) as they were of no relevance to the study - respondent interpretation and possible uncertainty related to the attributes does not affect the ranking between the other components. Figure1shows an example of the ranking exper-iment, where four different versions were used in the sample, with differences in the levels of reductions presented.
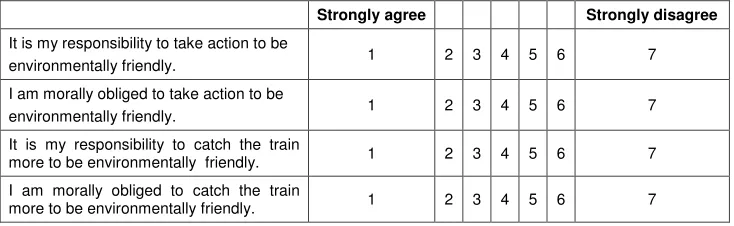
Alongside collecting information on a number of socio-economic character-istics, the survey also presented respondents with four attitudinal statements, specifically relating to personal norms regarding taking action to be environ-mentally friendly per se, and catching the train to be environmentally friendly. Evidence was found as far back as 1999 that personal norms were a determinant in pro-environmental behavior, including using means of transport other that the car (Harland et al., 1999). More recent research into environmental awareness and attitudes suggests that a moral norm to take action to help the environment is important in forming intentions to make travel behaviour changes which re-duce carbon emissions. The work byEriksson et al.(2008) andKing et al.(2008) corroborates that ofBamberg et al.(2007), who reported finding personal norms to be a significant determinant of intentions to use public transport. Similarly,
Abrahamse et al.(2009) reported that intentions to reduce car use were “mostly explained by ... personal norms”. These moral norms can be assessed through measurement of perceived responsibility (Eriksson et al.,2008) and moral obliga-tion (Harland et al.,1999;Abrahamse et al.,2009) to take action to be environ-mentally friendly, and perceived responsibility and moral obligation to travel by
3
Strongly agree Strongly disagree
It is my responsibility to take action to be
environmentally friendly. 1 2 3 4 5 6 7
I am morally obliged to take action to be
environmentally friendly. 1 2 3 4 5 6 7
It is my responsibility to catch the train
more to be environmentally friendly. 1 2 3 4 5 6 7
I am morally obliged to catch the train
[image:6.612.134.501.131.244.2]more to be environmentally friendly. 1 2 3 4 5 6 7
Figure 2: Attitudinal (personal norm) questions
rail for that purpose. Here, we use such indicators in a modelling study of trav-eller preferences using state-of-the-art techniques. The exact wording is shown in Figure2- we asked about obligations and responsibilities separately because the former are binding, whereas responsibilities need not be, and therefore accepting responsibility does not imply commitment to act, whereas feeling morally obliged to catch the train implies some level of commitment to do so when possible. The obligation questions received a lower level of agreement than the responsibility questions, highlighting the differences in interpretation.
Finally, respondents were also asked whether they had“ever made a decision to travel by train purely or mainly because [they] considered train to be the most environmentally friendly form of transport on offer”.
Questionnaires were distributed to rail travellers on six long-distance rail ser-vices covering a range of national circumstances and collected at the end of the trip. Surveys were carried out throughout the day to ensure a wide profile of pas-sengers. To include a sample of commuters who travel on services where crowding would prevent data collection, mail-back copies of the survey were distributed at four stations in London and at stations in Manchester and Birmingham. A sample of 1,336 respondents was obtained.
3
Model specification
LetTnjbe the level of time reduction for alternativejfor respondentn, where this will be zero for half the alternatives, and letGnj be the level of greenhouse gas reduction for alternative j for respondent n. We allow for deterministic as well as random heterogeneity in how respondents react to these reductions. In particular, we allow for two classes of respondents in a latent class framework, where the allocation of a given respondent to a given class is not observed, i.e. is dealt with probabilistically. We specify separate utility functions for personn and alternativej in the two classes:
Vnj,c1 =δGI(Gnj>0)+βG,c1Gnj+ (βT,c1 +δT,wInw) Tnj (1)
Vnj,c2 =δGI(Gnj>0)+βG,c2Gnj+ (βT,c2 +δT,wInw) Tnj. (2)
The marginal sensitivities to percentage reductions in time (βT,c1 and βT,c2) and
GHG (βG,c1 and βG,c2) are allowed to vary across classes, while the constant δG
for outcomes with reductions in GHG as well as the shift in travel time sensitivity for respondents on work tripsδT,w (whereInw is unity if respondentntravels for work) are kept constant across classes.
The probability of the observed ranking for person n is now given by a weighted average of two rank exploded logit probabilities (one per class), with:
Pn=
2
X
s=1
πn,cs
"T−1 Y
t=1
PJ
j=1I(Rnj=t)e µtVnj,cs
PJ
j=1I(Rnj≥t)e µtVnj,cs
#
, (3)
whereT = 6, i.e. the number of alternatives that are ranked,Rnj is the observed rank of alternative j (from 1 to 6) and where I(Rnj=t) is equal to 1 only if j
corresponds to the alternative with rank t. The inclusion of additional scale parametersµt(withµ1 normalised to 1) allows for the fact that the level of noise
(or randomness) is not uniform across the rankings.
The probability of a given respondentnfalling into either of the two classes is given byπn,cs. We link this probability to underlying pro-environmental attitudes
using:
πn,c1 =
eδ1+τ αn
eδ1+τ αn+ 1 (4)
πn,c2 =
1
eδ1+τ αn+ 1. (5)
In this specification,δ1 is used to capture the mean share of class 1 in the sample
n falling into class 1 as a resulting of that respondent’s underlying attitudes. These attitudes are given byαn, with the estimated sign ofτ determining whether increases inαn lead to increased probability for class 1 (τ being positive) or class 2 (τ being negative).
We recognise that attitudes are unobserved and that only manifestations or imperfect measurements of these attitudes can be captured. In a departure from standard techniques used in an environmental context, where answers to attitu-dinal questions are treated as error free measures, we treat them as indicators of latent attitudes, using them as dependent variables in a measurement equa-tions component within a hybrid model structure (Ben-Akiva et al.,2002). This accommodates measurement error as well as mitigating risks of endogeneity bias that would arise in a deterministic treatment.
We rely on just a single such variable, capturing underlying pro-environmental tendencies. Specifically, after an extensive specification search, we defined the latent attitude for respondentnas:
αn=γfemaleI(femalen=1)+γage>45I(agen>45)
+γuniv. degreeI(univ. degree
n=1)+γcar accessI(car accessn=1)
+ηn, (6)
where this makes use of deterministic interactions with four socio-economic indi-cators, namely gender (female respondent), age (over 45 years), education (uni-versity degree) and whether a respondent has regular car access. The additional termηnis a random disturbance which we assume follows a Normal distribution across respondents (g(η)), with a zero mean and a standard deviation of σα.
To provide further information about the attitudes of given respondents in the model and aid the estimation of the latent componentαnand its role in Equation 4 and Equation 5, we also use this latent variable to explain the answers to the four main attitudinal questions from Figure2,Q1toQ4, and the question relating
to the use of rail for environmental reasons,Q5. This part of the model is formed
from a number of measurement equations. We recognise the ordered nature of Q1toQ4by making use of an ordered logit structure, in line with recent work by
Daly et al.(2012). For the sake of consistency with Q5, we invert the values for
Q1 toQ4, such that 1 means strongly disagree and 7 means strongly agree. The new variables are labelled asQ∗1 toQ∗4, and the likelihood of the observed value Q∗nk is then:
LQ∗
nk = S
X
s=1
I(Q∗
nk=s)
eνk,s−ζkαn
1 +eνk,s−ζkαn −
eνk,s−1−ζkαn
1 +eνk,s−1−ζkαn
whereζkmeasures the impact of the latent variableαnon indicatorQk, and where νk,s, s= 0, . . . ,7 are a set of estimated threshold parameters. For normalisation, we setνk,7 to +∞, andνk,0 to−∞.
The treatment of Q5 is rather simpler. With a value of 1 equating to agree-ment with the stateagree-ment that the respondent has travelled by rail for environ-mental reasons, we model the likelihood of this indicator as a binary logit, with:
LQn5 =I(Qn5=0)
1
1 +eκ+ζ5αn +I(Qn5=1)
eκ+ζ5αn
1 +eκ+ζ5αn (8)
whereκ is a sample level constant for agreement, and ζ5 is the impact of αn on the probability of agreement.
Estimation involves maximising the joint likelihood of the observed sequence of choices and the observed answers to the attitudinal questions. Both model components are conditional on a given realisation of the latent variableαn, and as a result, the log-likelihood function of the model is given by integration over ηn:
LL(ΩV,Ωµ,Ωπ,Ωα,ΩQ) = N
X
n=1
ln
Z
ηn
Pn
4
Y
k=1
L∗Qnk !
LQn5g(ηn) dηn. (9)
where Pn is as shown in Equation 3, with class allocation probabilities from Equation 4 and Equation 5, L∗
Qnk with k = 1, . . . ,4 as in Equation 7 and LQn5
as in Equation8. The specific dependency of the individual model components in Equation9 on the various vectors of parameters is not shown explicitly but is clear from the earlier discussions4.
4
Results
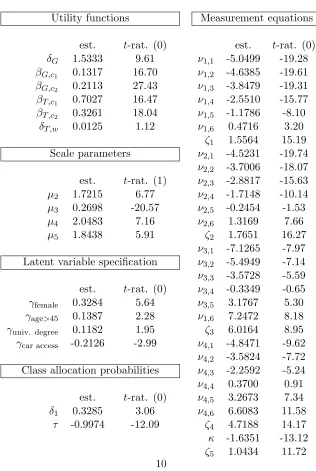
The results for the model are summarised in Table1, where the estimates are split into the different model components. Regarding the parameters for the utility functions, we see a positive constant for outcomes with reduced greenhouse gas emissions (δG) showing that, all else being equal, such alternatives are chosen more often than those offering a reduction in travel times. The shift parameter δT,w is positive, suggesting heightened desire for travel time reductions on work journeys, but the estimate is not significant at usual levels of confidence. The four
4
marginal utility coefficients, two per class, are all positive and highly significant, showing that reductions in greenhouse gas emissions or travel time have a positive impact on the utility of an alternative. The sensitivity to a 1% reduction in travel time is higher than the sensitivity to a 1% reduction in greenhouse gas emissions, where the differences are much larger in the first class (factor of 5.3) than in the second class (1.5).
The estimates for the scale parameters suggest lower error variance for the choice of the second ranked outcome compared to the highest rank - this is a reflection of the decision on which outcome to rank highest often being the difficult choice between the highest time saving and the highest GHG reduction. The scale for choosing the third ranked alternative is substantially lower, while the scale for later choices is again higher than that for the first rank.
The structural equations for the latent variable show a higher value for the latent attitude of female respondents, respondents aged over 45, and respondents with a university degree, while the latent variable is more negative or less positive for respondents who have regular car access. These estimates are in line with expectation when interpreting the latent variable as a pro-environmental attitude. This interpretation is further supported by the negative and highly significant estimate forτ in the class allocation model, which shows that a respondent with a more positive value for the latent attitude is less likely to belong to class 1, i.e. the class with a greater relative desire for time reductions, and consequently is more likely to belong to class 2, i.e. have a higher desire for greenhouse gas emissions than a respondent in class 1.
Looking at the measurement equations, the findings are consistent with those for the choice model component. Indeed, the positive estimates for ζ1 to ζ4
show us that a respondent with a more positive value for the latent attitude is more likely to agree5 with the four questions relating to perceived responsibility
and moral obligation to take action to be environmentally friendly, and perceived responsibility and moral obligation to travel by rail to be environmentally friendly. Similarly, a respondent with a more positive value for the latent attitude is more likely to indicate that he/she has travelled by rail for environmental reasons.
Turning to the implied relative sensitivities in Table2for the sample popula-tion of respondents, the distribupopula-tion of the relative sensitivity to a 1% reducpopula-tion in greenhouse gas emissions expressed in terms of a reduction in travel time. This is obtained by calculatingπn,c1
βG,c1 βT ,c1+δT ,wInw
+πn,c2
βG,c2 βT ,c2+δT ,wInw
for each respon-dent, where the random component αn used in the class allocation probabilities leads to a distributed ratio. These simulated distributions are then combined across respondents to obtain a sample level distribution. We see that a 1%
re-5
Table 1: Estimation results
Number of individuals: 1,336
Number of observations: 6,680
Log-likelihood (overall): -12,699.80 Log-likelihood (choice component): -4,692.34
Utility functions Measurement equations
est. t-rat. (0) est. t-rat. (0)
δG 1.5333 9.61 ν1,1 -5.0499 -19.28
βG,c1 0.1317 16.70 ν1,2 -4.6385 -19.61
βG,c2 0.2113 27.43 ν1,3 -3.8479 -19.31
βT,c1 0.7027 16.47 ν1,4 -2.5510 -15.77
βT,c2 0.3261 18.04 ν1,5 -1.1786 -8.10
δT,w 0.0125 1.12 ν1,6 0.4716 3.20
ζ1 1.5564 15.19
Scale parameters ν2,1 -4.5231 -19.74
ν2,2 -3.7006 -18.07
est. t-rat. (1) ν2,3 -2.8817 -15.63
µ2 1.7215 6.77 ν2,4 -1.7148 -10.14
µ3 0.2698 -20.57 ν2,5 -0.2454 -1.53
µ4 2.0483 7.16 ν2,6 1.3169 7.66
µ5 1.8438 5.91 ζ2 1.7651 16.27
ν3,1 -7.1265 -7.97
Latent variable specification ν3,2 -5.4949 -7.14
ν3,3 -3.5728 -5.59
est. t-rat. (0) ν3,4 -0.3349 -0.65
γfemale 0.3284 5.64 ν3,5 3.1767 5.30
γage>45 0.1387 2.28 ν1,6 7.2472 8.18
γuniv. degree 0.1182 1.95 ζ3 6.0164 8.95
γcar access -0.2126 -2.99 ν4,1 -4.8471 -9.62
ν4,2 -3.5824 -7.72
Class allocation probabilities ν4,3 -2.2592 -5.24
ν4,4 0.3700 0.91
est. t-rat. (0) ν4,5 3.2673 7.34
δ1 0.3285 3.06 ν4,6 6.6083 11.58
τ -0.9974 -12.09 ζ4 4.7188 14.17
κ -1.6351 -13.12
duction in CO2 is always valued less highly than a 1% reduction in travel time,
although significant variations arise across respondents, as indicated by the stan-dard deviation as well as minimum and maximum values for the ratio, which equate to the extreme values in the two classes.
Table 3 looks at separate socio-economic groups. That female respondents, and respondents with a university degree have a stronger pro-environmental at-titude is in line with expectation, while the a priori assumptions about an age effect are possibly less strong. Similarly, it is not surprising to see a negative ef-fect for respondents with regular car access. However, each of these parameters, while statistically significant, is small in magnitude when put into the context of a random component η in the latent variable specification that is normally distributed with a mean of zero and a standard deviation of one. Indeed, this means that actual variation in attitudes across respondents is to a large extent not related to measured socio-economic characteristics. In terms of explaining the heterogeneity in the actual choice model, we see a high level of heterogeneity being captured by the latent class specification (noting the differences in coeffi-cients between classes) where the allocation to these classes is to a substantial extent driven by the latent attitude (noting the highly significant estimate forτ). On the other hand, the deterministic shift parameter δT,w plays almost no role. This is reflected in Table 3 which shows the aforementioned levels of variation in the relative sensitivities in each of the socio-economic groups, but with only minor differences between groups.
Thus far, we have solely talked about valuations in terms of percentage changes. However, these valuations can also be monetised, albeit with the need for a number of assumptions. With the average UK rail journey length being 40.3km, and the average journey time:length ratio being 1.9km/min, we obtain an average journey time of 21.2mins. With an average CO2 emission figure of 61g/km, this
journey would thus on average produce 0.0024583 tonnes of CO2, meaning that a
1% saving in CO2 would equate to 0.000024583 tonnes. The relative sensitivities
obtained above can now be used to calculate the implied monetised value of a 1% reduction in CO2 by using the average UK value of travel time savings of£8.29
Table 2: Distribution of relative sensitivities and implied valuations
mean std.dev. min max value of 1% reduction in CO2 expressed in %
reduction in travel time 0.39% 0.09% 0.19% 0.65% implied willingness for 1% reduction in CO2
for average length UK rail journey (pence) 1.14p 0.28p 0.56p 1.88p implied willingness to pay for making average
[image:13.612.127.506.302.515.2]UK rail journey carbon neutral £1.14 £0.28 £0.56 £1.88
Table 3: Estimates of relative valuation of greenhouse gas reductions and travel time reductions across socio-economic groups
mean std.dev.
gender age education car access non-work work non-work work male <45 no degree not regular 0.39% 0.37% 0.09% 0.09% male <45 no degree regular 0.37% 0.35% 0.09% 0.09% male <45 univ. degree not regular 0.4% 0.38% 0.1% 0.09% male <45 univ. degree regular 0.38% 0.36% 0.09% 0.09% male ≥45 no degree not regular 0.4% 0.39% 0.1% 0.09% male ≥45 no degree regular 0.38% 0.37% 0.09% 0.09% male ≥45 univ. degree not regular 0.41% 0.4% 0.1% 0.09% male ≥45 univ. degree regular 0.39% 0.38% 0.1% 0.09% female <45 no degree not regular 0.42% 0.4% 0.1% 0.09% female <45 no degree regular 0.4% 0.38% 0.1% 0.09% female <45 univ. degree not regular 0.43% 0.41% 0.1% 0.09% female <45 univ. degree regular 0.41% 0.39% 0.1% 0.09% female ≥45 no degree not regular 0.43% 0.42% 0.1% 0.09% female ≥45 no degree regular 0.41% 0.4% 0.1% 0.09% female ≥45 univ. degree not regular 0.44% 0.43% 0.1% 0.09% female ≥45 univ. degree regular 0.42% 0.41% 0.1% 0.09%
5
Conclusions
This paper has looked at travellers’ relative sensitivities to travel time and green-house gas emissions, using trade-offs captured using a stated preference survey carried out in the UK.
where the probability of allocating a respondent to a given class is a function of this respondent’s attitude towards the environment, which itself is treated as latent and is informed by a measurement model component which explains respondents’ answers to a number of attitudinal questions.
The results show that, in a model with two classes, we obtain two substantially different relative valuations to time and greenhouse gas emissions. There is also a small deterministic effect, with higher time sensitivity on work trips, but the random variation plays a bigger impact. The latent variable construct has a major role in explaining the allocation to the two classes, as well as the answers to the attitudinal questions. Female respondents, older respondents, and respondents with a university degree, have a more positive attitude towards the environment, with the opposite applying to respondents with regular car access. Respondents with a more positive latent attitude are more likely to fall into the class with higher sensitivity to greenhouse gas emissions, while they are also likely to express more environmentally friendly views in their answers to attitudinal questions and questions about rail use.
Acknowledgments
This paper is based on a study commissioned by the Association of Train Oper-ating Companies (ATOC). The opinions expressed in this paper are those of the authors and do not necessarily reflect the thinking or strategy of ATOC.
References
Abrahamse, W., Steg, L., Gifford, R., Vlek, C., 2009. Factors influencing car use for commuting and the intention to reduce it: A question of self-interest or morality? Transportation Research F 12, 317–324.
Bamberg, S., Hunecke, M., Blobaum, A., 2007. Social context, personal norms and the use of public transportation: Two field studies. Journal of Environmental Psychology 27, 190–203.
Ben-Akiva, M. D., McFadden, D., Train, K., Walker, J., Bhat, C., Bierlaire, M., Bolduc, D., Boersch-Supan, A., Brownstone, D., Bunch, D. S., Daly, A., de Palma, A., Gopinath, D., Karlstrom, A., Munizaga, M. A., 2002. Hybrid Choice Models: Progress and Challenges. Marketing Letters 13, 163–175.
Brouwer, R., Brander, L., Van Beukering, P., 2008. ”a convenient truth”: air travel passengers willingness to pay to offset their co2 emissions. Climatic Change 90, 299– 313, 10.1007/s10584-008-9414-0.
Carson, R., Louviere, J., Wei, E., 2010. Alternative australian climate change plans: the publics views. Energy Policy 38, 902–911.
Chalak, A., Hecht, J., Reid, S., Abiad, M., 2012. Willingness-to-pay for greenhouse gas reduction: A bayesian investigation of distributional patterns. Environmental Science and Policy 19, 147–157.
Daly, A. J., Hess, S., Patruni, B., Potoglou, D., Rohr, C., 2012. Using ordered attitudinal indicators in a latent variable choice model: A study of the impact of security on rail travel behaviour. Transportation 39, 267–297.
Department for Transport, 2009. Values of time and operating costs, tag unit 3.5.6. http://www.dft.gov.uk/webtag/documents/expert/unit3.5.6.php.
Diederich, J., Goeschl, T., 2011. Willingness to pay for individual greenhouse gas emis-sions reductions: evidence from a large field experiment. Working Papers 0517, Uni-versity of Heidelberg, Department of Economics.
Doornik, J. A., 2001. Ox: An Object-Oriented Matrix Language. Timberlake Consultants Press, London.
Eriksson, L., Garvill, J., Nordlund, A., 2008. Acceptability of single and combined trans-port policy measures: The imtrans-portance of environmental and policy specific beliefs. Transportation Research A 42, 1117–1128.
Harland, P., Staats, H., Henk, A., 1999. Explaining proenvironmental intention and behavior by personal norms and the theory of planned behavio. Journal of Applied Social Psychology 29 (12), 2505–2528.
Ivanova, G., Rolfe, J., 2010. Using Choice Modelling to assess the willingness to pay of Queensland ouseholds to reduce greenhouse emissions. Paper presented at the 54th annual Australian Agricultural and Resource Economics Society Conference, Adelaide.
King, S., Marsden, G., Dyball, M., Jopson, A., Harwatt, H., Kimble, M., 2008. Exploring public attitudes to climate change and the barriers and motivators to behaviour change: Final Report. Report to Department for Transport, www.dft.org.uk.
Loschel, A., Sturm, B., Vogt, C., 2010. The demand for climate protection an empirical assessment for Germany. Discussion Paper No. 10-068, Centre for European Economic Research.
Prillwitz, J., Barr, S., 2011. Moving towards sustainability? mobility styles, attitudes and individual travel behaviour. Journal of Transport Geography 19, 1,590–1,600.