City, University of London Institutional Repository
Citation:
Ulman, V., Maska, M., Magnusson, K. E. G., Ronneberger, O., Haubold, C., Harder, N., Matula, P., Matula, P., Svoboda, D., Radojevic, M., Smal, I., Rohr, K., Jalden, J., Blau, H. M., Dzyubachyk, O., Lelieveldt, B., Xiao, P., Li, Y., Cho, S-Y., Dufour, A C., Olivo-Marin, J-C., Reyes-Aldasoro, C. C., Solis-Lemus, J. A., Bensch, R., Brox, T., Stegmaier, J., Mikut, R., Wolf, S., Hamprecht, F. A., Esteves, T., Quelhas, P., Demirel, O., Malmstrom, L., Jug, F., Tomancak, P., Meijering, E., Munoz-Barrutia, A., Kozubek, M. andOrtiz-de-Solorzano, C. (2017). An objective comparison of cell-tracking algorithms. Nature Methods, 14(12), pp. 1141-1152. doi: 10.1038/nmeth.4473
This is the accepted version of the paper.
This version of the publication may differ from the final published
version.
Permanent repository link:
http://openaccess.city.ac.uk/18857/Link to published version:
http://dx.doi.org/10.1038/nmeth.4473Copyright and reuse: City Research Online aims to make research
outputs of City, University of London available to a wider audience.
Copyright and Moral Rights remain with the author(s) and/or copyright
holders. URLs from City Research Online may be freely distributed and
linked to.
City Research Online: http://openaccess.city.ac.uk/ publications@city.ac.uk
An Objective Comparison of Cell Tracking Algorithms
Vladimír Ulman1¶**, Martin Maška1**
, Klas E. G. Magnusson2, Olaf Ronneberger3, Carsten Haubold4, Nathalie Harder5¶¶, Pavel Matula1, Petr Matula1, David Svoboda1, Miroslav Radojevic6, Ihor Smal6, Karl Rohr5, Joakim Jaldén2, Helen M. Blau7, Oleh Dzyubachyk8, Boudewijn Lelieveldt8,9, Pengdong Xiao10¶¶¶, Yuexiang Li11¶¶¶¶, Siu-Yeung Cho12, Alexandre Dufour13, Jean Christophe Olivo-Marin13, Constantino C. Reyes-Aldasoro14, Jose A. Solis-Lemus14, Robert Bensch3, Thomas Brox3, Johannes Stegmaier15, Ralf Mikut15, Steffen Wolf4, Fred. A. Hamprecht4, Tiago Esteves16,17, Pedro Quelhas16,, Ömer Demirel18, Lars Malmström18, Florian Jug19, Pavel Tomančák19
, Erik Meijering6, Arrate Muñoz-Barrutia20,21, Michal Kozubek1, Carlos Ortiz-de-Solorzano22*
1
Centre for Biomedical Image Analysis, Masaryk University, Brno, Czech Republic
2
ACCESS Linnaeus Centre, KTH Royal Institute of Technology, Stockholm, Sweden
3
Computer Science Department and BIOSS Centre for Biological Signalling Studies University of Freiburg, Germany
4
Heidelberg Collaboratory for Image Processing, IWR, University of Heidelberg, Germany
5
Biomedical Computer Vision Group, Dept. Bioinformatics and Functional Genomics, BIOQUANT, IPMB, University of Heidelberg and DKFZ, Heidelberg, Germany
6
Biomedical Imaging Group Rotterdam, Departments of Medical Informatics and Radiology, Erasmus University Medical Center Rotterdam, Rotterdam, the Netherlands
7
Baxter Laboratory for Stem Cell Biology, Department of Microbiology and Immunology, and Institute for Stem Cell Biology and Regenerative Medicine, Stanford University School of Medicine, Stanford, CA, USA
8
Division of Image Processing, Department of Radiology, Leiden University Medical Center, Leiden, the Netherlands
9
Intelligent Systems Department, Delft University of Technology, Delft, the Netherlands
10
Institute of Molecular and Cell Biology, A*Star, Singapore
11
Department of Engineering, University of Nottingham, United Kingdom
12
Faculty of Engineering, University of Nottingham, Ningbo, China
13
BioImage Analysis Unit, Institute Pasteur, Paris, France
14
Research Centre in Biomedical Engineering, School of Mathematics, Computer Science and Engineering, City University of London, United Kingdom
15
Group for Automated Image and Data Analysis, Institute for Applied Computer Science, Karlsruhe Institute of Technology, Eggenstein-Leopoldshafen, Germany
16
i3S - Instituto de Investigação e Inovação em Saúde, Universidade do Porto, Porto, Portugal
17
Facultade de Engenharia, Universidade do Porto, Porto, Portugal
18
S3IT, University of Zurich, Switzerland
19
Max Planck Institute of Molecular Cell Biology and Genetics, Dresden, Germany
20
Bioengineering and Aerospace Engineering Department, Universidad Carlos III de Madrid, Spain
21
Instituto de Investigación Sanitaria Gregorio Marañon, Madrid, Spain
22
CIBERONC, and Program of Solid Tumors and Biomarkers, Center for Applied Medical Research, University of Navarra, Pamplona, Spain
Current affiliation: Max Planck Institute of Molecular Cell Biology and Genetics, Dresden, Germany
¶¶
Current affiliation: Definiens AG, Munich, Germany
¶¶¶
Current affiliation: National Heart Research Institute Singapore (NHRIS), National Heart Centre Singapore (NHCS), Singapore
¶¶¶¶
Current affiliation: Computer Vision Institute, College of Computer Science and Software Engineering, Shenzhen University, Shenzhen, China
**
These authors contributed equally to this work
*
Corresponding author
Abstract
We present a combined report on the results of three editions of the Cell Tracking Challenge, an ongoing initiative aimed at promoting the development and objective evaluation of cell tracking algorithms in multidimensional time-lapse microscopy. With seventeen participants providing results of twenty-one algorithms on a data repository consisting of thirteen datasets of various microscopy modalities and experimental conditions, this challenge displays a good sample of today’s state of the art in the field. We first determine the quality of all datasets and assess the complexity of the associated segmentation and tracking tasks. Next, we analyze the results received during the three editions of the challenge. To this end, we use performance measures for segmentation and tracking that rank all participating methods. For each dataset we highlight the particular issues that remain to be addressed by future algorithmic advances. Finally, we analyze the performance of all algorithms in terms of biological measures and their practical usability. This allows us to directly address the biologist/user point of view. Even though some methods score high in all technical aspects, not a single one obtains fully correct solutions. This is especially true when considering measures that are of biological relevance, such as the correct detection of entire tracks or cell lineages. We also show that methods that either take prior information into account using learning strategies or analyze cells in a larger spatio-temporal image or video context perform better than other methods under the segmentation and tracking scenarios included in this challenge.
Introduction
Cell migration and proliferation are two important processes in normal tissue development and disease1. To visualize these processes, optical microscopy remains the most appropriate imaging modality2. Some imaging techniques, such as phase contrast (PhC) or differential interference contrast (DIC) microscopy, make cells visible without the need of exogenous markers. Fluorescence microscopy on the other hand requires internalized, transgenic, or transfected fluorescent reporters to specifically label cell components such as nuclei, cytoplasm, or membranes. These are then made visible in 2D by wide-field fluorescence microscopy or in 3D by using the optical sectioning capabilities of confocal, multiphoton, or light sheet microscopes.
In order to gain biological insights from such time-lapse recordings of cell behavior, it is often necessary to identify individual cells and follow them over time. The bioimage processing community has, since its inception, worked on extracting quantitative information from microscopy images of cultured cells3,4. Recently, the advent of new imaging technologies has challenged the field with multi-dimensional, large image datasets following the development of tissues, organs, or entire organisms. Yet the tasks remain the same, accurately delineating (i.e. segmenting) cell boundaries and tracking cells movements over time, providing information about their velocities and trajectories, and detecting cell lineage changes due to cell division or cell death (see Fig. 1 for a graphical description of these concepts). The level of difficulty of automatically segmenting and tracking cells depends on the quality of the recorded video sequences. In most practical scenarios, this quality is the result of a number of occasionally mutually contradicting biologicala and technicalb factors. The main properties that determine the quality of time-lapse videos with respect to the subsequent segmentation and tracking analysis are discussed in the following paragraphs, graphically illustrated in Fig. 2, and expressed as a set of quantitative measures in the Online Methods (section Dataset quality parameters).
The main factors that influence the outcome of image segmentation are the signal to noise and contrast ratios (SNR and CR), measuring the relationship between the signal captured from the cells and the unwanted noise or signal captured at the same time (Fig. 2a-f). Additionally,
intra-cellular heterogeneity can lead to cell over-segmentation when the same cell yields several detections (Fig. 2g-h) while heterogeneity between cells has the opposite effect resulting in undetected cells (Fig. 2i). Insufficient spatial resolution compromises the accurate detection of cell boundaries (Fig. 2j-l). Besides the factors that relate to the imaging process, biological features such as irregularity of cell shapes (Fig. 2m,n) or high density of cells
(Fig. 2o) can cause over/under-segmentation, especially when the segmentation methods
a
e.g. type and efficiency of the labeling process, cell type, cell movement speed, cell viability, phototoxicity, etc.
b
assume simpler, non-touching objects. Moreover, the imaging and biological effects often conspire. High noise levels, for instance, can lead to discontinuities in segmentation of thin, elongated filopodium-like structures (Fig. 2n). In the time domain, changes in the average intensity of cells complicate their segmentation by bringing SNR or CR to levels below detection, causing signal heterogeneity between frames, and affecting both segmentation and tracking (Fig. 2p-r).
While the above-mentioned properties of microscopic recordings influence primarily the segmentation of cells, other properties impact specifically the tracking problem. For instance,
the temporal resolution combined with the speed of cell movement determines the amount of
overlap between the cells in consecutive frames (Fig. 2s-u). Since many algorithms rely on this overlap, tracking is compromised when overlap decreases or even vanishes completely. Similarly, cell divisions pose challenges on tracking (Fig. 2v-x), since tracking a mitotic cell requires correctly assigning the mother to its daughter cells in consecutive frames. This is particularly difficult when the cell density is high and/or when the mitotic events are synchronized (Fig. 2x). Finally, cells may die during the recording or enter/leave the field of view, which further complicates their tracking.
The image processing community has addressed the above-mentioned issues by increasingly sophisticated segmentation and tracking algorithms5-7. Below we briefly summarize the most commonly used methods for segmentation and tracking, respectively (Fig. 3).
For segmentation, creating a ‘taxonomy of methods’ is not straightforward since the state-of-the-art methods usually combine different strategies to achieve improved results. We classify existing cell segmentation algorithms based on three criteria: (i) The principle upon which cells are detected, e.g. by finding uniform areas, boundaries, or at very low resolution by simply finding bright spots/maxima8. (ii) The image features that are computed to achieve the cell segmentation. These can be simple pixel/voxel or average region intensities, or more complex local image descriptors of shapes or textures. (iii) Finally, we distinguish the segmentation method itself that implements the principle using the features. The methods range from simple thresholding9,10, hysteresis thresholding11, edge detection12, or shape matching13,14, to more sophisticated region growing15-17, machine learning18,19, or energy minimization20-26 approaches.
Cell tracking methods can be broadly categorized into two groups: (i) Tracking by contour evolution methods21,22,24,25 start by segmenting the cells in the first frame of a video and evolve their contours in consecutive frames, thus solving the segmentation and tracking tasks simultaneously, one step at a time, under the essential assumption of unambiguous, spatio-temporal overlap between the corresponding cell regions. (ii) Tracking by detection methods14,
19,26-29, in contrast, start by first segmenting the cells in all frames of a video and later, using
mostly probabilistic frameworks, try to establish temporal associations between the segmented cells. This can be done by either using a two-frame or multi-frame sliding window, or even for all frames at once.
The diversity of imaging modalities, cell tracking tasks, and available algorithms make it difficult for biologists to decide which algorithm to use under certain conditions. Moreover, the developers of image processing algorithms need to objectively evaluate new cell segmentation and tracking solutions by comparing their performance on standardized datasets. We addressed these problems by organizing three Cell Tracking Challenges (CTC I-III), under the auspices of the IEEE International Symposium on Biomedical Imaging (ISBI) between 2013 and 2015. For these challenges, we created a diverse repository of widefield and confocal fluorescence microscopy videos, created a set of reference annotations, and defined quantitative evaluation measures to allow a fair comparison of the competing algorithms30.
Results
Datasets and ground truth
The dataset repository consists of 52 annotated videos from 13 classes, in total representing 92 GB of raw image data. Eleven datasets are contrast enhancing (PhC, DIC) or fluorescence (widefield, confocal, light sheet) microscopy recordings of live cells and organisms in 2D and 3D. The other two datasets are synthetic, generated using a cell simulator that produces realistic 2D and 3D renderings of chromatin-stained live cells31. Each dataset consists of two training and two competition videos. The training videos were provided at the time of registration for the CTC. The competition videos were provided at a later time, but at least two months before the submission deadline, to allow the participants to optimize their algorithms on them before submitting their results. The training videos are provided with the corresponding reference annotations, while the annotations for the competition videos are kept secret.
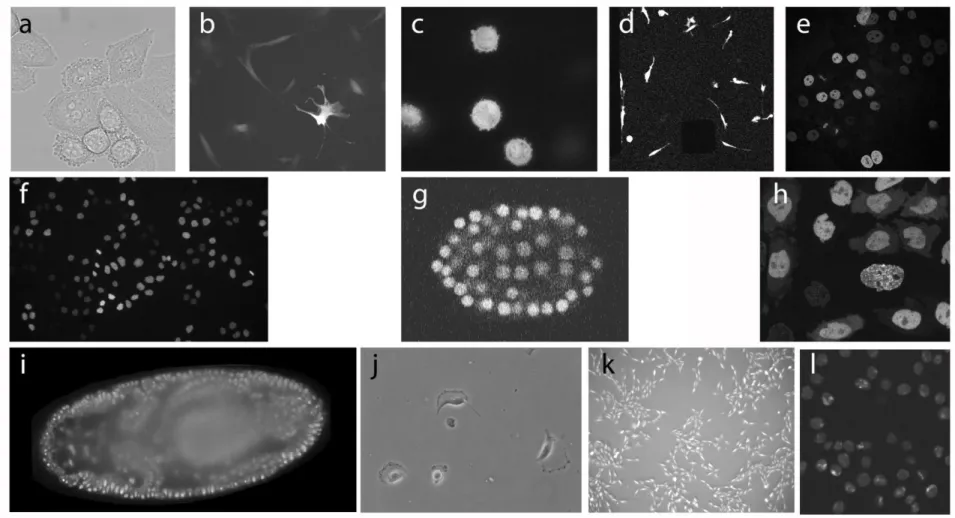
Fig. 4 shows a representative 2D frame from all datasets used in the three CTC editions, and
Supplementary Videos 1 to 13 contain renderings of fragments of one video per dataset.
Supplementary Material: Table 1 lists experimental and technical details of the datasets, and
the Online Methods (section Description of datasets) contains a more detailed description of
the datasets, including their possible biological uses. The Online Methods (section Simulation
system used and its parameters) briefly describes the simulator used to create the synthetic
datasets and provides the parameters used in the simulations. Finally, and more importantly,
Table 1 provides a quantitative characterization of the quality of each dataset, based on the set of measures described in the Online Methods (section Dataset quality parameters). In all tables, figures, and videos we use a naming convention for datasets that identifies their microscopy modality (Fluorescence, DIC, PhC), the staining (Nuclear, Cellular), the dimensionality (2D, 3D), the resolution (Low, High), and the cell type or model organism used.
Participants, algorithms, and handling of submissions.
Seventeen teams from 11 countries participated in the three CTC editions, all providing complete tracking results for at least one of the datasets. Two teams submitted more than one algorithm, leading to a total of 21 competing algorithms. Tables 2 and 3 list the algorithms and classify their segmentation (Table 2) and tracking (Table 3) strategies. Supplementary Material: Table 2 lists affiliations of the participating teamsc and Supplementary Material: Table 3 contains links to executable versions of the submitted algorithms. An expanded description of the algorithms is also presented in the Supplementary Material: Cell Tracking
Algorithms and the parameter configurations used by each algorithm are listed in the
Supplementary Data 1. In all tables, the algorithms are named starting with an acronym that identifies the institution that hosts the participating group (e.g., KTH, COM, etc.), followed by an acronym that identifies the country where the institution is located (e.g., SE, USA, etc). When two or more participants belong to the same institution, an intermediate acronym identifies the person responsible for the submission. Finally, if the same participant submits more than one algorithm, the name is followed by a bracketed numeral that identifies the algorithm.
All submissions were received by the CTC organizers as labeled segmentation masks and structured text files containing the cell lineage graphsd. The organizers evaluated the data using the set of technical measures described below to generate a provisional ranking. This ranking was later confirmed by reproducing the results on a single computer, using the executable version of each algorithm provided by the participants.
Quantitative performance criteria.
In order to quantify the performance of all submitted algorithms, we developed three categories of measures that are meant to quantify the (i) segmentation and tracking accuracy from the computer science point of view, (ii) biological relevance of the obtained tracking results, and (iii) practical usability of the methods. A rigorous description of all measures can be found in the
Online Methods (section Performance criteria). Please note that only the first set of measures
was evaluated in the challenge and, therefore, the methods were only fine-tuned in this respect. The other two sets are used to analyze aspects that are of relevance from the user point of view.
The first set measures the segmentation and tracking accuracy of the methods from the developer’s point of view. The segmentation accuracy measure(SEG) evaluates the average amount of overlap between the reference segmentation ground truth (SEG-GT) and the segmentation masks computed by an evaluated algorithm. SEG always takes values in the interval [0,1], with 1 meaning total overlap (congruency) and 0 meaning that not even one foreground pixel or voxel was common to both. The tracking accuracy measure (TRA) evaluates the accuracy of the tracking results of each computed solution. It is a weighted
c
See also http://www.codesolorzano.com/Challenges/CTC/Challenge_Participants.html for an updated list of Challenge participants
d
File formats and conventions can be found on the CTC website
distance between the tracking solution submitted by the participant and the reference tracking ground truth (TRA-GT), with weights chosen to reflect the effort it takes a human curator to carry out the edits manually. TRA is normalized in order to take values between 0 and 1, where higher values stand again for fewer errors with respect to the reference solution.For ranking the algorithms, the overall performance (OP) is computed by averaging SEG and TRA values for each pair of competition movies, and then averaging these averages, i.e. OP = (SEGavg +
TRAavg)/2. In summary, SEG and TRA evaluate results in terms of similarity to the ground truth and are particularly relevant for comparing algorithms with one another. Method developers use such measures to show the superiority of new methods over the state-of-the-art.
Supplementary Material: Table 3 contains a link to the evaluation software used in the challenge.
Biologists however, when using tracking algorithms, have specific biological questions and are therefore usually more interested in specific aspects of the final segmentation and tracking analysis. For this reason, we evaluated four additional aspects of biological relevance. The
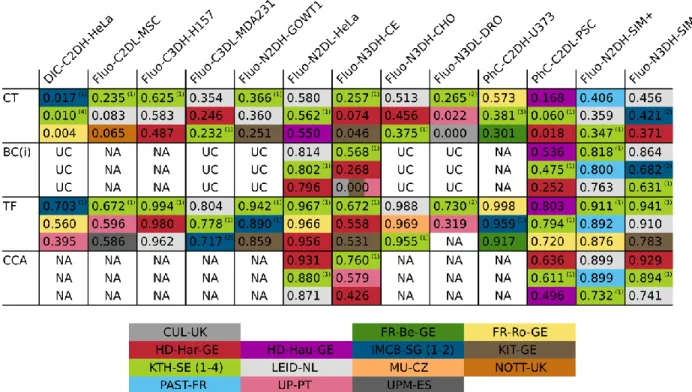
Complete Tracks(CT) focuses on the fraction of ground truth cell tracks that a given method is
capable to reconstruct in their entirety. The higher CT is, the larger is the fraction of cells that is correctly tracked throughout the entire movie, from the frame they appear in, to the frame they disappear from. CT is especially relevant when a perfect reconstruction of the cell lineages is required. The Track Fractions (TF) selects for each reference track its longest matching algorithm-generated tracklet (continuous cell tracking subsequence), computes the percentage of overlap of these subsequences with respect to the full tracks, and takes the average of these values. Intuitively, this can be interpreted as the fraction of an average cell’s trajectory that an algorithm reconstructs correctly, and therefore gives an indication of the algorithm’s ability to measure cell speeds or trajectories. In cases where the reliable detection of dividing cells is critical, Branching Correctness(BC) measures how efficient a method is at correctly detecting division events. Finally, the Cell Cycle Accuracy (CCA) measures how accurate an algorithm is at correctly reconstructing the length of the life of a cell, i.e., the time between two consecutive divisions. Both BC and CCA are informative about the ability of the algorithm to detect cell population growth. All biologically inspired measures take values in the interval [0,1], with higher values corresponding to better performance.
algorithm. The last, value we report for each algorithm is its execution time (TIM), measured in seconds.
Analysis of the performance of submitted algorithms.
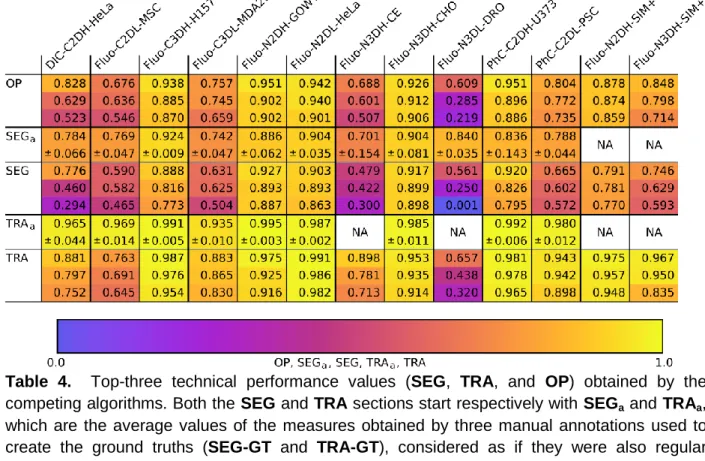
All measures we described above have been computed for every dataset and competing algorithm. We first evaluated the segmentation (SEG) and tracking (TRA) accuracy measures. Top-three values for each dataset are listed in Table 4, and the algorithms that obtained those scores are listed in Table 5 (see Supplementary Data 2 for the complete list of values). In order to help determining the significance of these values, we calculated SEG and TRA values with respect to the ground truth data not only for each algorithm’s result, but also for the three manual annotations, as if they were submitted results, since they are the best available proxies for evaluating the variability among human annotators. Therefore, algorithms with SEG or TRA
scores within the range of the average manual scores (SEGa and TRAa) plus/minus one standard deviation can be considered to perform at the level of human annotators, and algorithms with scores above or below that range can be said to perform better or worse, respectively, than the human annotators.
We first examine the results from the viewpoint of the datasets (Table 4), trying to pinpoint the features that underlie the good and not so good performance of the competing methods. We observe that some algorithms reached very good values (OP > 0.9) for specific datasets, such as N2DH-GOWT1, PhC-C2DH-U373, N2DL-HeLa, C3DH-H157, and Fluo-N3DH-CHO. In all but one of these datasets (Fluo-C3DH-H157), one or more algorithms reached human quality results, i.e. values close to or above the average annotator values SEGa and TRAa. Interestingly, all but one of these results are obtained on fluorescence data with high SNR or CR values. Some also show high spatial (Fluo-C3DH-H157, Fluo-N3DH-CHO) and/or temporal (Fluo-N2DH-GOWT1, Fluo-N2DL-HeLa, Fluo-N3DH-CHO) resolution and display rather low cell densities (Fluo-C3DH-H157, Fluo-N2DH-GOWT1, PhC-C2DH-U373, Fluo-N3DH-CHO).
A second group of datasets was solvable with OP values between 0.75 and 0.9 (DIC-C2DH-HeLa, PhC-C2DL-PSC, Fluo-C3DL-MDA231, Fluo-N2DH-SIM+, and Fluo-N3DH-SIM+). For these datasets, the SEG and TRA values are near but below the performance of the manual annotators, meaning that after automatic tracking some additional curation work is required to reach the level of the human annotators. The difficulty for DIC-C2DH-HeLa and PhC-C2DL-PSC appears to be the low SNR and CR values and high cell density, and for DIC-C2DH-HeLa also the rather complex image texture within cells (see Supplementary Material: Figs. 1 and 11). For Fluo-C3DL-MDA231, the low SNR and CR values are paired with low spatial and temporal resolution and significant photobleaching (see Supplementary Material: Fig. 4). The two synthetic datasets (Fluo-N2DH-SIM+, Fluo-N3DH-SIM+) show average SNR, low CR, average cell density, and average to high heterogeneity within and between cells.
human-level annotations. Fluo-C2DL-MSC suffers mostly from low SNR and CR values, low temporal resolution, and significant photobleaching. This dataset is difficult to segment correctly also due to its prominent cell protrusions (see Supplementary Material: Fig. 2). For Fluo-N3DH-CE and Fluo-N3DL-DRO, the two whole embryo datasets, the algorithms mostly struggle to segment and track the very noisy cell nuclei in 3D. Additionally, these datasets show very low spatial resolution, relatively low temporal resolution, and increasingly dense cells toward the end of the movies which strongly complicate tracking of the segmented cells (see Supplementary Material: Figs. 7 and 9).
Next, we examine the results from the viewpoint of the algorithms, asking which ones show best overall performance. Among the algorithms that obtained the best values (Table 5), KTH-SE, FR-Ro-GE, and HD-Hau-GE ranked first for one or more datasets. Looking more globally at the number of top-3 occurrences in Table 5, the methods KTH-SE, FR-Ro-GE and HD-Har-GE outperform the others. Their common denominator is the reliance on the tracking by detection paradigm. In particular, KTH-SE algorithms perform extraordinarily well, being ranked among the top-three for all datasets. These methods rely on a simple thresholding segmentation highly enriched by the use of global information in the tracking process. In some datasets, however, the overall lower performing tracking by contour evolution methods (LEID-NL, MU-CZ, and PAST-FR) reach the level of the leading tracking by detection methods. This can be attributed to their high segmentation performance on datasets with high temporal and spatial resolution (Fluo-N3DH-CHO, Fluo-N2DH-GOWT1, Fluo-N2DH-SIM+, and Fluo-N3DH-SIM+). These results highlight how this class of methods relies on significant cell-to-cell overlaps between successive frames to work properly. Finally, it is interesting to note the exceptional performance of the machine learning methods (FR-Ro-GE, HD-Hau-GE) on contrast enhancement microscopy (PhC and DIC) datasets. Indeed, these methods obtain performance values on DIC-C2DH-HeLa, PhC-C2DH-U373, and PhC-C2DL-PSC that do not match their predicted level of complexity. This can be explained by the fact that the internal texture of the cells in these datasets is not detrimental for the segmentation. On the contrary, it seems to be helpful by improving the learning capacity of the algorithms. Finally for this part of the analysis, as shown in Supplementary Material: Fig. 12, the evolution of the average of the top-3 OP values during the three CTC editions shows clear progress towards the objective of reaching the level of the human expert annotators.
We have also studied the robustness of the OP–based rankings, obtained as described in the
Online Methods (section Ranking robustness) and summarized in Supplementary Material:
Fig. 13, which shows that the rankings are indeed robust for up to 45% of possible weight changes. Furthermore we have analyzed the correlation, i.e. interdependence of SEG and TRA
scores using the Kendall’s correlation coefficient (Supplementary Material: Table 4) to show moderate global correlation (0.55) with only a few cases of very high (DIC-C2DH-HeLa,
Fluo-N3DH-CE) or high (PhC-C2DL-PSC, Fluo-C2DL-MSC) correlation.
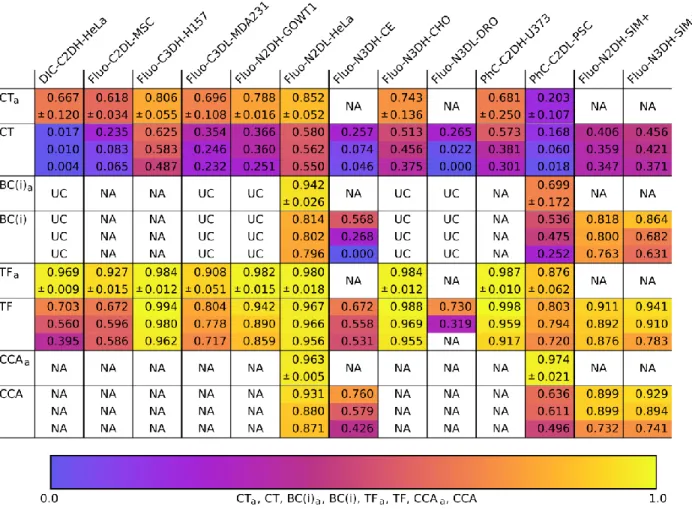
Since segmentation and tracking are meant to answer biological questions in the hands of practicing biologists, we next analyze the biologically inspired and usability measures. Table 6
(Branching correctness) and CCA (Cell cycle accuracy) and the average values obtained by the annotators (CTa, TFa, BCa,CCAa). When looking at CT along the dataset dimension (columns), we observe very low values overall, but especially so for DIC-C2DH-HeLa, Fluo-C2DL-MSC, PhC-C2DL-PSC, and the two embryonic developmental datasets (N3DH-CE and Fluo-N3DL-DRO). The low CT values are especially relevant for the embryonic datasets since tracking completeness is indeed critical for a correct genealogical reconstruction of embryo development. The TF values are at a higher level, meaning that the methods are reasonably competent at measuring cells speeds and trajectories, but some work is still required to bring them to the level of the human annotators. Finally, Fluo-N2DL-HeLa, Fluo-N2DH-SIM+ and Fluo-N3DH-SIM+ show high BC and CCA values, meaning that the methods are able to correctly detect cell divisions and cell population growth, while PhC-C2DL-PSC, the C. elegans dataset Fluo-N3DH-CE (and presumably also Drosophila Fluo-N3DL-DRO) would benefit from improved management of division events as revealed by their low BC and CCA values.
When analyzing the performance of the individual algorithms in terms of CT and TF (Table 7,
and Supplementary Data 3), we see similar but not completely matching pictures compared to
the ranking compiled using the SEG and TRA values (Table 5). This is because TF and CT are only considering tracking correctness, regardless of the accuracy of the segmentation, and have much more strict requirements on correctly reconstructed tracks (for instance three fragmented tracks overlapping a single ground truth track in multiple places would contribute towards a high
TRA score but will cause low TF and zero CT scores). This means that solutions with a high
TRA score but low TF and CT scores, do still contain errors that need to be fixed in order to enable sound biological conclusions. The KTH-SE algorithms remain the top-ranked ones in most datasets, highlighting the importance of the inclusion of global information in the linking process, which yields longer, correctly reconstructed tracklets. However, similarly to the above-discussed SEG and TRA scores, the tracking by contour evolution method LEID-NL manages to break the dominance of tracking by detection approaches (it is top-ranked three times for TF
and two times for CT). This highlights that tracking by contour evolution methods can be superior at following cells (once a track is initiated) if the temporal resolution of the data permits. As a final comment, methods that inherently (KTH-SE, HD-Har-GE, IMCB-SG) or specifically (HD-Har-GE, LEID-NL) detect cell division events show higher BC and CCA values than those that do not use specific cell division detection routines. Especially relevant is the excellent behavior of HD-Har-GE that, is ranked first three out of five possible times in the CCA category, and can therefore safely be distinguished as the best overall method when it comes to detecting complete cell cycles, and therefore, measuring cell population growth.
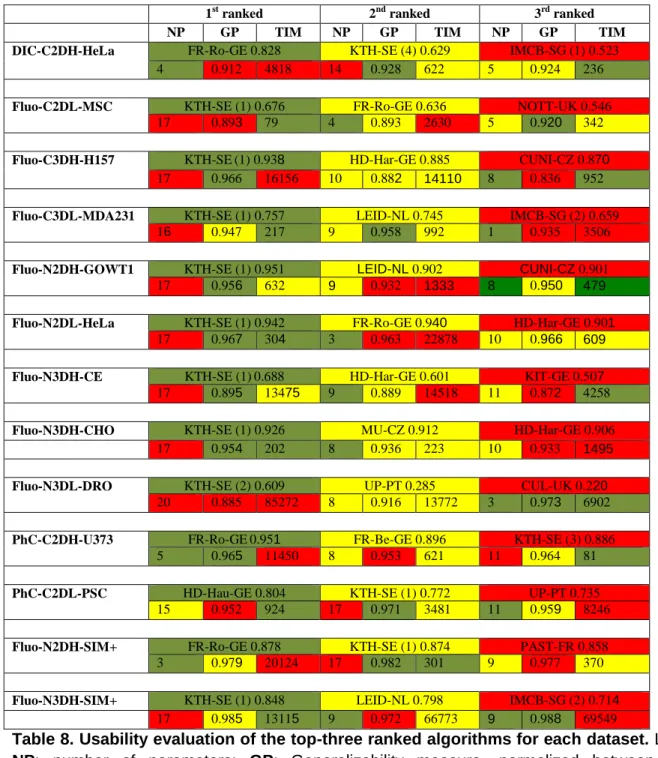
Finally, since competing solutions need to be deployed by biologists normally having little computer science experience, we analyzed the usability, the speed, and the general applicability of all top-ranked algorithms. From the results shown in Table 8 (see
using graphics cards exists). Finally, we see that the KTH-SE methods generalize very well to similar data (high GP values). This indicates that, given a well-chosen parameter configuration, this method is likely to obtain good results also for previously unseen data of the same kind.
Discussion
We have presented the results of three editions of the Cell Tracking Challenge, a benchmarking effort aimed at improving cell tracking in multidimensional microscopy. The prerequisite for our study was the compilation of a large corpus of exemplar video sequences of biological samples imaged with a variety of microscopy modalities and displaying a broad range of image qualities known to be challenging for automated segmentation and tracking of cells. The most important contribution of our work is the compilation of expert-driven annotations of cell regions and trajectories in these videos. We also include artificially generated data at an intermediate level of complexity, for which an absolute ground truth inherently exists. Together, this represents a unique and rich resource of annotated, real and simulated image data that distinguishes our challenge from similar events that relied exclusively on simulated data34. Second, we developed a set of measures that quantitatively evaluate the performance of submitted solutions against the ground truth data in terms of accuracy, biological relevance of the results, and usability for biologists. Third, over the course of three challenges, we assembled a diverse selection of competing solutions that represent all main algorithmic approaches to cell segmentation and tracking problems in biology. Fourth, in this report we analyze the accumulated data and provide useful guidelines for both users and developers of tracking software.
that to be true also in real datasets of moving cells with non-linear lineages (i.e., with division events).
From the user perspective, complete and perfect unsupervised tracking remains a distant dream. When a certain level of remaining errors or manual post-processing is acceptable, the top-scoring algorithms offer good performance. However, due to a large number of tunable parameters, practical deployment of the software on new data may prove to be cumbersome. Potentially long runtimes of complex algorithmic solutions can be offset by running them on graphics hardware whenever such implementation is feasible/available. The good news is that once parameters are optimized, manually or using automatic supervised or unsupervised algorithms, and the software runs on decent hardware, the best methods will perform well on all similar microscopy recordings. Finally, we acknowledge that due to the combinatorial explosion of colliding factors (biological, imaging, algorithmic) that affect the results of segmentation and tracking, there is no simple way to point out the right algorithm for a given dataset. This is supported by the fact that none of the presented problems were solved completely when judged from a biologist’s viewpoint.
For algorithm developers, the results of the challenge indicate that their job is far from being complete. Despite the very good results the submitted algorithms achieved on many datasets, additional method development is crucially required for scenarios with low SNR or CR or for tracking cells with more complex shapes or textures. Large 3D datasets, such as those of developing embryos, bear additional challenges. Not only do such movies show very high cell densities at later frames, the size of the image data itself causes very long runtimes. Tracking by detection approaches fail on these datasets because they crucially depend on high quality segmentation results, something difficult in these challenging datasets. Tracking by contour evolution approaches often fail on them due to their low temporal resolution.
In most circumstances, tracking is contingent on segmentation and the submitted algorithms mix and match different segmentation and tracking strategies. By equally weighting SEGand TRA
when calculating the overall performance of the methods, we assign equal importance to both tasks although, as we show, the resulting ranking is robust against changes in those weights. Furthermore the overall correlation of both measures is moderate, with only a few exceptions in datasets where the performance of a tracking solution seems to be heavily influenced by a the performance of segmentation approach.
It is important to stress that, although the challenge was broadly taken on by the community and many algorithms competed, the voluntary nature of participation necessarily resulted in significant omissions. This affected, in particular, the submissions attempting to meaningfully solve the 3D tracking problems in embryos that are the most challenging datasets and for which potent methods are published and available32,33. This situation was made worse by the lack of complete ground truth for these massive datasets.
handled manually, we plan to automate this in the near future. New datasets of existing and new microscopy modalities will over time be incorporated to the dataset repository. It will be particularly important to collect and annotate complex tissue, organ, and whole embryo data. We offer the evaluation framework, capable of computing all measures we have introduced, as an open-source Fiji plugin35, and provide executable versions of the participants’ algorithms. Furthermore, will encourage past and future participants to make their submitted algorithms available to biologists via easy to install and intuitive graphical user interfaces. Finally, we are planning to add new synthetic datasets that closely mimic the variety of cell types and microscopy scenarios. These synthetic data will model different cell labeling, cell shapes, and cell behaviors and migration patterns in 2D and 3D. Since artificially generated datasets implicitly bear absolute ground truth, they can be tuned to challenge algorithms to improve specific aspects of the problem (i.e. how to deal with increasing noise or signal heterogeneity levels), or provide training data for segmentation and tracking approaches based on promising machine learning methods.
Acknowledgments
We would like to acknowledge the following funding sources: The Spanish Ministry of Economy MINECO grants DPI201238090-C03-02 (C.O.d.S.) and DPI2015-64221-C2-2 (C.O.d.S.), TEC2013-48552-C2-1-R (A.M.B.), TEC2015-73064-EXP (A.M.B), and TEC2016-78052-R (A.M.B.); Netherlands Organization for Scientific Research (NWO) grants 612.001.018 (M.R., E.M.) and 639.021.128 (I.S.); Dutch Technology Foundation (STW) grant 10443 (I.S., E.M.); Czech Science Foundation (GACR) grant P302/12/G157 (M.K., Pa.M.); Helmholtz Association (J.S., R.M.), DFG grant MI 1315/4-1 (J.S., R.M.); the Excellence Initiative of the German Federal and State Governments EXC 294 (O.R., T.B and R.B.); the Swiss Commission for Technology and Innovation, CTI project 16997 (Ö.D., L.M.); the BMBF, projects ENGINE (NGFN+) and RNA-Code (e:Bio), and the DFG within the SFB 1129 (N.H., K.R.); the HGS MathComp Graduate School, the SFB 1129 for integrative analysis of pathogen replication and spread, the RTG 1653 for probabilistic graphical models, the CellNetworks Excellence Cluster / EcTop (C.H., S.W., F.H.); the Baxter Foundation and NIH grant AG020961 (H.M.B.), the Swedish Research Council VR Grant 2015-04026 (K.M., J.J.); the BMBF, project de.NBI, grant 031L0102 (V.U., F.J.).
We acknowledge the work of those who manually annotated the datasets to create the ground truths used to evaluate the performance of the algorithms: A. Urbiola, C. Ederra, T. España, S. Venkatesan, D.M.W. Balak, P. Karas, T. Bolcková, M. Štreitová, M. Charousová, L. Zátopková.
We also would like to thank those who provided the datasets used in the three challenge editions: Dr. F. Prósper, Dr. E. Bártová, Dr. J. Essers, the Mitocheck consortium, Dr. A. Rouzaut, Dr. R. Kamm, the Waterston Lab, Dr. P. Keller, Dr. S. Kumar, Dr. G. van Cappellen, and Dr. T. Becker.
Finally, we thank R. Stoklasa for technical support. The participants would like to acknowledge the contributions of participants not listed among the authors: M. Schiegg, D. Stöckel, J. Crowe, M. Temerinac-Ott.
Author’s contributions
Vladimír Ulman: Actively participated in the organization and management of the CTC challenges by handling submissions, producing synthetic datasets, evaluating the submitted results and globally analyzing the participant’s contributions, created annotations for dataset evaluation. Contributed to the writing of the manuscript and produced the tables and plot results.
Martin Maška: Actively participated in the organization and management of the CTC challenges: handled and evaluated submissions, provided evaluation and annotation software, supervised annotations, created consensual ground truths for the evaluation of the submitted results. Contributed to the writing of the manuscript. Challenge participant.
Klas E. G. Magnusson: Top ranked challenge participant. Contributed to the writing of the manuscript.
Olaf Ronneberger: Top ranked challenge participant. Contributed to the writing of the manuscript.
Carsten Haubold: Top ranked challenge participant. Contributed to the writing of the manuscript.
Nathalie Harder: Top ranked challenge participant.
Pavel Matula: Actively participated in the organization of the CTC challenges: Led the development of a suitable tracking measure and assessed the behavior of various measures on challenge datasets.
Petr Matula: Actively participated in the organization of the CTC challenges: prepared data and supervised data annotation.
David Svoboda: Actively participated in the organization of the CTC challenges: Led the development of synthetic data generator and creation of suitable collection of synthetic time-lapse sequences with absolute ground truth.
Miroslav Radojevic: Actively participated in the organization of the CTC challenges: prepared data and supervised data annotation.
Ihor Smal: Actively participated in the organization of the CTC challenges: prepared data and supervised data annotation.
Karl Rohr: Challenge participant. Joakim Jaldén: Challenge participant. Helen M. Blau: Challenge participant. Oleh Dzyubachyk: Challenge participant. Boudewijn Lelieveldt: Challenge participant. Pengdong Xiao: : Challenge participant. Yuexiang Li: Challenge participant. Siu-Yeung Cho: Challenge participant. Alexandre Dufour: Challenge participant.
Jean Christophe Olivo-Marin: Challenge participant. Constantino C. Reyes-Aldasoro: Challenge participant. Jose A. Solis-Lemus: Challenge participant.
Johannes Stegmaier: Challenge participant. Ralf Mikut: Challenge participant.
Steffen Wolf: Challenge participant.
Fred. A. Hamprecht: Challenge participant.
Tiago José Arieria Esteves: Challenge participant. Pedro Quelhas: Challenge participant.
Ömer Demirel: Challenge participant. Lars Malmström: Challenge participant.
Florian Jug: Contributed to the revision of the manuscript and supported V.U. with the related data processing.
Pavel Tomančák: Challenge organizer. Contributed to the revision of the manuscript. Erik Meijering: Challenge organizer. Contributed to the writing of the manuscript.
Arrate Muñoz-Barrutia: Challenge organizer. Contributed to the writing of the manuscript. Michal Kozubek: Challenge organizer. Contributed to the writing of the manuscript.
Carlos Ortiz-de-Solorzano: Challenge organizer. Coordinated the work of the committee that organized the challenges. Wrote the manuscript with the input from all authors.
Competing financial interests
All the authors declare not to have competing financial interests.
References
1. Franz, C.M, Jones, G.E. & Ridley, A.J.. Cell migration in development and disease. Dev. Cell.2, 153-158 (2002).
2. Bullen, A. Microscopy imaging techniques for drug discovery. Nat. Rev. Drug Discov.7, 54-67 (2007).
3. Walter, R.J., Berns, M.W. Digital image processing and analysis, in Video Microscopy. (S. Inoué Ed.) Springer Sciences, p. 327-392 (1986)
4. Schneider, C.A., Rasband, W.S. & Elicieri, K.W. NIH Image to ImageJ: 25 years of image analysis. Nat. Methods9, 671-675 (2012).
5. Meijering, E. Cell segmentation: 50 years down the road. IEEE Signal Proc. Mag. 29, 140-145 (2012)
6. Dufour, A.C, Liu, T-Y., Ducroz, C., Tournemenne, R., Cummings, B., Thibeaux, R., Guillen, N., Hero, A.O., Olivo-Marin, J.C. Signal processing challenges in quantitative 3-D cell morphology: More than meets the eye. IEEE Signal Proc. Mag 32, 30-40 (2015).
7. Zimmer, C., Zhang, B., Dufour, A., Thebaud, A., Berlemont S., Meas-Yedid, J., Olivo-Marin, J.C. On the digital trail of mobile cells. IEEE Signal Proc. Mag.23, 54-62 (2006)
8. Wuttisarnwattana, P., Gargesha, M., vant’t Hof. W., Cooke, K.R., Wilson, D.L.
Automatic stem cell detection in microscopic whole mouse cryo-imaging. IEEE Trans. Med. Imag. 35, 819-829, (2016)
9. Lerner, B., Clocksin, W.F., Dhanjal, S., Hultén, S., Bishop, C.M. Automatic signal classification in fluorescence in situ hybridization images. Cytometry 43, 87-93 (2001)
10. Chen, X., Zhou, X., Wong, S.T.C Automated segmentation, classification, and tracking of cancer cell nuclei in time-lapse microscopy. IEEE Trans. Biomed. Eng. 53, 762-766 (2006)
11. Henry, K.M., Pase, L., Ramos-Lopez, C.F., Lieschke, G.J., Renshaw, S.A., Reyes-Aldasoro, C.C. PhagoSight: an open-source MATLAB package for the analysis of fluorescent neutrophil and macrophage migration in a zebrafish model. PloS ONE 8, e72636 (2013)
12. Wählby, C., Sintorn, I.M., Elandsson, F., Borgefors, G., Bengtsson, E. Combining intensity, edge and shape information for 2D and 3D segmentation of cell nuclei in tissue sections. J. Microsc-Oxford, 215, 67-76 (2004)
13. Cicconet, M., Geiger, D., Gunsalus, K., Wavelet-based circular hough-transform and its application in embryo development analysis. VISAPP 2013, Proceedings of the International Conference on Computer Vision Theory and Applications, 669-674, (2013)
14. Türetken, E., Wang, X., Becker, C.J., Haubold, C., Fua, P. Network flow integer programming to track elliptical cells in time-lapse sequences. IEEE Trans. Med. Imag.
36, 942-951, (2016)
16. Ortiz-de-Solorzano, C., García-Rodríguez, E., Jones, A., Pinkel, D., Gray, J.W., Sudar, D., Lockett, S.J. Segmentation of confocal microscopy images of cell nuclei in thick tissue sections. J. Microsc-Oxford, 193, 212-226 (1999)
17. Cliffe, A., Doupé, D.P., Sung, H., Lim, I.K.H., Ong, K.H., Cheng, L., Yu, W. Quantitative 3D analysis of complex single border cell behaviors in coordinated collective cell migration. Nat. Commun.8:14905 (2017)
18. Ronneberger, O., Fisher, P., Brox, T. U-net: Convolutional networks for biomedical image segmentation. In Proc. MICCAI 2015 LCNS 9351, 234-241, (2015).
19. Schiegg, M., Hanslovsky, P., Haubold, C., Koethe, U., Hufnagel, L., Hampretch, F.A., Graphical model for joint segmentation and tracking of multiple dividing cells. Bioinformatics31, 948-56 (2015)
20. Zimmer, C., Labruyere, E., Meas-Yedid, V., Guillen, N., Olivo-Marin, J-C. Segmentation and tracking of migrating cells in videomicroscopy with parametric active contours: a tool for cell-based drug testing. IEEE Trans. Med. Imag. 21, 1212-1221, (2002)
21. Dufour, A., Thibeaux, R., Labruyere, E., Guillen, N., Olivo-Marin, J.C. 3D active meshes: fast discrete deformable models for cell tracking in 3D time-lapse microscopy. IEEE Trans. Image Process.20, 1925–37 (2011).
22. Maška, M., Daněk. O., Garasa, S., Rouzaut, A., Muñoz-Barrutia, A., Ortiz-de-Solorzano,
C., Segmentation and shape tracking of whole fluorescent cells based on the Chan-Vese model. IEEE Trans. Med. Imag. 32, 995-1005, (2013)
23. Ortiz-de-Solorzano, C., Malladi, R., Lelievre, S.A., Lockett, S.J. Segmentation of nuclei and cells using membrane related protein markers. J. Microsc-Oxford, 201, 404-415 (2001)
24. Dzyubachyk, O., van Cappellen, W.A., Essers, J., Niessen, W.J., Meijering, E., Advanced level-set-based cell tracking in time-lapse fluorescence microscopy. IEEE Trans. Med. Imag. 29, 852-867, (2010)
25. Dufour, A., Shinin, V., Tajbakhsh, S., Guillen-Aghion, N., Olivo-Marin, J.C., Zimmer, C. Segmenting and tracking fluorescent cells in dynamic 3D microscopy with coupled active surfaces. IEEE Trans. Image Process.14, 1396–1410 (2005)
26. Bensch, R., and Ronneberger, O., Cell segmentation and tracking in phase contrast images using graph cut with asymmetric boundary costs. In Proc. 2015 IEEE Int. Symp. Biomed. Imaging (ISBI), 1120-1123 (2015)
27. Harder, N., Mora-Bermúdez, F., Godinez, W.J., Wünsche, A., Elis, R., Ellenberg, J., Rohr, K. Automatic analysis of dividing cells in live cell movies to detect mitotic delays and correlate phenotypes in time. Genome Res.19, 2113–2124 (2009)
28. Bise, R., Yin, Z., Kanade, T. Reliable cell tracking by global data association. in Proc. 2011 IEEE Int. Symp. Biomed. Imaging (ISBI), 1004-1010 (2011).
29. Magnusson, K.E.G., Jaldén, J., Gilbert, P.M., Blau, H.M. Global linking of cell tracks using the Viterbi algorithm, IEEE Trans. Med. Imag.34, 1–19 (2015).
30. Maška, M., Ulman, V., Svoboda, D., Matula, Pt., Matula, Pv., Ederra, C. Urbiola, A.,
& Ortiz-de-Solorzano, C. A benchmark for comparison of cell tracking algorithms. Bioinformatics 30, 1609-1617 (2014)
31. Svoboda, D. & Ulman,V. MitoGen: A framework for generating 3D synthetic time-lapse sequences of cell populations in fluorescence microscopy. IEEE Trans. Med. Imaging
36, 310-321 (2017)
32. Murray, J.I., Bao, Z., Boule, T.J., Boeck, M.E., Mericle, B.L., Nicholas, T.J., Zhao, Z., Sandel, M.J., Waterston, R.H. Automated analysis of embryonic gene expression with cellular resolution in C. elegans. Nat. Methods.5, 703-9 (2008)
33. Amat, F., Lemon, W., Mossing, D.P., McDole, K., Wan, Y., Branson, K., Myers, E.W., Keller, P.J. Fast, accurate reconstruction of cell lineages from large-scale fluorescence microscopy data. Nat. Methods.11, 951-8 (2014)
34. Chenouard, N, Smal, I., de Chaumont, F., Maška, M., Sbalzarini, I.F, Gong, Y. et al. Objective comparison of particle tracking methods. Nat. Methods11, 281-289 (2014)
35. Schindelin, J., Arganda-Carreras, I., Frise, E., Kaynig, V., Longair, M., Pietzsch, T., Rueden, C., Saafeld, S., Schmid, B., Tinevez, J.Y., White, D.J., Hartenstein, V., Elliceri, K., Tomancak, P., Cardona, A. Fiji: an open source platform for biological-image analysis. Nat. Methods9, 676-82 (2012)
Online Methods
Dataset quality parameters
In order to assess the quantitative video parameters (see Table 1), we had to calculate those parameters –ideally- on a complete ground truth of the competition datasets, meaning having appropriate cell masks and tracking information for all the cells in the videos. The ground truth used to evaluate the performance of the algorithms (SEG-GT and TRA-GT) was obtained manually from three annotators. TRA-GT indeed contains the manually annotated tracks of all the cells in the videos. However, due to the monumental task that it would have required, SEG-GT includes a subset of complete segmentation masks per video, which consists of a representative amount for the evaluation of segmentation performance. To extend the manual ground truth to cover as many as possible of the cells in the videos, we first combined the manual tracking ground truth (TRA-GT) with the segmentation masks provided by the participants. For any tracking point in TRA-GT, we automatically merged the top-performing participants’ segmentation masks that included this tracking point. The number of masks used was determined manually for each video. On average, majority of the total number of available masks were used. The process led occasionally to colliding situations, that is, when obtained segmentation masks for two different tracking points were overlapping. If the overlap was less than 10% of the mask area/volume, the intersecting pixels/voxels were removed from both colliding masks in an expectation that 10% loss will not significantly influence the measured quantities. Otherwise, both entire masks were discarded. In this way, a rich consensus-based segmentation with reliable linking was obtained for all real challenge videos. The synthetic datasets did not require this process, since they are accompanied with the absolute segmentation and tracking ground truth, inherently generated during the simulation process.
Next, a mask for the background region of each video was established as the complement to the union of all objects' consensus segmentation masks taken over all frames of the given video. This results in a constant -stationary over the video- background mask that fits to all images of that video. A background mask for synthetic datasets was established also like this. For Fluo-N3DH-CE and Fluo-N3DL-DRO datasets, however, the background masks had to be established on per-frame basis, encompassing interior region of the embryos as well as the surrounding medium.
From the consensus segmentation and tracking ground truth, we calculated quantitative parameters as follows. Let FGi,t and BGtrepresent the sets of image elements that form i-th cell and (single) background mask, respectively, in t-th image of the video. Furthermore, let avg(S)
and std(S) denote average and standard deviation of intensities found at image elements in the
parameters were established as averages of SNRi,t, CRi,t, HETii,t, Resi,t, Shai,t, Deni,t,and Ovei,t values, respectively, calculated for every object in every image in both competition videos:
𝑆𝑁𝑅𝑖,𝑡 =|𝑎𝑣𝑔(𝐹𝐺𝑖,𝑡) − 𝑎𝑣𝑔(𝐵𝐺𝑡)| 𝑠𝑡𝑑(𝐵𝐺𝑡)
𝐶𝑅𝑖,𝑡=𝑎𝑣𝑔(𝐹𝐺𝑖,𝑡) 𝑎𝑣𝑔(𝐵𝐺𝑡)
𝐻𝐸𝑇𝑖𝑖,𝑡 = 𝑠𝑡𝑑(𝐹𝐺𝑖,𝑡)
|𝑎𝑣𝑔(𝐹𝐺𝑖,𝑡) − 𝑎𝑣𝑔(𝐵𝐺𝑡)|
𝐻𝐸𝑇𝑏𝑖,𝑡 = |𝑎𝑣𝑔(𝐹𝐺𝑖,𝑡) − 𝑎𝑣𝑔(𝐵𝐺𝑡)| ∑𝑗∈𝐼(𝑡)|𝑎𝑣𝑔(𝐹𝐺𝑗,𝑡) − 𝑎𝑣𝑔(𝐵𝐺𝑡)|/|𝐼(𝑡)|
𝑅𝑒𝑠𝑖,𝑡 = |𝐹𝐺𝑖,𝑡|
𝐷𝑒𝑛𝑖,𝑡= 𝑚𝑖𝑛{50, 𝑑𝑖𝑠𝑡(𝑎, 𝑏) ∥ 𝑎 ∈ 𝐹𝐺𝑖,𝑡 , 𝑏 ∈ 𝐹𝐺𝑗,𝑡, 𝑗 ∈ 𝐼(𝑡), 𝑗 ≠ 𝑖}
𝑂𝑣𝑒𝑖,𝑡= |{𝑎 ∈ 𝐹𝐺𝑖,𝑡∥ ∃𝑏 ∈ 𝐹𝐺𝑖,𝑡−1∶ 𝑑𝑖𝑠𝑡(𝑎, 𝑏) = 0}| |𝐹𝐺𝑖,𝑡|
where |S| is the size of the set S and I(t) is the set of indices of all cells or nuclei segmented in the t-th image. The Hetb is calculated as the standard deviation of HETbi,t values for every object in every image in both competition videos. Shai,t is the circularity37 for 2D objects, which is given as the normalized ratio of perimeter of a circle having the same area as the object to the actual area of the object, and sphericity37 for 3D objects, which is given as the normalized ratio of the surface area of a sphere having the same volume as the object to the actual surface area of the object. Note that in the latter case the actual (anisotropic) voxel size was taken into account. The Deni,twas evaluated only up to the distance of 50 image elements away from i-th object. The distance tells how many (background) pixels/voxels there are between two nearby objects. Clearly, higher number expects separating nearby objects easier. To calculate Cha, the
difference between average object intensity at the end and the beginning of a video was divided by the number of images comprising this video, and Cha reported for a dataset is the average over both videos. Mit is the average of Mitt taken over images from both videos, where Mitt is the number of objects whose tracks end in the t-th image because of subsequent division event (which is marked in the tracking ground truth TRA-GT). The remaining qualitative parameters, Syn, Ent/Leav, Apo, and Deb were set after manual inspection of the datasets.
Description of datasets
DIC-C2DH-HeLa (Supplementary Video 1, Fig. 4a, Supplementary Material: Fig. 1): HeLa
cells on a flat glass substrate. The uses of this cell line and setup are similar to Fluo-N2DL-Hela, with the physiological advantages of transmission microscopy over fluorescence described for PhC-C2DH-U373.
This dataset presents low SNR and CR values characteristic of phase-enhancement microscopy techniques. Heti and Hetb are high due to the presence of DIC-highlighted internal structures and organelles (Heti), and the fact that in most frames co-exist well spread interphase cells with brighter, rounded shaped cells undergoing mitosis (Hetb). Finally, another relevant problem of this dataset is the high density of the cells, which are highly clustered, occupy the majority of the image area and barely show intensity changes between neighboring cells.
These videos are courtesy of Dr. Gert van Cappellen, Optical Imaging Center, Department of Pathology, Erasmus University Medical Center, Rotterdam (the Netherlands).
Fluo-C2DL-MSC (Supplementary Video 2, Fig. 4b, Supplementary Material: Fig. 2): Rat mesenchymal stem cells (MSCs) on a flat polyacrylamide substrate stained by stable transfection with Actin-GFP. Mesenchymal stem cells are non-hematopoietic cells located in the bone marrow that can differentiate into several cell types such as osteoblasts, adipocytes and hematopoietic-supporting stromal cells. The ex vivo expansion and in vivo differentiation of these cells is of high therapeutic value, and has been used in both cell and tissue engineering therapies to treat acute graft-versus-host disease after allogeneic hematopoietic stem cell transplant, promote heart recovery after ischemic heart disease and congestive heart failure, treat cirrhosis, hepatitis and other liver diseases, etc. In this context, the study of the migratory properties of MSCs is relevant since it is indeed related to their ability to access sites of inflammation and their homing and engrafting properties. Especially relevant is the dependence of MSCs migration on the biomechanical properties of their substrate, which has a quantifiable effect both on the morphology of the cells (segmentation) and the dynamics of their migration patterns (tracking).
The SNR and CR values are low, due to the low level of emission of the fluorescent cytoplasmic reporter, especially in the long, thin filopodial extensions of the cell. The intensity is also quite variable in different parts of the cell, causing high Heti. The cells present different levels of intensity, possibly due to different levels of expression of the transfected fluorescent reporter, thus producing high Hetb values. The shape of the cells is highly irregular (Sha) due to the long filopodial extensions, show a significant degree of bleaching (Cha) and move fast, causing low overlap (Ove) of the cells between consecutive frames.
These videos are courtesy of Dr. F. Prósper, Center for Applied Medical Research, Pamplona (Spain).
itself as a response to different molecular stimuli. It also gives information about the relationship between the morpho-mechanic properties of the extracellular environment and cell migration. These cells are key for pharmacological studies aimed at blocking migration by interfering with the mechanosensing and mechanotransducing properties of the cells which, in turn, produce changes in cell morphology and migration dynamics.
This dataset displays reasonably good values for most properties, with the exception of some signal decay due to photobleaching (Cha). This is a negative side-effect of the high-resolution of the images, which requires a dense optical sectioning, and therefore high acquisition times and thus lenghty exposures of the fluorochrome to the light. The presence of prominent blebs, and some heterogeneity between cell intensities can also complicate accurately segmenting and delineating the cell boundaries.
The videos are courtesy of Dr. A. Rouzaut, Cell Adhesion and Metastasis Laboratory, Center for Applied Medical Research, Pamplona (Spain).
Fluo-C3DL-MDA231 (Supplementary Video 4, Fig. 4d, Supplementary Material: Fig. 4):
MDA231 human breast carcinoma cells infected with a plasmic murine stem cell virus (pMSCV) vector including the GFP sequence, embedded in a 3D collagen matrix. These cells are also metastatic, and their uses in the context of cell tracking are similar to the ones described for Fluo-C3DH-H157.
The SNR and CR of this dataset are relatively low due both to low signal intensity and increased background which affects the quality of the signal especially in the long migration-related filopodial extensions. This noisy signal efficiency causes high internal heterogeneity (Heti.). To complicate the segmentation and tracking even further, the images are acquired at low resolution, especially in the axial direction (Res), and also in the temporal dimension (Ove) and suffer from significant photobleaching (Cha).
These videos are courtesy of Dr. Roger Kamm, Department of Biological Engineering, Massachusetts Institute of Technology, Cambridge, MA (USA).
Fluo-N2DH-GOWT1 (Supplementary Video 5, Fig. 4e, Supplementary Material: Fig. 5):
Multipotent mouse embryonic stem cell nuclei, chromatin-stained by stable transfection with histone H2B-GFP. Embryonic stem cells are used in many areas of research, most notably in the study and application of cell differentiation, with strong therapeutic potential particularly for neural regeneration, cardiology, and hemato-oncology. These cells do not have a clear motile phenotype, but segmentation and tracking is still of interest to give a spatial frame to intracellular molecular trafficking events, to detect and quantify cell division as part of the differentiation process and to capture the dynamics of tissue or organogenesis.
This dataset presents average to good values in all properties, except the internal heterogeneity of the nuclear signal due to the existence of prominent, unlabeled nucleoli (Heti) and the heterogeneity of the average cell intensities (Hetb) due possibly to different levels of efficiency of the transfected reporter.
These videos are courtesy of Dr. E. Bártová, Institute of Biophysics, Academy of Sciences of the Czech Republic, Brno (Czech Republic).
Fluo-N2DL-Hela (Supplementary Video 6, Fig. 4f, Supplementary Material: Fig. 6): H2B-GFP stably transfected HeLa cells, the oldest immortalized human cell line, obtained from a cervical cancer. They have been used innumerable times in biological research. Cells, as in the previous two cases, are not properly motile, and tracking is mainly a tool for nuclear delineation and detection of mitotic expansion.
This dataset displays average or good values for most properties, except for CR, which is alleviated by a high SNR, provided by the high dynamic range of the detector used. Also poor are the values corresponding to the signal heterogeneity between cells (Hetb), the spatial resolution (Res), cell density (Den) and the presence of division events (Mit).
These videos were kindly provided by the Mitocheck Consortium (http://www.mitocheck.org).
Fluo-N3DH-CE (Supplementary Video 7, Fig. 4g, Supplementary Material: Fig. 7): Early stage C. elegans developing embryo with nuclei stained by GFP transfection. This nematode is the simplest and most commonly used model for the study of the genetic expression and regulatory networks that control embryonic development. It is also widely applied to study other cellular processes such as cell-to-cell communication and wound healing. In this context, automatic cell tracking can simplify the process of quantifying migration capacity and building cell lineages. With this dataset we wanted to see the ability of algorithms to keep track of significantly increasing population of cells, where divisions events are equally important to nuclei tracking in order to construct proper lineages.
The most significant problems of this dataset are high cell density (Den) low cell overlap between frames (Ove) caused by large temporal acquisition step and the abundance of mitotic cells typical of a developing embryo (Mit). This is aggravated by average to low values in most other categories, which turn this dataset into one of the most challenging ones provided by the challenge.
These videos are courtesy of the Waterston Lab, The George Washington University, Washington DC (USA).
Fluo-N3DH-CHO (Supplementary Video 8, Fig. 4h, Supplementary Material: Fig. 8):
Chinese Hamster Ovarian (CHO) cell nuclei, chromatin-stained by transfection with PCNA-GFP. A well-established cell line derived from the ovaries of Chinese hamsters. It constitutes a commonly used mammalian cell model in biomedical research. In addition, they are frequently used to manufacture therapeutic recombinant proteins. As in the case of Fluo-N2DH-GOWT1, these cells do no have a motile phenotype. The emphasis of tracking is also in accurate nuclear segmentation and detection of mitotic events.
All the property values of this dataset are high, rendering this dataset one of the least challenging ones. Only two are just average: the internal heterogeneity of the staining (Heti), clearly visible in the images and caused by the fact that the nuclear staining does not label the nucleoli of the cells, and the relatively high cell density (Den).
These videos are courtesy of Dr. J. Essers, Departments of Genetics, Vascular Surgery, and Radiation Oncology, Erasmus University Medical Center, Rotterdam (the Netherlands).
Fluo-N3DL-DRO (Supplementary Video 9, Fig. 4i, Supplementary Material: Fig. 9):