City, University of London Institutional Repository
Citation
:
Fonseca, J. ORCID: 0000-0002-7654-6005, Nadimi, S. and Kong, D. (2018).
Image-based modelling of shelly carbonate sand for foundation design of offshore
structures. In: Proceedings of the 1st Vietnam Symposium on Advances in Offshore
Engineering. VSOE 2018. Lecture Notes in Civil Engineering. (pp. 55-60). Singapore:
Springer. ISBN 978-981-13-2305-8
This is the accepted version of the paper.
This version of the publication may differ from the final published
version.
Permanent repository link:
http://openaccess.city.ac.uk/id/eprint/20953/
Link to published version
:
http://dx.doi.org/10.1007/978-981-13-2306-5_5
Copyright and reuse:
City Research Online aims to make research
outputs of City, University of London available to a wider audience.
Copyright and Moral Rights remain with the author(s) and/or copyright
holders. URLs from City Research Online may be freely distributed and
linked to.
City Research Online:
http://openaccess.city.ac.uk/
[email protected]
foundation design of offshore structures
Joana Fonseca1[0000-0002-7654-6005] Sadegh Nadimi 2[0000-0002-0971-7089] Deqiong Kong
3[0000-0002-9122-9294]
1
City, University of London, London EC1V 0HB, UK
2 University of Leeds, Leeds LS2 9JT, UK 3
Zhejiang University, Hangzhou, China
Abstract. For the most part, carbonate soils are of biogenic origin comprising skeleton bodies and shells of small organisms, the shelly carbonate sands. Ow-ing to the complex microstructure of these soils, there are many uncertainties related to their mechanical behavior, in particular, regarding their high com-pressibility. Aside from obvious safety concerns, the inability to predict the be-havior of carbonate sands involves extensive remedial measures and leads in-variably to severe time delays and increased construction costs. This study makes use of 3D images of the internal structure of a shelly carbonate sand un-der compression on a small oedometer placed inside an x-ray scanner. The im-ages are first used to gain insights into the grain-scale properties of the material and then the soil microstructure is virtualized and simulated within a framework of combined discrete–finite-element method. This study contributes towards a better understand the grain-scale phenomena shaping the macro response of shelly carbonate sands, which differs considerably from more commonly stud-ied silica sands of terrigeneous origin.
Keywords: Carbonate Sand, Microstructure/Fabric, Numerical Modelling.
1
Introduction
The behavior of offshore foundations in shelly carbonate soils is challenging, as evi-denced by numerous accidents occurring during platform installation in the 80s [1]. While failures are now relatively rare, conservative methods and high factors of safety are used to account for the poor predictions obtained from traditional design methods [2]. As a consequence of the many uncertainties related to the soil properties and be-havior, carbonate sands have been placed into a niche classification of ‘problematic soils’ in most design guides [2,3]. According to international practice guides for off-shore platforms, general design procedures for foundations in carbonate soils are not available [e.g. 3].
skele-2
ton bodies and shells tend to form interlocked fabrics of large voids within. The col-lapse of these intricate microstructures under loading are believed to be associated with the high compressibility of the material. This paper presents recent advances on the characterization and modelling of sands with complex morphologies.
2
Experimental tests
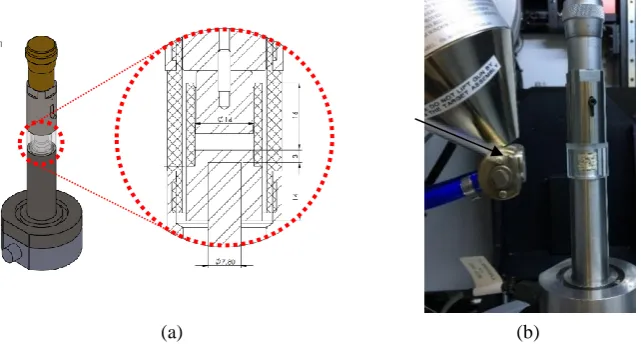
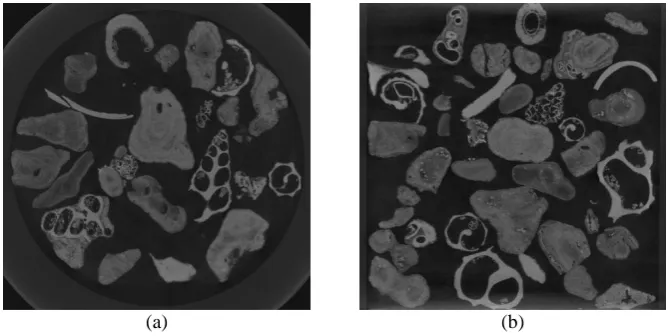
The experiments consisted of testing small samples of a shelly sand from the Persian Gulf using a mini oedometer placed inside an µCT x-ray scanner. The system used was a Nikon XTH 225 ST located at the Research Centre at Harwell, Oxfordshire (UK). The mini oedometer had a diameter of 13.5mm and an aspect ratio (height/diameter) of approximately 1. The force was exerted by a micrometer with 500N axial loading capacity [7]. The soil container was made of Perspex with 2mm thickness which yields less than 3 µm deflection under the maximum applied force. Possible lateral friction resulting from the displacement of the container has been minimized by considering a 1 mm gap between the container and the x-ray window. A schematics of the experimental set-up comprising the load cell, the vertical piston, the micrometer and the mini oedometer is shown in Fig.1a. Fig.1b provides a view from inside the scanner showing the x-ray source and the soil sample. The sand is a well graded material with a median grain size of 2mm. The 3D images were acquired at a resolution of 9.5 µm (length of voxel edge). Top and side views of the scanned sample before loading are presented in Figs. 2a and 2b, respectively. The diversity and of shapes and complexity of features can be observed.
[image:3.595.133.454.469.641.2](a) (b)
(a) (b)
Fig. 2. Cross sections through the 3D tomographic image of the shelly sand prior to loading. (a) top view; (b) side view.
3
Grain-scale characterization
In order to extract quantitative information from the 3D tomographic images it is necessary to segment the images and identify the individual grains. In-house imaging processing codes were developed to first binarise the images using Otsu’s threshold-ing and subsequently apply an iterative watershed algorithm to separate the grains touching. The codes are fully described in [8]. The key advantage of the watershed code, when compared with previously used codes, is its ability to overcome the chal-lenges posed by the diversity and complexity of the shapes associated with the bio-clastic nature of shelly sands.
The measurements of grain properties presented here comprise the size and shape parameters. The grain size was quantified by means of the major, intermediate and minor axis lengths, denoted by a, b and c, respectively. These lengths were obtained using principal component analysis (PCA), more details can be found in [5]. The shape of the grains was quantified using four parameters comprising: elongation, flatness, convexity and sphericity. The elongation (IE) and flatness (IF) indices are
obtained by IE=(a-b)/a and IF=(b-c)/b, respectively. The convexity and circularity are
calculated as IC=Vgrain/Vcon and IS=Vgrain/VS, where Vgrain is the volume of the grain,
Vcon is the volume of the minimum convex hull that encloses the grain and VS is the
volume of the circumscribed sphere of the grain. An additional parameter, the angu-larity index (IA as defined in [5]), is used to quantify the major surface irregularities,
i.e., edges and corners. The index is defined such that rounded grains will yield low IA
and angular grains will have high IA values, more details in [8]. These parameters
4
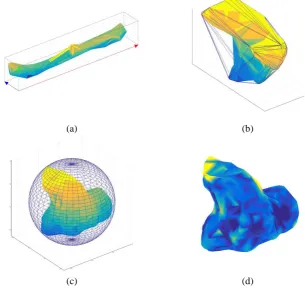
shape measurements for typical grains in the sample to demonstrate the effectiveness of the proposed indices. Fig. 3a shows a very elongated grain and this feature is well captured by the elongation index which takes a value of 0.82; the flatness index measured is very small, 0.16, as expected. Fig. 3b shows another grain with the asso-ciated convex hull represented by a triangular mesh and the convexity value measured was of 0.52. Fig. 3c displays a grain with the associated circumscribed sphere, a sphe-ricity value of 0.33 was measured that captures well the deviation of this shape to that of the sphere. The same grain is used to quantify the angularity of the sharp corners, represented here with a brighter color (Fig. 3d). The overall angularity value meas-ured was of 0.55.
(a) (b)
[image:5.595.135.441.307.597.2](c) (d)
4
Numerical modelling
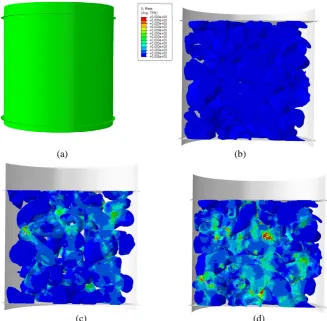
The microstructure of the sample prior to loading, obtained from the µCT images, was virtualized to be used to numerically simulate the 1D compression test [9]. The first step consisted of meshing the individual grains using a refinement of the con-strained Delaunay triangulation implemented in Matlab [10]. Subsequently the nu-merical mesh was imported into a micro Finite Element (µFE) model that runs in Abaqus [11]. The sample was confined laterally using a rigid cylinder, as shown in Fig. 4a, and the displacement was applied at the top of the sample. The evolution of the stress distribution in the full assembly as the deformation progresses is investigat-ed here. The von Mises criterion is usinvestigat-ed. Fig. 4b shows a vertical cut through the as-sembly prior to the application of the vertical load. As the applied load increases, so does the stress measured within the grains, in particular for those involved in the stress transmission chain. This can be visualized in Figs. 4c and 4d, where the higher stresses are represented by brighter colors according to the colormap presented.
(a) (b)
(c) (d)
[image:6.595.127.455.343.664.2]6
5
Conclusions
This paper demonstrates the potential of using advanced image-based techniques to gain insights into the microstructure of shelly carbonate sands and better understand the physical phenomena triggering their high compressibility. It is shown that using a numerical tool that accounts for the true shape of the grains and for the stress propa-gation within the grains is pivotal for a more accurate modelling of soils with com-plex morphologies.
Acknowledgments The authors gratefully acknowledge the financial support by the UK Engineer-ing and Physical Sciences Research Council (EPSRC) under the grant number EP/N018168/1 and the collaboration of Prof Peter Lee from the Research Centre at Harwell.
References
1. Yasufuku, N., Hyde, A.F.I. Pile end-bearing capacity in crushable sands. Géotechnique 45(4), pp. 663-676, (1995)
2. Jardine, R., Chow, F., Overy, R. & Standing, J. ICP design methods for driven piles in sands and clays. London, UK: Thomas Telford Ltd. (2005)
3. API (American Petroleum Institute). Recommended practice for offshore platforms. Wash-ington, DC, USA: API (2007)
4. Semple, R.M. The mechanical properties of carbonate soils. In Engineering for calcareous sediments (eds R. J. Jewell and D. C. Andrews), pp. 807–836. Rotterdam, the Netherlands: Balkema (1988).
5. Fonseca, J., Reyes-Aldasoro, C.C., Wils, L. Three-dimensional quantification of the mor-phology and intragranular void ratio of a shelly carbonate sand. Proc. 6th Int. Symp. Def. Characteristics Geomaterials. (2015).
6. Coop, M.R. The mechanics of uncemented carbonate sands. Géotechnique, 40(4), pp. 607– 626 (1990).
7. Nadimi, S., Kong, D., Fonseca, J. From imaging to prediction of carbonate sand behaviour. Paper presented at the ICTMS 2017, 26-30 Jun 2017, Lund, Sweden (2017).
8. Kong, D., Fonseca, J., Quantification of the morphology of shelly carbonate sands using 3D images. Géotechnique, 68(3), pp. 249-261 (2018).
9. Nadimi, S., Fonseca, J., A micro finite-element model for soil behaviour. Géotechnique, 68(4), pp 290-302 (2018).
10. Mathworks MATLAB version 9.0 (R2016a). Natick, MA, USA: Mathworks, Inc. (2016). 11. Dassault Systèmes. ABAQUS user’s manual 2014 version 6.14. Providence, RI, USA: