City, University of London Institutional Repository
Citation
:
Karathanassis, I. K., Papanicolaou, E., Belessiotis, V. & Bergeles, G. (2017). Design and experimental evaluation of a parabolic-trough concentrating photovoltaic/thermal (CPVT) system with high-efficiency cooling. Renewable Energy, 101, pp. 467-483. doi: 10.1016/j.renene.2016.09.013This is the accepted version of the paper.
This version of the publication may differ from the final published
version.
Permanent repository link: http://openaccess.city.ac.uk/18283/
Link to published version
:
http://dx.doi.org/10.1016/j.renene.2016.09.013Copyright and reuse:
City Research Online aims to make research
outputs of City, University of London available to a wider audience.
Copyright and Moral Rights remain with the author(s) and/or copyright
holders. URLs from City Research Online may be freely distributed and
linked to.
City Research Online: http://openaccess.city.ac.uk/ publications@city.ac.uk
1
Design and experimental evaluation of a parabolic-trough Concentrating
1
Photovoltaic/Thermal (CPVT) system with high-efficiency cooling.
2 3
I.K. Karathanassisa, b,1*, E. Papanicolaoua, V. Belessiotisa and G.C. Bergelesb,1
4 5
a
Solar & other Energy Systems Laboratory, Institute of Nuclear and Radiological Sciences & Technology,
6
Energy and Safety, National Centre for Scientific Research DEMOKRITOS, Aghia Paraskevi, 15310 Athens,
7
Greece
8 9
b
Laboratory of Innovative Environmental Technologies, School of Mechanical Engineering, National Technical
10
University of Athens, Zografos Campus, 15710 Athens, Greece
11 12
* Corresponding author:Ioannis.Karathanassis@city.ac.uk (I. K. Karathanassis).
13 14
1 Present address: School of Mathematics, Computer Science & Engineering, City University London,
15
Northampton Square, EC1V 0HB London, UK
16 17 18
Abstract. The design and performance evaluation of a novel parabolic-trough concentrating 19
photovoltaic/thermal (CPVT) system are discussed in the present study. Initially, the system 20
design and manufacturing procedures as well as the characteristics of the system sub-21
components are thoroughly illustrated. At a second stage, the findings in regard to the optical 22
quality of the parabolic trough are presented, as obtained through an experimental procedure 23
that utilizes a custom-made measuring device. The device bears a grid of sensors 24
(photodiodes), so that the irradiation distribution on the receiver surface and the achieved 25
concentration ratio can be determined. Besides, the main factors that have a significant effect 26
on the trough optical quality were identified through ray-tracing simulations. The system 27
electrical and thermal performance was subsequently evaluated in a test rig specially 28
developed for that reason. Three variations of the system receiver incorporating different PV-29
module and heat-sink designs were evaluated and the prototype CPVT system was found to 30
achieve an overall efficiency approximately equal to 50% (44% thermal and 6% electrical 31
efficiencies, respectively) with a very weak dependency on the operating temperature. 32
33
Keywords: optical analysis, ray-tracing, experimental evaluation, parabolic trough, CPVT system
34 35
Nomenclature
36 37
CR concentration ratio
38
Cp specific heat, J/kgK
39
G solar radiation flux, W/m2
40
H height, m
41
I electric current, A
42
k thermal conductivity, W/mK
43
L length, m
44
m mass flow rate, kg/s
45
Pel electrical power, W
46
Qth thermal power, W
47
S length of distortion segment, m
48
Τ temperature, K
49
U uncertainty associated with a value
50
U0 thermal losses coefficient, W/m 2
K
51
ts solid substrate thickness, m
52
W width, m
53
V electric voltage, V
2
tot
V volumetric flow rate
55 56
Greek symbols
57 58
β cell temperature coefficient, %/K
59
γ receiver intercept factor
60
ηel electrical efficiency
61
ηth thermal efficiency
62
ηtot total efficiency
63
η0 optical efficiency
64
θ incidence angle, o
65
ρ reflectance
66
τ transmittance
67 68
Subscripts/Abbreviations
69 70
a aperture, ambient
71
alpha absorption coefficient
72
ave average
73
b beam
74
ch channel
75
CR concentration ratio
76
d diffuse
77
el electrical
78
EVA ethylene-vinyl acetate
79
f fluid
80
in inlet
81
ins insulation
82
max maximum
83
min minimum
84
out outlet
85
PV photovoltaic
86
MPP maximum power point
87
ref reference
88
refl reflector
89
spec specular
90
scat scattered
91
th thermal
92
tot total
93
t tape
94
w wall
95 96
1. Introduction
97 98
The integration of an active cooling system into the receiver of a concentrating photovoltaic 99
(CPV) system, apart from increasing the system electrical efficiency, makes the surplus heat 100
available for utilization in other applications, where heat at temperatures in the range 60-80oC 101
can be exploited, such as water and space heating, (adsorption or desiccant) cooling [1,2] or 102
even desalination though membrane distillation [3,4]. The additional useful, thermal-power 103
output leads to a significant increase of the system overall efficiency, while the reduced, in 104
comparison to a flat-plate solar thermal collector, receiver dimensions render heat losses 105
limited, an additional beneficial feature in terms of system overall efficiency. 106
Cooling is a major concern regarding the design of concentrating photovoltaics, as the 107
integration of a heat dissipating configuration can have a beneficial impact on the system 108
electrical efficiency. A wide variety of cooling configurations that could potentially be suited 109
3
al. [6]. Besides, Micheli et al. [7] focused on the cooling options for concentrating 111
photovoltaics that are made available through micro and nano-technology, such as micro-fins 112
(or micro-channels) configurations, micro heat pipes and the use of carbon nanotube 113
suspension as cooling fluid. Royne and Dey [8] proposed an active cooling system for densely 114
packed cells comprising a grid of impinging jets. An optimization methodology, based on 115
analytical models, was formulated in order to determine the layout and geometrical 116
parameters of the cooling nozzles that maximize the cell electrical output. Barrau et al. [9]
117
proposed a hybrid device that combines the techniques of impingement jets and 118
microchannel-flow for cooling a dense array of solar cells under high concentration. Rahimi 119
et al. [10] experimentally evaluated the performance of a water-cooled silicon cell module. 120
Indoor testing using a solar simulator of 1000 W/m2 showed that the cell power output 121
increased by 30%. 122
The alternative technique of directly immersing a properly insulated PV module into the 123
cooling fluid has also been examined. Han et al [11] conducted a comparative study in terms 124
of optical transmittance and cooling capacity, in order to evaluate the applicability of different 125
fluids for immersion cooling. Besides, Zhu et al. [12] experimentally investigated the cooling 126
effectiveness of direct immersion of a solar cell module under concentrated sunlight 127
(CR=160-200) into a liquid. 128
Few examples of integrated CPVT systems can be found in the open literature. Early 129
studies by Chenlo and Cid [13] and Gibart [14] outlined the manufacturing procedure for 130
prototype linear CPVT systems based on the Fresnel lens and the parabolic reflector 131
technologies, respectively. Rectangular ducts were used to extract surplus heat in both studies. 132
Coventry [15] designed and manufactured a parabolic trough linear CPVT system with a 133
geometrical concentration ratio equal to 37. The receiver comprised an array of custom 134
designed mono-crystalline silicon cells cooled by water flowing inside an aluminium tube. 135
The system achieved thermal and electrical performance equal to 58% and 11%, respectively, 136
for mass flow rates in the range 37.5-42.5 mL/s. Li et al. [16] evaluated the overall 137
performance of a 2m2 prototype linear CPVT system, which used a parabolic reflector to 138
concentrate solar radiation up to 31 suns. Three different types of cells (monocrystalline 139
silicon, “super cells” and GaAs) were tested. The heat sink used for the cooling of the cell 140
array was similar to that reported in [15]. The system employing the GaAs cell array obtained 141
a maximum overall efficiency of 50.6%, with 41.7% and 8.9% attributed to the thermal and 142
electrical efficiency, respectively. 143
Yongfeng et al. [17] performed a separate experimental evaluation for a variation of the 144
system investigated in [16], which achieves a concentration of 10x. The measured efficiency 145
of the GaAs cells was 9.5% and the thermal efficiency of the system was 34%. Rossel et al. 146
[18] manufactured a two-axis tracking 11x CPVT system. The system had an overall aperture 147
area of 3.6 m2 and employed Fresnel reflectors to concentrate irradiation onto a silicon cell 148
module thermally bonded to a water cooled channel. The daily thermal efficiency of the 149
system, without electricity production, was measured higher than 60%. Vivar et al. [19] report 150
the performance evaluation of a Fresnel reflector linear system with concentration ratio 20x. 151
A module of the system resembles a fully sealed case, which encloses two arrays of Fresnel 152
reflectors that concentrate irradiation on two “micro-receivers” consisting of an array of 153
silicon solar cells bonded to cylindrical tubes. Daily measurements established an average 154
overall efficiency of 58% (50% thermal-8% electrical). 155
Chemisana et al. [20] proposed a design for a CPVT system that utilizes a linear Fresnel 156
lens and a CPC (compound parabolic concentrator) as primary and secondary concentrators 157
respectively. The system achieved a maximum concentration of 10x. A typical rectangular 158
channel served as the cooling device with water flow inside it under laminar flow conditions. 159
4
Sonneveld et al. [21]. Fresnel lenses were mounted onto the top glazing of the green house 161
and concentrated the solar irradiation on tracking hollow beams, which were supported by the 162
steel frame of the green house. Silicon solar cells were thermally bonded on the beams and 163
water was circulated through them. Daily performance measurements showed an overall 164
efficiency of 67% (56% thermal and 11% electrical). Nevertheless, the system optical losses 165
(equal to 30%) were excluded from the calculation of the efficiency. 166
Chaabane et al. [22] manufactured a linear CPVT system that comprised an asymmetric 167
compound parabolic reflector and a mono-crystalline silicon solar-cell module thermally 168
bonded to a rectangular duct. The performance evaluation of the system showed that the 169
maximum obtained thermal and electrical efficiencies were equal to 16% and 10%, 170
respectively. Du et al. [23] evaluated the performance of an 8x linear Fresnel reflector system. 171
At the system receiver, a silicon-cell module was bonded to a tube-on-plate heat sink with a 172
U-shaped tube. Hourly measurements illustrated that the system thermal and electrical 173
efficiencies under steady state conditions were approximately equal to 39% and 8% for 174
coolant flow rates larger than 0.035 kg/s. Kribus et al. [24] proposed a miniature point-focus 175
system with aperture area less than 1m2 that used a dish concentrator and high-efficiency, 176
triple-junction cells operating at concentration of 500 suns. Nevertheless, although the system 177
was reported to be under construction, experimental data of the system actual performance 178
have not been published yet. 179
The evaluation of low-concentration, static CPVT systems has also been reported by a 180
number of researchers. Kong et al. [25] manufactured a low concentration static linear CPVT 181
system that employs a Fresnel lens and flat reflectors, as primary and secondary concentrators 182
respectively, with a geometrical concentration ration of 5.7. For a single daily measurement, 183
the system was reported to achieve peak electrical and thermal efficiencies equal to 10% and 184
56%, respectively. Brogren et al. [26] discussed the optical properties of the main components 185
(reflector, glazing cells) comprising a 4x compound parabolic concentrator photovoltaic 186
thermal system. The system optical efficiency was measured to be equal to 71%, while the 187
system electrical and thermal output were measured equal to 330W/m2∙cell area and 188
2300W/m2∙cell area, respectively. 189
Nilsson et al. [27] focused on the annual performance of a static photovoltaic-thermal 190
system employing asymmetrical parabolic concentrators. The annual electrical yield of the 191
system was estimated at 373 kWh/m2 cell area, while the thermal yield was 145 kWh/m2 192
glazed area. Bernardo et al. [28] experimentally evaluated the performance of a low-193
concentrating parabolic CPVT system (CR=7.8). From a thermal performance point of view, 194
the optical efficiency and the heat-loss coefficient of the system were measured equal to 45% 195
and 1.9 W/K∙m2
, respectively. The maximum electrical efficiency was 6.4%. Künnemeyer et 196
al. [29] manufactured a static, low-concentration, V-trough CPVT module comprising four 197
arrays of polycrystalline cells cooled by water flowing inside channels formed by the 198
corrugated reflector frame. The overall efficiency of the system was in the order of 30%. 199
A novel linear Concentrating Photovoltaic Thermal (CPVT) system employing specially 200
designed monocrystalline solar cells and microchannel cooling devices is evaluated in the 201
present study. The main objectives of the study are to illustrate the design procedure and to 202
highlight all the technical challenges associated with the development of a novel, linear-focus 203
CPVT system and furthermore to experimentally evaluate the optical, electrical and thermal 204
efficiencies achieved by the system. Furthermore, the present investigation constitutes a 205
proof-of-concept study of the successful integration of two novel heat-sink configurations 206
developed [30-33] in a prototype CPVT system. Three different system receiver 207
configurations were considered employing different PV modules and cooling devices of 208
different design layouts. In the subsequent sections, the technical specifications and 209
5
first presented, followed by the analysis of the system optical quality and the experimental 211
evaluation of the system electrical and thermal efficiency. 212
213 214
2. Design and manufacturing of the prototype CPVT system
215 216
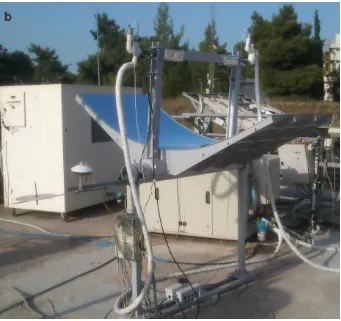
A rigid metallic structure that realizes the parabolic shape of the reflector and supports the 217
receiver at the focal spot has been designed using three-dimensional CAD software (Fig. 1a) 218
and manufactured (Fig. 1b). The structure comprises the frame, onto which the reflecting 219
sheet and the receiver are seated, and the supporting arrangement, consisting of pillars and a 220
circular base that is bolted to the ground. The reflector sheet is bolted on the parabolic profile 221
of the frame, whereas the mounting of the receiver housing allows its translational 222
displacement along the frame brackets, with its final position fixed using screw-nut 223
assemblies. The parabolic profile is supported through metallic ribs mounted on the frame 224
main axle. The supporting arrangement also comprises two axle joints, namely the joint 225
between the main shaft and the supporting pillars and the rotating base discernable at the 226
lower part of Fig. 1a. Hence, the frame can rotate around both the horizontal and vertical axes 227
and thus two-axis tracking of the solar movement is possible. The parabolic frame realizes a 228
concentrator with overall aperture area of 2.0 m2 (active area of 1.0 m2) and a focal length of 229
690 mm. The parabola width and height are equal to 2.0 m and 0.362 m, respectively, while 230
its rim angle is equal to 71.9o. Since the width of the parabolic frame is equal to 2.0m, the 231
CPVT system active and overall aperture areas result equal to 1.0 and 2.0m2, respectively, due 232
to the fact that the active length of the PV module is equal to 0.5m, however the overall length 233
of the receiver has been extended to 1.0m. This has been done, in order to mitigate end effects 234
during the morning and afternoon hours, in the case that single-axis tracking was also 235
considered and furthermore to accommodate the tubing and wiring required within the 236
receiver. The frame was constructed of aluminum in order to make it lightweight and hence 237
facilitate the collector tracking. 238
239
6 241
Fig. 1 Metallic structure of the CPVT system: (a) CAD drawing and (b) constructed frame.
242 243
Commercially available anodized aluminum sheets (MIRO high-reflective 95) by Alanod
244
Solar were used as reflectors. The sheets specular reflectance is approximately equal to 92% 245
[34]. Custom solar cells were developed by Narec Ltd. The cells were manufactured by 246
monocrystalline silicon wafers of thickness equal to 150 μm and the most pronounced 247
difference in their design, compared to conventional cells, is the much higher finger density, 248
as depicted in Fig. 2a. In general mono-crystalline solar cells achieve higher efficiencies than 249
polycrystalline and thin-film cells [35], while they have also been proven as more well suited 250
for concentrating applications of moderate concentration ratio (20<CR<100) [15, 17, 28] than 251
multi-junction III-V cells that require high concentration ratios (CR>200) [36], in order to 252
perform efficiently. 253
Two cell designs were considered having widths of 40.0 mm (“narrow” cells) and 60.0mm 254
(“wide” cells), respectively. The 60.0mm width was dictated by the active width of the 255
employed cooling devices. The additional cell design having width of 40.0mm was 256
considered, in order to examine the effect of the extent of the mismatch between the cell and 257
solar band widths on the PV module electrical performance. The basic dimensions of the solar 258
cells are shown in Fig. 2b and the most pronounced difference compared to a conventional 259
solar cell is the high finger density of the cell front electrical contact. The front contact was 260
optimized by Narec Ltd., which provided the cells, as a compromise between the capability of 261
the cells to handle increased current density due to the concentrated irradiation and the 262
reduction of their active area, since fingers, as metallic surfaces, are highly reflective. The 263
optimization methodology produced the finger arrangement that maximized the cell 264
efficiency. Ten cells were interconnected in series to fabricate a PV module, which comprises 265
a front cover made of low-iron glass, the PV laminate (EVA and solar cells) and a back 266
aluminum substrate. The cells were thermally bonded to the substrate using a thermally 267
conductive, yet electrically insulating, adhesive tape (kt=0.6 W/mK).
[image:7.595.128.469.69.390.2]7 269
[image:8.595.80.511.77.378.2]270 271
Fig. 2 (a) Basic design parameters of the solar cells. (b) The assembled PV module.
272 273
Two plate-fin cooling devices of different layout have been integrated into the system. 274
More specifically the devices comprise two matching, elongated plate-fin heat sinks 275
employing microchannels of either constant (FW configuration) (Fig. 3a)or stepwise-varying 276
width (VW configuration) along three consecutive sections (Fig. 3b), respectively. From a 277
manufacturing/structural point of view the devices fulfill the general criteria of compact and 278
lightweight layout, reliable and leak-proof operation, viz. development of low internal 279
pressure, ease of fabrication using conventional machining and thus low cost and convenient 280
layout for thermal bonding to the solar cell module. The thermal and hydrodynamic 281
performance of the heat sinks has been thoroughly investigated by the authors in [31-33], 282
while their geometrical parameters were determined using the optimization procedure 283
proposed in [30] by also taking into consideration the technical constraints posed by 284
conventional machining processes. 285
It has been verified through the previous studies [31-33] that the FW design (Fig. 3a) 286
obtains very low overall thermal-resistance values due to the large number of surfaces 287
(microchannels) available for heat transfer. The concept behind the design of the VW device 288
is to mitigate the pressure drop penalty, which is a major drawback of microchannel heat-289
sinks, by employing two sections of low-fin density, as depicted in Fig. 3b. The complex 290
secondary flow pattern (longitudinal vortices) that emerges in the first two heat-sink sections 291
due to the effects of geometrical constrictions and buoyancy tends to disrupt the development 292
of the thermal boundary layer, hence increasing the thermal performance of the device despite 293
the subtraction of heat-transfer surfaces. In total, the VW device has been found to achieve a 294
superior hydrodynamic performance compared to the respective FW, with a minor decrease of 295
its thermal performance. Optimal devices in reference to each design have been manufactured 296
employing a multi-objective methodology, based on a genetic algorithm [30].The total heat 297
sink length (500 mm) was dictated by the manufacturing procedure followed using a large-298
8
the rigidity of the device, since a very elongated and slender aluminum device would be prone 300
to significant deformation during the soldering of the top heat sink cover. 301
302 303
304
305 306
Fig. 3 Cooling devices employed in the CPVT system receiver: (a) FW configuration, (b) VW configuration.
[image:9.595.173.423.131.670.2]9
3. Evaluation of the concentrator optical quality
312 313
3.1 Procedures followed for the experimental and numerical evaluation
314 315
An important first step in the present investigation is the measurement of the transversal 316
and longitudinal irradiation flux distribution on the receiver. For this purpose, a measuring 317
device was developed comprising an array of photodiodes properly mounted on the bottom 318
surface of a rectangular hollow beam, as depicted in Fig. 4.The operation of the photodiode 319
is in principal similar to that of a solar cell, in the sense that the current produced is 320
proportional to the irradiation flux (e.g. in W/m2) incident on the sensor aperture. The 321
averaged flux incident on the sensor aperture is converted to signal and hence there is no 322
influence of the irradiation incidence angle on its output. The so-called “cosine losses” [37], 323
an intrinsic feature of non-perpendicular irradiation, corresponding to the radiation 324
attenuation, as the incidence angle increases, has no effect on the accuracy of the flux 325
measurement, since all the rays incident on the sensor aperture contribute to the overall power 326
detected regardless of their angle of incidence. Besides, the suitability of photodiodes for 327
measuring the intensity of concentrated solar irradiation has been demonstrated in a number 328
of studies. Riffelmann et al. [38] and Lüpfert et al. [39] managed to measure the intercept 329
factor and the optical losses of the EUROTROUGH solar-thermal collector prototype using a 330
grid of photodiodes with diffuser filters mounted on a carriage that was positioned along the 331
receiver length with the use of a linear actuator. Pihl and Thapper [40] measured the 332
transversal irradiation distribution on the receiver of a low-concentrating CPVT system using 333
a device comprising a photodiode mounted on a rotating base. Chong and Yew [41] illustrated 334
the manufacturing procedure of a novel flux scanner employing photodiodes. An array of 25 335
photodiodes was mounted on a metallic frame that was able to move along two dimensions, 336
thus producing a grid of measuring points. 337
The sensors are unable to detect the spatial non-uniformity of light irradiance within their 338
active area; consequently a sensor of small size is required, especially when measuring the 339
transversal distribution, which exhibits high variation within a short length. Photodiodes with 340
rectangular aperture (5.4 x 4.3) mm2 were used with tinted glasses as filters, in order to 341
prevent overheating under concentrated sunlight. The tinted glasses also served as light 342
attenuators to ensure that the photodiode response was well below the saturation region. Light 343
collimators were placed on the tinted glasses to cut out the diffuse part of the irradiation so 344
that the photodiode mainly detects the beam component of the light and also to prevent the 345
filters from overheating and rupture. A highly reflective Mylar tape was adhered on the 346
collimators in order to further reduce the heat absorbed by the filters. It was verified that the 347
filters could remain up to three minutes under concentrated sunlight prior to their rupture, 348
which is an adequate time interval to obtain meaningful results regarding the concentration. It 349
must be noted that two variations of the measuring device were developed for measuring the 350
longitudinal and transversal irradiation distributions, respectively. In regard to the 351
longitudinal-measurement configuration, the distance between consecutive sensors was equal 352
to 0.125 m and five photodiodes were placed to cover the entire receiver active length. Filters 353
of circular aperture with diameter of 5.0 cm were placed over the photodiodes. 354
In order to measure the transversal irradiation-flux profile, five photodiodes were housed 355
in holes drilled into an aluminum plate of dimensions 124 x 62 x 5 mm, which was 356
subsequently mounted at the bottom face of the beam. The intermediate distance between 357
sensors was equal to 15.0 mm, with the middle sensor being located exactly and the receiver 358
mid-width. The plate was able to slide along the beam length allowing the measurement of the 359
10
the plate to serve as filter, while the collimator had a narrow slit with width of 8 mm midway 361
along its length. 362
The signal of the photodiodes was measured as current output, which is linearly 363
proportional to the incident light power per unit area. The linear current response of the 364
photodiode in proportion to the incident irradiation flux has been verified by the manufacturer 365
and reported in the product datasheet [42]. The sensor linearity was further examined by 366
retracting the light-attenuating filters from the grid of photodiodes and exposing them to 367
direct sunlight. Excellent linearity of the sensors was verified with a correlation coefficient of 368
0.995. Additional calibration studies were conducted in order to verify that the sensor signal 369
closely followed possible fluctuations of the solar irradiation intensity. The signals of all the 370
sensors employed showed a very good general agreement with the maximum discrepancy 371
detected in both the transversal and longitudinal-measurement configurations being 372
approximately equal to 8% [43]. This value (8%) was used as the experimental uncertainty in 373
the values of the concentration ratio presented and should be primarily attributed to 374
misaligned mounting onto the supporting hollow beam. The concentration ratio CR values 375
were calculated by dividing the output of the photodiodes under concentrated sunlight by the 376
output of a photodiode placed at the upper surface of the device and therefore measuring the 377
direct, one-sun irradiation, as shown in Fig. 4. Irradiation flux values were produced by all the 378
detectors, which can handle both concentrated and parallel light, and thus the CR values could 379
be readily estimated. 380
381 382
Fig. 4 Schematic of the device used for measuring the incident radiation on the system receiver.
383 384
In addition, a ray-tracing analysis was conducted in reference to the designed CPVT 385
system, in order to predict the irradiation profile on the receiver. The analysis was performed 386
with the commercial ray-tracing software TracePro [44], which utilizes the Monte Carlo 387
method to predict the propagation of solar rays. A simplified geometrical model of the CPVT 388
system was created, by omitting the supporting frame and base, and appropriate material 389
properties were assigned to the system reflector and receiver, respectively. The solar 390
irradiation was modeled as a circular sun source where all the radiation originates within a 391
disc of radius 1.25m. The significantly larger sun-source area (≈5m2) compared to the CPVT 392
overall area (2m2) ensured a uniform irradiation flux density on the reflector aperture for a 393
large number of rays. A proper power value was assigned to each ray, in order the overall 394
radiation flux emitted by the source to be equal to the beam radiation measured (in the order 395
11
the irradiation distribution on the receiver surface was considered to be much more significant 397
compared to the effects of sun-shape and circumsolar radiation distribution, which exhibit 398
significant variations depending on the geographical latitude and the time of the year. 399
The system receiver was modeled as a perfect absorber (alpha=1.0), as the focus is on the 400
optical quality of the concentrator. In reference to the parabolic concentrator, two cases were 401
considered, i.e. a perfectly specular mirror and an imperfect mirror that also induces light 402
scattering (non-specular reflectance) due to surface and shape irregularities. In general, both 403
specular and non-specular reflections occur simultaneously to some extent and the term 404
“reflectance” is used for the ability of a material to reflect light in any manner [45]. Light 405
scattering, i.e. widening of the solar band or beam spread has been taken into account in the 406
ray-tracing simulations, in order to approximate the optical performance of the actual 407
(imperfect) concentrator. The significance of light scattering induced by a surface was 408
quantified in the simulations using the Bidirectional Scattering Distribution Function (BSDF), 409
which is defined as the scatter radiance per unit incident irradiance: 410
cos G G BSDF
scat
(1)
411
where Gscat is the scattered irradiation within a solid angle Ω, and θ is the angle between the
412
normal and a scattered ray. By imposing a value of the BSDF function, i.e. the “extent” of 413
imperfections on the concentrator surface, a value of the specular reflectance is calculated by 414
TracePro and the interaction of the incident rays with the imperfect concentrator is 415
subsequently simulated. It becomes evident that the values of the concentrator specular 416
reflectance explicitly corresponds to the extent of light scattering induced. 417
418
3.2 Irradiation-flux distribution on the receiver active surface
419 420
An initial step in regard to the ray-tracing simulations was to conduct numerical tests to 421
confirm that the results produced are independent of the number of rays simulated. For this 422
reason, two benchmark cases were selected for completeness purposes, one for high 423
(ρspec=ρ=0.95) and the other for low (ρspec=0.50, ρtot=0.95) optical quality of the reflector,
424
respectively. The number of simulated rays was gradually increased from 0.5∙106 to 6∙106, in 425
order to illustratethe effect on the values of maximum and average concentration ratio CR, i.e. 426
of the maximum and average irradiation flux on the receiver, as well as on the width of the 427
solar band. The overall emitted irradiation flux was maintained equal to 1.0 kW/m2 in all 428
cases. Table 1 summarizes the variation of the quantities in question for the two cases 429
considered and increasing number of rays. As can be seen from the values of Table 1, the 430
only quantity that exhibits some discrepancy with the number of rays is the maximum 431
concentration ratio. The values of Table 1 corresponding to both cases, in essence, illustrate 432
that the irradiation distribution on the receiver is virtually identical regardless of the number 433
of rays assigned, for a number of rays higher or equal to 2∙106. It was finally decided to 434
produce the results using 2∙106
rays, which were found adequate for obtaining high accuracy 435
and smooth irradiation profiles, within a reasonable simulation time of approximately four 436
[image:12.595.123.476.694.785.2]minutes on an eight-core CPU. 437
Table 1 Effect of the number of simulated rays on the produced irradiation profiles.
438
ρspec=0.95 ρspec=0.50
Rays(∙106) CRmax CRave Wband [mm] CRmax CRave Wband [mm]
0.5 113.4 22.5 62 62.2 14.2 123
12
2 112.5 22.5 62 61.7 14.3 123
4 112.4 22.5 62 61.7 14.3 123
Fig. 5 depicts the irradiation distribution on the receiver for concentrators of perfect 439
parabolic shape and different optical quality with three values (0.95, 0.75, 0.50) being 440
considered for the specular reflectance ρspec. It must be pointed out, that the material (overall)
441
reflectance is equal to 95% in all the cases examined, however the specular reflectance ρspec,
442
reduces according to the BSDF value (see Eq.1) imposed, in order to replicate the effect of 443
light scattering induced due to the reflector surface imperfections. The transversal profile 444
shown in Fig. 5a exhibits a normal (Gaussian) distribution for fully specular reflection 445
(ρspec=0.95). As the percentage of specular reflection decreases to 0.50, i.e. the concentrator
446
optical quality decreases and significant light scattering occurs, on the one hand, the peak 447
value of irradiation flux achieved decreases and, on the other hand, the form of the transversal 448
distribution deviates from the Gaussian distribution. The solar band becomes wider and the 449
profile exhibits plateaus of low concentration values at a distance spanning approximately 450
between 20.0mm and 50.0mm from the receiver mid-with, as depicted on the magnified view 451
of Fig. 5a. The form of the flux longitudinal profile, depicted in Fig. 5b, remains qualitatively 452
unaltered regardless of the value of specular reflectivity. However, as can be clearly seen the 453
concentration achieved at the focal line is approximately reduced by half as the specular 454
reflectivity reduces from 0.95 to 0.50, in accordance to the peak value of the transversal 455
profile. The receiver intercept factor was found to decrease in a linear manner with specular 456
reflectivity meaning that a significant portion of the incoming sunlight on the collector 457
aperture completely misses the receiver in the cases of non-specular reflectance and hence the 458
CPVT system performance degrades. 459
460
[image:13.595.134.457.71.105.2]461 462
Fig. 5 (a) Transversal and (b) longitudinal profiles of the irradiation distribution for concentrators of perfect
463
parabolic shape and different optical quality.
464 465
It was made clear from Fig. 5a thatthe transversal irradiation distribution exhibits a clearly 466
discernible peak at the receiver mid-width, regardless of the optical quality of the 467
concentrator. However, the irradiation measurements revealed a different transversal profile 468
with two regions of high irradiation intensity located on either side of the receiver centerline, 469
while the irradiation at the location where maximum irradiation was expected (receiver mid-470
width), actually exhibited low concentration values. The fact that the profile exhibited 471
(relative) symmetry allowed the conclusion that the characteristic, dual-peak distribution did 472
[image:13.595.78.518.408.603.2]13
during the investigation, the solar irradiation was always perpendicular to the CPVT system 474
aperture and thus there were no optical mechanisms (e.g. cosine or end losses) that could have 475
possibly affected the form of the irradiation distribution on the receiver, which should have a 476
typical Gaussian distribution. Therefore, the “dual-peak” profile must be attributed to the 477
shape quality of the concentrator. An angular deviation of the parabola from its ideal shape, 478
would in essence indicate that the actual focal length is different than the ideal one, e.g. see 479
[45]. However, it has been demonstrated that off-focus operation tends to widen the focal 480
band and produce a smoother irradiation profile. It was postulated that the shape of the 481
parabola was distorted in the sense that the parabola apex was not a single point but instead a 482
flat segment, denoted as S in Fig. 6, resulting in the existence of two focal points. This 483
assumption can be supported by the procedure followed for the construction of the parabolic 484
frame, as the metallic ribs that realize the parabolic shape were manufactured as two separate, 485
symmetrical parts that were subsequently welded on the frame main shaft. The thickness of 486
the welding joints, which are visible at the inset of Fig. 6, is small yet inevitably displaces the 487
symmetrical ribs and distorts the shape of the parabola. Ray-tracing simulations were 488
conducted to illustrate the effect of the distorted parabolic shape on the irradiation profile on 489
the receiver. As was already mentioned, the displacement of the ribs must be small and thus 490
values between 10.0 mm and 40.0 mm were considered as length for the segment S. 491
492
[image:14.595.120.476.346.560.2]493 494
Fig. 6 Distorted form of the reflector parabola due to manufacturing imperfections.
495 496
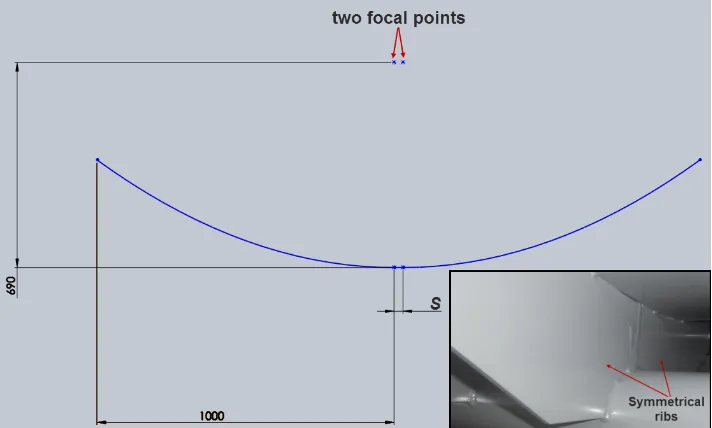
Fig. 7a presents the solar irradiation bands incident on the receiver for incremental 497
geometric distortions of the parabolic concentrators, as produced by the simulations. It can be 498
observed that two illuminated regions on either side of a dark region appear for values of the 499
flat segment length S equal to or larger than 20mm. As the distortion length increases the two 500
peaks shift away from the receiver center-line and the middle dark area becomes wider. In 501
addition, the maximum irradiation intensity is significantly decreased for S=20.0 compared to 502
that for S=10.0 mm. It is therefore made evident that small errors in the shape of the parabola 503
can have a remarkable effect on the reflected radiation distribution. An actual photograph of 504
the receiver under concentrated illumination is presented in Fig. 7b for comparison, where it 505
can be clearly discerned that the center part of the cells remains un-illuminated, while two 506
lines of high concentration are evident on either side of it. A thermal image of the receiver in 507
14
remains cool, while two linear regions, corresponding to the illuminated regions evident in 509
Fig. 7b, of high temperature are evident on both sides of the central region. It can be therefore 510
concluded that the actual irradiation distribution is accurately represented by the ray-tracing 511
simulations. 512
513
514 515
516 517
518
Fig. 7 (a) Solar irradiation bands incident on the receiver for different lengths of the S segment (ρspec=0.95). (b)
519
Actual illumination pattern on the receiver of the CPVT system. (c) Thermal image of the system receiver.
[image:15.595.68.524.151.723.2]15
The “twin-peak” profiles are clearly evident in Fig. 8 for S ≥20.0mm. Despite the profile 522
maintaining a single peak for S=10.0, the maximum concentration is reduced compared to a 523
perfect parabola. An additional observation, which applies for all two-peak cases regardless 524
of the value of specular reflectivity, is that the maximum flux value obtained remains constant 525
and unaffected by the length of the segment S. By comparing Fig. 8 to Fig. 6a, it is made 526
clear that the maximum concentration achieved by a pseudo-parabolic shape having two focal 527
points is approximately half of that achieved by a geometrically perfect parabola. It must also 528
be mentioned that the profiles for each value of S exhibit a similar qualitative form for the 529
three values of specular reflectance considered. 530
Special attention must be given to Fig. 8c, where the concentration values measured across 531
the receiver width at five locations along the receiver active length (Z=0.125, 0.250, 0.375 m) 532
are also presented. It must be pointed out that the ray-tracing results presented correspond to 533
ρspec=0.50, indicating that the concentrator induces significant scattering of the reflected
534
radiation. As can be seen, the experimental points do lie between the predicted profiles for 535
S=30.0 mm and S=40.0 mm, but they clearly follow the same trend, i.e., with alternating 536
regions of low and high concentration. The asymmetry that can be discerned at the points with 537
X=±15.0 mm could be due to displacement of the rib, as it could not be guaranteed that the 538
parabolic frame is perfectly symmetrical. Besides, the measurements at the three longitudinal 539
positions do not coincide, indicating that the parabolic frame is imperfect in a three- 540
dimensional sense. 541
The error in the receiver vertical displacement relative to the exact focal line can also have 542
a considerable effect on the flux distribution. The profile depicted with a red line in Fig. 8c
543
corresponds to a displacement error of 0.73% (f ’=685.0 mm) in the receiver position and a 544
concentrator with distortion S=30.0 mm. It is evident that the profile is noticeably different 545
from the respective case with no displacement error. The profile is in fair agreement with the 546
experimental measurements and it is regarded as the best approximation of the flux profile on 547
the receiver. It is important to point out that the actual deformation of the concentrator is 548
anisotropic in a manner that cannot be predicted. An averaged effect of the surface 549
imperfections was imposed for the ray-tracing simulations through the BSDF values, along 550
with a characteristic deformation attributed to the lateral displacement S. However, the full 551
three-dimensional topology of the trough deformation cannot be captured by the simulations 552
nor the “point” solar-flux measurements. The distinct pattern of regions having low and high 553
illumination, clearly discernible in Figs. 7b-c, is clearly captured by the measurements, as 554
also by the simulations. Furthermore, the numerical and experimental evaluation allowed the 555
estimation of the maximum irradiation flux on the receiver surface, which was demonstrated 556
to be in the order of 25000-30000 W/m2. 557
16 559
560
[image:17.595.72.507.64.474.2]561 562
Fig. 8 Transversal profiles of the irradiation distribution for “distorted” concentrators of different optical quality:
563
(a) ρspec=95%, (b) ρspec=75%, (c) ρspec=50%.
564 565
Fig. 9 presents the longitudinal flux profiles for concentrators of different quality and 566
distortion. The length of the segment S has no effect on the qualitative form of the 567
longitudinal profiles but only affects the flux intensity. The profiles for S≥20.0 mm 568
correspond to the transversal locations on the receiver, where peak concentration is obtained. 569
The experimental values of the flux intensity measured along the receiver active length are 570
also included in Fig. 9b. The length-wise distribution of the flux intensity clearly reveals that 571
the parabolic frame is imperfect in a three-dimensional sense, as the concentration varies 572
along the receiver length as well. The experimental values regarding the first peak are in good 573
agreement with the ray-tracing prediction for ρspec=0.50, S=30.0 mm and f’=685 mm, which,
574
as was also mentioned for the transversal profile, appears to be the most reliable 575
approximation of the actual distribution. On the other hand, the measured flux values 576
corresponding to the second peak are lower than the predicted ones. This discrepancy, which 577
is also evident in Fig. 8c, could be attributed to an increased slope error associated with only 578
the one of the two symmetrical ribs that tends to widen the specific solar band. The slope 579
error could be a result of imprecise manufacturing of the specific rib, but it is far more 580
plausible to assume that the error occurs due to the uneven thickness of the punch-welding 581
joints that bond the aluminum sheet realizing the parabola onto the ribs. As the welding joints 582
17
each rib, they can be identified with great certainty as the main cause of the three-dimensional 584
distortion of the parabolic surface, which consequently leads to a fully three-dimensional 585
pattern of the scattered solar rays on the receiver surface. 586
587
588 589
Fig. 9 Longitudinal profiles of the irradiation distribution for “distorted” concentrators of different optical
590
quality: (a) ρspec=95%, (b) ρspec=50%.
591 592
4. Experimental evaluation of the CPVT system overall performance
593 594
4.1 Description of the experimental setup
595 596
The electrical and thermal performance of the CPVT system was evaluated in an outdoor 597
testing rig specially developed for this purpose (Fig. 10). The experimental setup comprised 598
the electrical and hydraulic circuits, as well as the necessary instrumentation for the 599
measurement of the quantities needed for the characterization of the system overall 600
performance. It is important to point out that the prototype system does not include a storage 601
tank and therefore there is no additional device intervening in the delivery of the thermal 602
power produced to the thermal load. As illustrated by Fig. 10, the produced thermal power is 603
eventually dissipated to the environment through the cooling unit (CU) incorporated in the 604
test rig, which acts as the thermal load for the purposes of the performance evaluation. 605
Direct radiation Gb was calculated by subtracting the diffuse radiation Gd from the total
606
radiation Gtot. For this purpose, two properly calibrated Kipp & Zonen (SMP 11)
607
pyranometers of secondary-standard accuracy [46] were used. One instrument was mounted 608
on the collector frame and tracked the movement of the sun in order to measure the total 609
radiation perpendicularly incident on the collector, while the second was mounted on a static 610
pillar beside the collector and was properly shaded using an appropriate ring manufactured by 611
Kipp & Zonen, so as to detect only the diffuse part of the solar radiation. A properly shaded 612
four-wire Pt100 temperature sensor manufactured by Thies Klima was used for the 613
measurement of ambient temperature. A cup anemometer manufactured by Thies Klima was 614
used for the measurement of the wind velocity. Water flow rate in the hydraulic circuit was 615
measured with a ring piston flow meter manufactured by Aqua Metro. Two four-wire Pt100 616
temperature sensors were used for the measurement of the fluid temperature at the inlet and 617
the outlet of the collector. The temperature at the solid substrate of the PV modules and the 618
heat sinks was measured with the use of type T (copper-constantan) thermocouples 619
[image:18.595.81.515.123.317.2]18
the environment was used as electric load, in order to operate the solar-cell module at the 621
point of maximum power production. The voltage across the module was directly measured 622
by the data logger through additional copper wires soldered to the module leads, so as to 623
avoid any voltage drop in the high current cables. The produced current was converted to 624
voltage through a 1 mΩ shunt resistor and consequently measured by the data logger. The use 625
of an analogue, variable-resistive load was deemed as a reliable and inexpensive solution to 626
measure the I-V curves of the solar-cell modules. The power output of the PV modules for 627
each value of the load, was directly measured by the data logger and thus it is not associated 628
with any error. The operating point of maximum power output was also stored by the data 629
logger. The signals of all instruments were carried to an Agilent 34901A data logger and the 630
measured values were processed and stored to a computer using the Agilent VEE software 631
[47]. Data were logged and stored in a file every five seconds. 632
633
634 635
Fig. 10 Layout of the test rig developed for the evaluation of the system.
636 637
4.2 Experimental uncertainty analysis and propagation of errors
638 639
An uncertainty analysis based on propagation of errors, as described in [48], has been 640
conducted in order to determine the resulting uncertainty of the calculated quantities due to 641
the error associated with the direct measurement of primary quantities. Considering that a 642
result R is calculated from a set of measured quantities xi, RR
x1,x2,x3,...,xi
; then the643
uncertainty in the calculated value is equal to: 644
645
2 1
1
2
N i
i i
R Ux
x R
U (2)
646
where Uxi is the uncertainty associated with the measurement of the values xi. Eq. (2) is valid
647
regardless of whether the measurement uncertainty is given in absolute or relative values. The 648
uncertainty in the values of the measured quantities required for the system characterization 649
are given for a confidence level equal to 95% and summarized in Table 2. In addition, it must 650
be pointed out that the error in the electrical signals directly measured by the data logger was 651
considered negligible, while the uncertainty in the measurements of the solar radiation, the 652
19
calibration procedures performed in the Solar and other Energy Systems Laboratory. The 654
uncertainty associated with quantities deriving from the directly measured ones was 655
calculated by making use of Eq.(2) and are presented in Table 3. 656
[image:20.595.214.379.152.341.2]657 658
Table 2 Uncertainty in measured quantities.
659
Measured quantity Uncertainty U
Vair [m/s] 1.90%
Ta [K] 0.054
Gtot [W/m2] 1.41% Gd [W/m2] 1.41%
tot
V [m3/s] 1.76%
Tf [K] 0.054 K Tw [K] 0.5 K
Vpv [V] -
Ipv [A] -
W [m] 0.025%
L [m] 0.1%
660
Table 3 Uncertainty in calculated quantities.
661
Calculated quantity Uncertainty U
Aa [m2] 0.10%
Gb [W/m2] 1.99%
Qth [W] 2.29%-2.90%-3.46%
Pel [W] -
ηth[-] 3.52%
ηel [-] 2.05%
ηtot [-] 4.06
662 663
4.3 Environmental and operating conditions
664 665
The performance of the integrated CPVT system was assessed for three variations of the 666
system receiver comprising different PV module-heat sink combinations aiming at clearly 667
illustrating the influence of the performance characteristics of receiver constituents on the 668
overall efficiency and possibly designate the most attractive configuration. The efficiency 669
measurements presented in the following paragraphs were performed in the summer and 670
autumn period of 2014 at a latitude of 38o. The direct beam radiation, wind velocity and 671
ambient temperature varied within the ranges 760-970 W/m2, 0-2 m/s and 288-308K 672
respectively, for all the testing sequences. Two-axes tracking of the solar irradiation was 673
realized in all test cases, in order to avoid the effect of cosine and end losses on the 674
performance of the CPVT system. Perpendicular irradiation was verified through the 675
maximization of the output signal of a photodiode placed at the upper surface of the system 676
receiver. 677
678
4.4 Characterization of the PV-modules electrical performance
[image:20.595.169.394.364.487.2]20
An initial stage for the assessment of the modules electrical performance was to determine 681
the IV curves that characterize their operation under concentrated sunlight. For a specified 682
flow rate of the cooling fluid, the system was allowed to reach steady-state conditions and 683
then the value of the external load was gradually varied between its minimum and maximum 684
values (0-6 Ω), so as to cover the entire operating range of the modules. Measurements were 685
taken every 5 s and enough experimental points were obtained within two minutes, in order to 686
derive the I-V curve. Hence, the I-V curve for each module could be obtained for, in essence, 687
a constant irradiation value, constituting the measurement reliable. Fig. 11 presents the 688
experimental points obtained for two PV modules assembled with narrow (Fig. 11a) and wide 689
(Fig. 11b) cells, respectively. The IV curves for one-sun irradiation as resulted from a flash-690
tester measurement (at Tref =25oC) are also included in the figures for comparison. It can be
691
discerned that the modules regardless of the cell design obtained an open circuit voltage VOC
692
approximately equal to 6.2V. However, the module with the wide (60.0mm) cells produced a 693
short circuit current ISC approximately equal to 12A, considerably higher compared to the
694
approximately 9A produced by the module comprising narrow (40.0mm) cells. It is essential 695
to point out that the solar-cell modules under concentrated irradiation has a power output in 696
the order of 55-75W, while the power output for typical solar irradiation is in the order of 3W. 697
The enhanced electrical output of the wide-cell module should be primarily attributed to its 698
larger active area, since the solar band has been significantly widened due to excessive light 699
scattering induced by the concentrator surface imperfections, as was demonstrated in the 700
previous paragraph. 701
702
[image:21.595.73.518.372.570.2]703 704
Fig. 11 IV Curves for (a) the narrow-cell module and (b) the wide-cell module.
705 706
The solar-cell modules were operated under concentrated sunlight without the presence 707
of a heat sink, in order to evaluate the deterioration in their performance due to the elevated 708
temperature. The resistive load was appropriately fixed so that the modules operated close to 709
their maximum power point. The produced electrical power, the module temperature along 710
with the direct solar irradiation and the ambient temperature were recorded at intervals of 3s, 711
in order to keep the overall time period of each testing sequence as short as possible and thus 712
minimize any effect on the results of a possible fluctuation of the environmental conditions or 713
temporary loss of normal incidence. Two type-T thermocouples symmetrically attached to the 714
mid-width of the back substrate were used for the measurement of the module temperature. 715
Fig. 12 shows the relative change in the module performance as a function of the 716
21
slightly different environmental conditions and good repeatability of the measurements was 718
achieved. As made evident by both Figs. 12a and 12b, the expected linear decrease in 719
performance is verified [49]. However, the rate of decrease is steeper in the case of the 720
“narrow” solar cells, which is a clear indication that the “wide” cells are better suited for 721
operation at elevated temperature. The difference in the behavior of the two cell designs can 722
be attributed to the series-resistance value that characterizes each design. According to the 723
values provided by the manufacturer, the series-resistance value is higher for the narrow-cell 724
module, equal to 0.70 Ω instead of 0.49 Ω for the wide-cell module, and by taking in mind 725
that the series-resistance increases linearly with temperature [50], the power dissipation 726
within the module and thus the performance deterioration is more pronounced for the narrow 727
cells.
728 729
[image:22.595.90.505.234.419.2]730 731
Fig. 12 Effect of temperature on the solar-cell module performance: (a) narrow cells, (b) wide cells.
732
733
4.5 Thermal and electrical performance of the CPVT system
734 735
At the present time, there is no official standard available for the performance 736
characterization of CPVT systems [51]. Therefore, and regarding the system thermal 737
performance in particular, the quasi steady-state method [52,53], which applies to 738
concentrating solar thermal collectors, was employed. According to the method, the system 739
efficiency is determined for a set of prescribed operating conditions, while requirements are 740
also posed for the prevailing environmental conditions. The limits regarding the prevailing 741
environmental conditions, as well as the constraints posed on the variation of the main 742
physical quantities, in order for the experimental test to be considered valid are shown in 743
Table 4. 744
The flow rate selected for the measurement of the system thermal efficiency should 745
represent actual operating conditions, while the PV module should be operated at the 746
maximum power point. The time interval required for obtaining an experimental point must 747
be in the order of 3-5 minutes and thus the rotating base of the CPVT system allows the 748
acquisition of a large number of experimental points in each testing sequence, as near-normal 749
incidence can be achieved throughout the entire daylight period, reducing in this way the 750
evaluation time period. 751
752
Table 4 Requirements of the quasi steady-state method.
753
Absolute constrictions
22
Gb >630 W/m2
Gb,max-Gb,min >200 W/m2
θ ≈0ο
Constraintss in variance
Tin 1% or 0.2oC
Tf,out-Tf,in 4% or 0.4oC
m Cp 1%
Gb 4%
Ta 2oC
The maximum electrical output that can be extracted from the PV module is equal to 754
Pel=VMPPIMPP, where VMPP and IMPP are the voltage and current produced by the module when
755
operating at the maximum power point. During the experimental evaluation, operation under 756
maximum power output conditions was verified by adjusting the load resistance accordingly, 757
so as the product of the cell voltage times the produced current to be maximized. It must be 758
mentioned that the device employed is less accurate than a digital MPP tracker, yet much 759
more simple and inexpensive. Besides, the main objective of the present proof-of-concept 760
study is to characterize the CPVT system in terms of overall performance, which will not be 761
affected even if the PV module may not operate exactly at the point of maximum power 762
production, since the irradiation not directly converted to electricity will be instead exploited 763
as thermal power. The system electrical efficiency can be defined as: 764 765 b a MPP MPP el G A I V
(3)
766
767
where Gb is the direct irradiation and Aa is the reflector active aperture. Provided that the
768
system has reached steady-state operating conditions, the thermal efficiency can be calculated 769 as follows: 770 771
b a in , f out , f p b a th th G A T T c m G AQ
(4)
772
773
where m , Tf,in, Tf,out are the specified coolant mass flow rate and temperature at the receiver
774
inlet and outlet, respectively. A linear model is commonly employed for the approximation of 775
the system thermal efficiency as follows [53]: 776 777 b a f th G T T U 0 0
(5)
778
779
where η0is the optical efficiency, namely the efficiency achieved by the system for negligible
780
thermal losses to the environment ̅ the mean coolant temperature in the receiver and U0 is
781
the thermal-loss coefficient. The optical efficiency is correlated to the receiver intercept factor 782
and the properties of the reflector and the receiver materials as follows [37]: 783
784
0 (5)