Theses
Thesis/Dissertation Collections
8-15-2014
The Development of a Performance Assessment
Methodology for Activity Based Intelligence: A
Study of Spatial, Temporal, and Multimodal
Considerations
Christian M. Lewis
Follow this and additional works at:
http://scholarworks.rit.edu/theses
This Thesis is brought to you for free and open access by the Thesis/Dissertation Collections at RIT Scholar Works. It has been accepted for inclusion in Theses by an authorized administrator of RIT Scholar Works. For more information, please [email protected].
Recommended Citation
Multimodal Considerations
by
Christian M. Lewis
B.S. Embry-Riddle Aeronautical University, 2009
A thesis submitted in partial fulfillment of the requirements for the degree of Master of Science in the Chester F. Carlson Center for Imaging Science
College of Science
Rochester Institute of Technology
15 August 2014
Signature of the Author
Accepted by
ROCHESTER INSTITUTE OF TECHNOLOGY ROCHESTER, NEW YORK
CERTIFICATE OF APPROVAL
M.S. DEGREE THESIS
The M.S. Degree Thesis of Christian M. Lewis has been examined and approved by the
thesis committee as satisfactory for the thesis required for the
M.S. degree in Imaging Science
Dr. David Messinger, Thesis Advisor
Dr. Carl Salvaggio
Dr. Derek Walvoord
Guest Member
Date
I, Christian M. Lewis, declare that this thesis titled, ’The Development of a Performance Assessment Methodology for Activity Based Intelligence: A Study of Spatial, Temporal, and Multimodal Considerations’ and the work presented in it are my own. I confirm that:
This work was done wholly or mainly while in candidature for a research degree
at this University.
Where any part of this thesis has previously been submitted for a degree or any
other qualification at this University or any other institution, this has been clearly stated.
Where I have consulted the published work of others, this is always clearly
at-tributed.
Where I have quoted from the work of others, the source is always given. With
the exception of such quotations, this thesis is entirely my own work.
I have acknowledged all main sources of help.
Where the thesis is based on work done by myself jointly with others, I have made
clear exactly what was done by others and what I have contributed myself.
Signed:
Date:
Sun Tzu
Test of a man
“The test of a man is the fight that he makes, The grit that he daily shows, The way he stands upon his feet, And takes life’s numerous bumps and blows. A coward can smile when there’s naught to fear. And noting his progress bars, But it takes a man to stand and cheer, while the other fellow stars. It isn’t the victory after all. But the fight that a Brother makes. A man when driven against the wall, still stands erect, and takes the blows of fate with his head held high, bleeding, bruised, and pale, Is the man who will win and fate defied, For he isn’t afraid to fail.”
An Unknown Author
“We hold these truths to be self-evident, that all men are created equal, that they are endowed by their Creator with certain unalienable Rights, that among these are Life, Liberty and the pursuit of Happiness.”
Declaration of Independnce
Our deepest fear
“Our deepest fear is not that we are inadequate. Our deepest fear is that we are powerful beyond measure. It is our light, not our darkness that most frightens us. We ask our-selves, Who am I to be brilliant, gorgeous, talented, fabulous? Actually, who are you not to be? You are a child of God. Your playing small does not serve the world. There is nothing enlightened about shrinking so that other people won’t feel insecure around you. We are all meant to shine, as children do. We were born to make manifest the glory of God that is within us. It’s not just in some of us; it’s in everyone. And as we let our own light shine, we unconsciously give other people permission to do the same. As we are liberated from our own fear, our presence automatically liberates others.”
I would like to thank all the professors, staff, and my fellow students at RITs Chester F. Carlson Center for Imaging Science, for the amazing and insightful experience I have had throughout this program. I am indebted to those that took the time to provide me valuable tips and guidance through this research process and the writing of this thesis. Their constant encouragement and support gave me the drive to continue exploring avenues of research throughout my experience.
I would also like to thank the members of my committee, Dave Messinger, Carl Salvaggio, and Derek Walvoord for providing me with their insight and knowledge throughout this work. An additional thanks goes to Mike Gartley and Jason Faulring for patiently enduring the multitude of questions related to my data collection and this thesis. My gratitude goes out to the faculty and staff of the Digital Imaging Remote Sensing group and those participants in data collection that made this research feasible.
Completion of this work would not have been possible without the help and support of all those who were always willing to give their time and valuable assistance towards the completion of this thesis. Finally, my sincere thanks and appreciation goes to the United States Air Force for providing me with the opportunity to earn a graduate degree while serving my country. I appreciate the emphasis that our senior leaders have placed on education and hope that this program will continue to provide future officer’s with a similar opportunity.
Above all, my deepest gratitude goes to my family for helping and supporting me through school, as well as to my girlfriend, for her encouragement and patience. Without a doubt, they are the keys to my success.
Multimodal Considerations
by
Christian M. Lewis Submitted to the
Chester F. Carlson Center for Imaging Science in partial fulfillment of the requirements
for the Master of Science Degree at the Rochester Institute of Technology
Abstract
Activity Based Intelligence (ABI) is the derivation of information from a series of in-dividual actions, interactions, and transactions being recorded over a period of time. This usually occurs in Motion imagery and/or Full Motion Video. Due to the growth of unmanned aerial systems technology and the preponderance of mobile video devices, more interest has developed in analyzing people’s actions and interactions in these video streams. Currently only visually subjective quality metrics exist for determining the utility of these data in detecting specific activities. One common misconception is that ABI boils down to a simple resolution problem; more pixels and higher frame rates are better. Increasing resolution simply provides more data, not necessary more informa-tion. As part of this research, an experiment was designed and performed to address this assumption. Nine sensors consisting of four modalities were place on top of the Chester F. Carlson Center for Imaging Science in order to record a group of participants executing a scripted set of activities. The multimodal characteristics include data from the visible, long-wave infrared, multispectral, and polarimetric regimes. The activities the participants were scripted to cover a wide range of spatial and temporal interactions (i.e. walking, jogging, and a group sporting event). As with any large data acquisition, only a subset of this data was analyzed for this research. Specifically, a walking object exchange scenario and simulated RPG. In order to analyze this data, several steps of preparation occurred. The data were spatially and temporally registered; the individual modalities were fused; a tracking algorithm was implemented, and an activity detection algorithm was applied. To develop a performance assessment for these activities a series of spatial and temporal degradations were performed. Upon completion of this work, the ground truth ABI dataset will be released to the community for further analysis.
To the kids on the playground who consistently take the
“you can’ts” and change them into “I did’s”.
To the youth on the streets whose healthy measure of self-doubt
only serves to bolster their drive for success, rather than defeat it.
And to the young men and women who weren’t discouraged by
being raised within a society of two-parent values–without the
accompanying two-parent household;
I dedicate this work to you.
Let this simply serve as inadequate measure
of your capacity for success.
Yours,
Someone who was told he could not succeed . . .
but did anyway
The views expressed in this document are those of the author and do not reflect the official policy or position of the United States Air Force, Department of
Defense, or the United Stated Government.
Declaration of Authorship iii
Acknowledgements v
Abstract vi
Dedication vii
Disclaimer viii
List of Figures xiv
List of Tables xix
Abbreviations xx
Symbols xxii
1 Introduction 1
1.1 Motivation . . . 1
1.2 System Acquisitions . . . 5
1.3 Trade Space . . . 5
1.3.1 Temporal . . . 7
1.3.2 Spatial . . . 7
1.3.3 Multimodal . . . 8
2 Objectives 10 2.1 Problem Statement . . . 10
2.2 Research Objectives . . . 10
2.3 Tasks . . . 14
2.4 Contributions to the Field . . . 14
3 Background 15 3.1 Activity Based Intelligence . . . 15
3.1.1 State of the Field . . . 17
3.2 Quality Metrics . . . 17
3.2.1 General Image Quality Equation (GIQE) . . . 18
3.2.1.1 Ground Sample Distance (GSD) . . . 19
3.2.1.2 Relative Edge Response (RER) . . . 20
3.2.1.3 Overshoot correction (H) . . . 20
3.2.1.4 Noise Gain (G) . . . 21
3.2.1.5 Signal-to-Noise Ratio (SNR) . . . 21
3.2.2 National Image Interpretability Rating Scale (NIIRS) . . . 21
3.2.3 Video NIIRS (VNIIRS) . . . 23
Action vs. Activity Recognition . . . 25
Motion Imagery vs. Full Motion Video . . . 26
3.2.3.1 Spatial Degradations (GSD vs GRD) . . . 26
3.3 Multimodal Trade Space . . . 29
3.3.1 Panchromatic . . . 29
3.3.2 Multispectral . . . 29
3.3.3 Polarimetric . . . 30
3.3.4 Thermal . . . 32
3.3.5 Light Detection and Ranging (LiDAR) . . . 32
3.3.6 Synthetic Aperture Radar (SAR) . . . 33
3.4 Registration . . . 33
3.4.1 Spatial Registration . . . 33
3.4.1.1 Speeded Up Robust Features (SURF) . . . 34
3.4.1.2 Mutual Information Theory . . . 35
3.4.2 Temporal Registration . . . 36
3.5 Data Fusion . . . 36
Pixel Level . . . 37
Feature Level . . . 37
Decision Level . . . 37
3.6 Tracking . . . 37
3.6.1 Target Detection . . . 38
3.6.2 Track Maintenance . . . 38
3.7 Activity Recognition . . . 39
3.8 Programming Languages . . . 40
Python . . . 41
Open source Computer Vision (OpenCV) . . . 41
4 Experiment 42 4.1 Goals and Requirements . . . 42
4.2 Equipment . . . 43
4.2.1 WASP-Lite . . . 43
4.2.2 MAPPS . . . 47
4.2.3 GoPro . . . 48
4.3 Experimental Setup . . . 50
4.3.1 The Scene . . . 50
4.3.3 Fiducials . . . 57
Visible Spectrum Fiducials . . . 61
LWIR Fiducials . . . 61
Fiducials Specifications . . . 61
4.3.4 Synchronizing Equipment Timing . . . 62
4.3.5 Meteorological Conditions . . . 62
4.4 Scenario and Participants . . . 63
4.4.1 Activities . . . 64
4.4.2 Participant Objects . . . 67
4.4.2.1 Simulated Briefcase . . . 67
4.4.2.2 PVC Pipe . . . 69
Laboratory Measurements . . . 69
4.4.2.3 Duffel Bag . . . 71
4.4.2.4 Frisbee . . . 71
4.5 Research Scope . . . 72
5 Methodologies 76 5.1 Flow of Data Processing . . . 76
5.2 Camera Calibration . . . 79
RIT Calibration Cage . . . 79
Australis . . . 80
Sensor Calibration . . . 83
5.3 Video Stabilization . . . 85
5.4 Registration . . . 86
5.4.1 Registration Accuracies . . . 87
5.4.1.1 Temporal Registration . . . 89
5.4.1.2 Spatial Registration . . . 93
5.4.1.3 Registration Budget . . . 94
5.4.2 Temporal Registration . . . 96
5.4.2.1 Light Emitting Diodes (LEDs) . . . 97
5.4.3 Multimodal Considerations . . . 98
5.4.4 Spatial Registration . . . 98
5.4.4.1 Feature Matching . . . 99
5.5 Data Fusion . . . 102
5.5.1 Pixel Level . . . 103
5.5.2 Change Detection . . . 103
5.5.3 Polarimetric Data Fusion . . . 104
5.6 Tracking . . . 105
5.6.1 Target Detection . . . 106
5.6.1.1 Background Modeling . . . 106
5.6.1.2 Foreground Image . . . 107
5.6.1.3 Thresholding . . . 107
5.6.1.4 Filtering . . . 109
5.6.1.5 Morphological Operations . . . 109
5.6.1.6 Connected Components . . . 110
5.6.1.8 Consolidation . . . 112
5.6.2 Track Maintenance . . . 113
5.6.2.1 Munkres Assignment Algorithm . . . 114
5.6.2.2 Manual vs. Automatic Tracking . . . 114
5.6.3 Tracking Results . . . 115
5.7 Activity Recognition . . . 118
5.7.1 Object Exchange . . . 118
5.7.1.1 Band-by-Band Operations . . . 121
Mask Image . . . 121
Bound People Pixels . . . 123
Mean of Pixels . . . 125
5.7.1.2 Person-by-Person Operations . . . 125
Spectral Signature . . . 126
Reference Spectral Signature . . . 126
5.7.1.3 Frame-by-Frame Operations . . . 126
Spectro-Temporal Interpolation . . . 126
Spectral Angle Mapper . . . 128
Filter People by Distance . . . 129
5.7.1.4 Threshold Analysis . . . 129
5.7.1.5 Spatio-Temporal Degradations . . . 129
Spatial Degradations . . . 130
Temporal Degradations . . . 130
5.7.1.6 Likelihood of Detection . . . 131
5.7.2 Detection of Highly Polarized Objects . . . 134
5.7.2.1 Stationary In-Scene Stokes Vector . . . 137
5.7.2.2 Moving In-Scene Masks . . . 138
5.7.2.3 Moving In-Scene Stokes Vector . . . 140
5.7.2.4 Track Association Between Sensors . . . 141
6 Results 142 6.1 Object Exchange . . . 142
6.1.0.5 Filter People by Distance . . . 143
6.1.0.6 Threshold Analysis . . . 144
Assessing the Noise within the Data . . . 146
6.1.0.7 Alternate Methods of Assessing Spectral Angle Data . . . 147
Method of Proportions . . . 147
Method of Angular Difference . . . 147
Method of Sliding Window . . . 148
Method of Standard Deviations . . . 148
6.1.1 Spatial Analysis . . . 149
6.1.2 Temporal Analysis . . . 152
6.1.3 Likelihood Surface . . . 156
6.2 Polarimetric Tipping and Cueing . . . 159
6.2.1 Polarimetric Data Degradations and Likelihood of Detection . . . 163
7 Conclusion 165
7.1 Problem Statement and Research Objectives . . . 165
7.2 Research Tasks . . . 166
7.3 Contributions to the Field . . . 167
8 Future Work 171 Analysis of Other Activities in Dataset . . . 171
Activity-Based Feature Space . . . 172
Bounding Box Sensitivity Study . . . 172
Time to Activity Analysis . . . 172
Temporal Sensitivity Study . . . 172
End-to-End Error Analysis . . . 173
Alternate Methods of Assessing Spectral Angle Data . . . . 173
A IR and Multispectral National Image Interpretability Rating Scales 183
B Spatial Registration Results 186
C Experimental Setup Imagery 191
D Experimental Fiducials 194
E Participant Directions 201
F Activity Analysis Interpolation Results 209
G Normalized Data 212
1.1 Notional ABI Lookup Table . . . 4
1.2 Mapping unknown phenomenology to known phenomenology . . . 6
1.3 ARGUS concept image . . . 8
2.1 Spatio-Temporal Detection Trade Space . . . 11
2.2 Multimodal Detection Trade Space . . . 11
2.3 Notional Algorithm Lookup Table for a Given Activity . . . 13
3.1 Kodak capture of a blooming flower [1] . . . 16
3.2 Bike stunt [2] . . . 16
3.3 Relative Edge Response [3] . . . 20
3.4 Overshoot [3] . . . 20
3.5 National Image Interpretability Rating Scale (NIIRS) [3] . . . 22
3.6 Video National Image Interpretability Rating Scale (NIIRS) [4] . . . 24
3.7 VNIIRS - NIIRS Comparison [4] . . . 25
3.8 Focal Length and FOV [5] . . . 27
3.9 Gating Technique with Two Objects . . . 39
4.1 Wildfire Airborne Sensor Platform (WASP) [6] . . . 43
4.2 WASP Camera Identification [7] . . . 44
4.3 Reflectance Spectra of Background with Filter Centers Indicated by Ver-tical Lines [8–10] . . . 45
4.4 Reflectance Spectra of Pedestrians with Filter Centers Indicated by Ver-tical Lines [8–10] . . . 45
4.5 Multispectral Aerial Passive Polarimeter System (MAPPS) [11] . . . 47
4.6 GoPro Hero 3: Black Edition [12] . . . 48
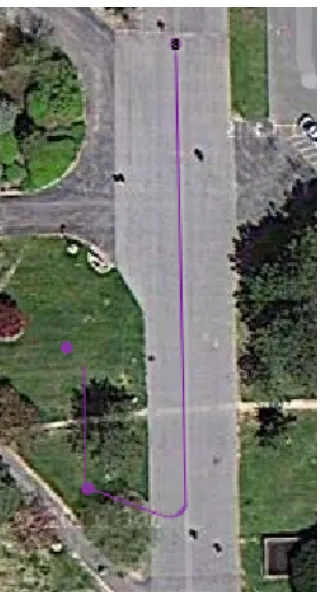
4.7 Top view of experiment scene [13] . . . 50
4.8 Sensor placement within scene . . . 51
4.9 Participant routes within scene . . . 51
4.10 Panchromatic image of scene . . . 53
4.11 GoPro image of scene . . . 53
4.12 Closeup comparison of truck in scene . . . 54
4.13 Experimental setup image 1 . . . 55
4.14 Experimental setup image 6 . . . 55
4.15 Experimental setup image 7 . . . 56
4.16 Experimental setup image 9 . . . 56
4.17 Experimental setup image 10 . . . 57
4.18 MAPPS FOV as seen through panchromatic imager . . . 58
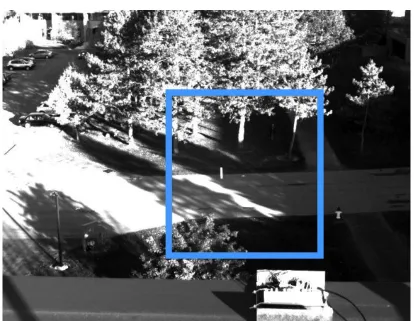
4.19 Panchromatic FOV as seen through LWIR imager . . . 59
4.20 LWIR FOV as seen through GoPro . . . 59
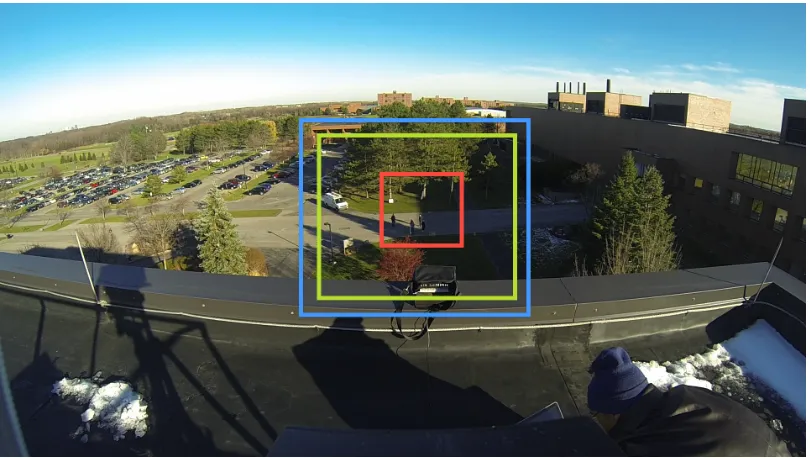
4.21 Platform FOV Overlap. Blue=LWIR FOV; Green=Panchromatic FOV; and Red=MAPPS FOV . . . 60
4.22 Ground Control Points . . . 60
4.23 Fiducial E . . . 61
4.24 Horizon Experiment Sky . . . 63
4.25 Overhead Experiment Sky . . . 63
4.26 Tasking Directions . . . 65
4.27 Simulated briefcase . . . 69
4.28 PVC pipe imagery . . . 70
4.29 Polarimetric Lab Results of Object . . . 70
4.30 Duffel Bag . . . 71
4.31 Frisbee imagery . . . 72
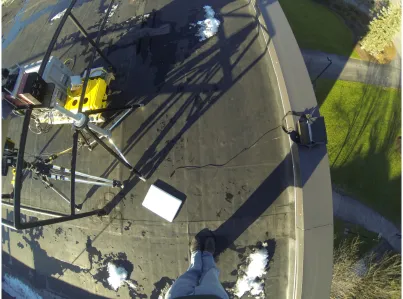
4.32 Oblique view of scene . . . 73
4.33 Top view of scene from Google Maps [13] . . . 73
4.34 Side view of scene . . . 74
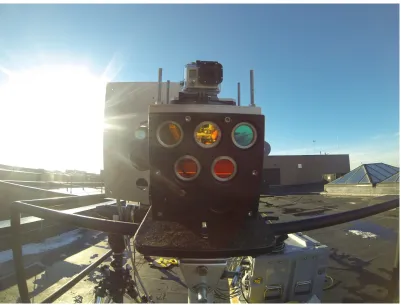
4.35 Back view of sensor setup . . . 74
4.36 Front view of sensor setup . . . 75
4.37 Diagonal view of sensor setup . . . 75
5.1 Processing Flow Diagram . . . 76
5.2 Processing Flow Diagram with Intermediary Steps . . . 78
5.3 RIT Calibration Cage . . . 79
5.4 Digital Version of RIT Calibration Cage . . . 80
5.5 Rotated Digital Version RIT Calibration Cage . . . 81
5.6 Camera Locations using Australis Camera Calibration . . . 81
5.7 Output of Australis Bundle Adjustment . . . 82
5.8 Fisheye lens calibration before and after [14] . . . 83
5.9 Before GoPro Camera Calibration . . . 83
5.10 Original Distortion Correction . . . 84
5.11 After GoPro Camera Calibration . . . 84
5.12 Full Scene Center Closeup . . . 85
5.13 Image Stabilization Flow Diagram . . . 86
5.14 GoPro image of human holding object of interest . . . 88
5.15 WASP-Lite Temporal Registration Error . . . 94
5.16 Registration Budget in Pixels . . . 95
5.17 Registration Budget in frames and cm . . . 95
5.18 Registration Budget in ms and cm . . . 96
5.19 Temporal Data Association . . . 96
5.20 LED Setup . . . 97
5.21 Region of Interest within FOV . . . 99
5.23 Registration results from varying blur kernel sizes. Note, the left contains the entire image from both imagers, whereas the right masks out non-overlapping portions of imagery. The Red and Blue channels were filled with the panchromatic image and the Green channel was filled with the greyscale registered GoPro Image. The titles of each image indicate the
blur kernel size and amount of Sum Square Error (SSE). . . 102
5.24 Multimodal Data Cube . . . 103
5.25 Multiplexed Processing Sequence [11] . . . 104
5.26 Temporal Data Association . . . 105
5.27 Target Detection Flow Diagram . . . 106
5.28 Background of the video sequence . . . 107
5.29 Foreground of first frame in the video sequence . . . 108
5.30 Thresholding of foreground image . . . 108
5.31 Median Filter of threshold image . . . 109
5.32 Morphological Operation of Median Filter . . . 110
5.33 Connected Components of Morphological Image . . . 111
5.34 Centers of identified targets . . . 111
5.35 Consolidate centers of identified targets . . . 112
5.36 Consolidate centers of identified targets . . . 113
5.37 First Frame in Tracked Sequence . . . 115
5.38 Object Exchange in Tracked Sequence . . . 116
5.39 Post Object Exchange in Tracked Sequence . . . 116
5.40 Additional Person in Tracked Sequence . . . 117
5.41 Object Exchange Activity Recognition Flow Diagram; The dotted boxes indicate where the type of operation is performed. The flow begins by taking the threshold image from the target detection workflow as indicated in the upper right hand corner of the figure. . . 120
5.42 Image to be Masked . . . 121
5.43 Image Mask . . . 122
5.44 Masked Image . . . 122
5.45 Inverse Masked Image . . . 123
5.46 Inverse Masked Image with Individuals labeled . . . 124
5.47 Bounding Box Around labeled Person 3 . . . 124
5.48 Bounding Box Around labeled Person 1 with Cluttered Surroundings . . . 125
5.49 Original Mean Digital Counts per Frame for 630µm Imager . . . 127
5.50 Interpolated Mean Digital Counts per Frame overlaid on Original Data . 128 5.51 Polarimetric Tipping and Cueing Flow Diagram . . . 136
5.52 Stationary Polarimetric In-Scene Results of Object . . . 137
5.53 0 and 45 Degree Original and Masked Polar Image . . . 138
5.54 90 and 135 Degree Original and Masked Polar Image . . . 139
5.55 Polarimetric Stationary In-Scene Results of Object . . . 140
6.1 Spectral Angle of All Filtered People . . . 143
6.2 Spectral Angle of Spatially Filtered People . . . 144
6.3 Person 1 Threshold Spectral Angle Before Exchange . . . 145
6.5 Sliding Analysis of Spectral Means . . . 148
6.6 Spectral Angle per GRD (60Hz) . . . 149
6.7 Detection Likelihood per GRD (60Hz) . . . 150
6.8 Spectral Angle per GRD (60Hz) of Individuals in Object Exchange . . . . 150
6.9 Detection Likelihood per GRD (60Hz) of Individuals in Object Exchange 151 6.10 Spectral Angle per GRD (5cm) . . . 153
6.11 Likelihood of Detection per Frame Rate (5cm) . . . 154
6.12 Spectral Angle per Frame Rate (5cm) . . . 155
6.13 Likelihood of Detection per Frame Rate (5cm) . . . 155
6.14 Likelihood Surface - Person 0 (No activity) . . . 156
6.15 Likelihood Surface - Person 1 (Object Exchange) . . . 156
6.16 Likelihood Surface - Person 2 (PVC Pipe) . . . 157
6.17 Likelihood Surface - Person 3 (Object Exchange) . . . 157
6.18 First frame in DoLP Sequence . . . 160
6.19 Full DoLP Image . . . 160
6.20 Close-up of High DoLP Region . . . 161
6.21 Masked Close-up of High DoLP Region . . . 161
6.22 Polarimetric Tip in MAPPS Imagery . . . 162
6.23 GoPro Imagery with DoLP Cue . . . 162
7.1 Task Options Spanning Tree . . . 168
7.2 Object Exchange Lookup Table . . . 170
8.1 Time to Activity Tradespace . . . 173
A.1 NIIRS Rating Scale [15] . . . 184
A.2 IR NIIRS [16] . . . 185
B.1 Multispectral Filter 1 . . . 187
B.2 Multispectral Filter 2 . . . 188
B.3 Multispectral Filter 4 . . . 189
B.4 Multispectral Filter 5 . . . 190
C.1 Experimental Setup Image 2 . . . 191
C.2 Experimental Setup Image 3 . . . 192
C.3 Experimental Setup Image 4 . . . 192
C.4 Experimental Setup Image 5 . . . 193
C.5 Experimental Setup Image 8 . . . 193
D.1 Fiducial B . . . 195
D.2 Fiducial A . . . 195
D.3 Fiducial C . . . 196
D.4 Fiducial D . . . 197
D.5 Fiducial F . . . 197
D.6 Fiducial G . . . 198
D.7 Fiducial H . . . 198
D.9 Fiducial J . . . 199
D.10 Fiducial K . . . 200
E.1 Directions Page 3 . . . 201
E.2 Directions Page 1 . . . 202
E.3 Directions Page 2 . . . 203
E.4 Directions Page 4 . . . 204
E.5 Directions Page 5 . . . 205
E.6 Directions Page 7 . . . 206
E.7 Directions Page 8 . . . 207
E.8 Directions Page 9 . . . 208
F.1 Original Mean Digital Counts per Frame with Zeros Remove . . . 210
F.2 Original Mean Digital Counts per Frame with Zeros Remove . . . 210
F.3 Interpolated Mean Digital Counts per Frame . . . 211
G.1 Normalized data as a function of spatial and temporal degradations page 1213 G.2 Normalized data as a function of spatial and temporal degradations page 2214 G.3 Normalized data as a function of spatial and temporal degradations page 3215 G.4 Normalized data as a function of spatial and temporal degradations page 4216 G.5 Normalized data as a function of spatial and temporal degradations page 5217 G.6 Normalized data as a function of spatial and temporal degradations page 6218 G.7 Normalized data as a function of spatial and temporal degradations page 7219 G.8 Normalized data as a function of spatial and temporal degradations page 8220 H.1 Spectral Angle Mapper Code Page 1 . . . 222
H.2 Spectral Angle Mapper Code Page 2 . . . 223
H.3 Spectral Angle Mapper Code Page 3 . . . 224
H.4 Spectral Angle Mapper Code Page 4 . . . 225
H.5 Spectral Angle Mapper Code Page 5 . . . 226
H.6 Spectral Angle Mapper Code Page 6 . . . 227
H.7 Spectral Angle Mapper Code Page 7 . . . 228
4.1 Experiment Equipment Specs . . . 44
4.2 Panchromatic Camera Specifications [7, 17] . . . 46
4.3 LWIR Camera Specifications [7, 17] . . . 46
4.4 Multispectral Camera Specifications [7, 17] . . . 46
4.5 MAPPS Camera Specifications [11, 18] . . . 47
4.6 GoPro 3 Hero Camera Specifications [19–21] . . . 48
4.7 Experiment Equipment Specifications . . . 49
4.8 Equipment GSDs . . . 52
4.9 Objects in Experiment . . . 54
4.10 Dimensions of In-Scene Fiducials . . . 62
4.11 Activities in the Experiment . . . 68
4.12 Objects in Experiment . . . 72
4.13 Activities Specific to the Scope of this Research . . . 73
5.1 Distortion Coefficients . . . 82
5.2 Temporal Registration Requirements (frames) . . . 92
5.3 Temporal Registration Requirements (ms) . . . 92
5.4 Frame Rates, Frame Count, Step Size, and Skipped Frames . . . 131
6.1 Signal-to-Noise of Spectral Angle Data . . . 147
Remote Sensing
AoI Activity of Interest
DoLP Degreeof LinearPolarization
FOV Field Of View
GCP GroundControl Points
GIQE GeneralImage Quality Equation
GRD GroundResolved Distnace
GSD GroundSampleDistnace
HSI HyperSpectralImaging
IR InfraRed
LiDAR Light Detection And Ranging
LWIR Long Wave InfraRed
MAPPS MultispectralAerial PassivePolarimeterSystem
MSI Multi-Spectral Imaging
NIIRS NationalImageInterpretability Rating Scale
PI Polarimetric Information
SAM SpectralAngleMapper
SSE SumSquareError
VNIIRS VideoNationalImageInterpretability Rating Scale
WASP WildfireAirborneSensingPlaftorm
Computer Vision
FMV Full MotionVideo
MI Motion Imagery
OpenCV Open source Computer Vision
RGB Red GreenBlue
Department of Defense
DoD Departmentof Defense
RPG Rocket PropelledGrenade
Other
CIS Chester F. CarlsonCenter forImaging Science
PVC Polyvinyl Chloride
E entropy J/K
f r frame rate Hz
GSD ground sample distance cm/pix
P probability %
t time s, frames
v velocity m/s
x distance m
Introduction
The intent of this work is to produce a performance assessment methodology for a new research domain known as Activity Based Intelligence (ABI). This performance assessment will consider spatial, temporal, and multimodal characteristics of physical systems when detecting activities of interest.
1.1
Motivation
In today’s intelligence environment, sophisticated sensors are collecting larger volumes of video data over ever increasing ground swaths. The purpose is to image as many objects and actions, over as much time as possible in hopes that this aggregated data can be efficiently analyzed to produce useful information. One drawback to this age of ever expanding data is the need for someone to sift through the data. The increase in both sensors and the number of unmanned aerial systems has produced an explosion of data since 2009. Estimates indicate that each year the military acquires over “24 years’ worth [of video data] if watched continuously” [22–25]. Some have estimated that this information grows at an exponential rate with increases in stored data expected to exceed 1000 exabytes (1 million terabytes) biannually [26]. Military commanders have been cited as saying “We have enough sensors,” but not enough people to analyze the results, “automating the process is essential to managing the data flood” [24]. In some operations, this deluge of data has already led to unfortunate consequences in theatre [27].
This “more is better” misconception is not exclusive to our nation’s military. Generally speaking, in today’s market it is presumed that bigger is better, regardless of where or how the technology will be used. Camera phones provide an example. The “Mega Pixel War” began with the inclusion of cameras in cell phones and has remained the predom-inant quantitative metric for consumers to compare cell phone cameras to one another [28]. More pixels and higher frame rates will produce crisper images and less choppy videos. The increase in pixel count has, among other things, increased the necessary storage, without a noticeable increase in quality for most consumers [29]. To their credit, some consumers have realized that simply increasing spatial and temporal resolutions within their cell phones does not necessarily provide them with more information from their cell phones. Manufacturers have begun to shift their emphasis from placing more pixels in imagery to providing more information from imagery. For example, Google is working on a smart phone capable of performing 3D mapping of its environment [30]. Like the military commanders, some in these emerging markets have begun developing tools to analyze the activities that occur within the data [31]. This is the domain of Activity Based Intelligence.
In 2012 the Director of National Intelligence, James Clapper, indicated that ABI is not something we should be striving for, it should be a way of information gathering that we already do. [32] Further stating that “in addition to predicting actions of the future, we should have the agility and ability to perform real-time tipping and cueing based to current threats. That dynamic ability to respond is what we now call Activity Based Intelligence (ABI)” [32]. In a broad sense, ABI is concerned with the actions, interactions, and transactions of people as they move through a given scene. These activities can be complex multi-actor situations where the actions of individuals and groups are tracked, segmented, characterized, and analyzed for points of interest or as simple as two people passing by one another in an area under surveillance. The premise behind this concept is the ability to automate a series of algorithms to cue analysts towards specific times in video streams where events of interest have occurred.
capturing and the characteristics of the sensor performing the capture. This extends to capturing activities caused by the interactions of multiple targets.
With such a large trade space, it is nearly impossible for individuals to factor in all necessary constraints in order to optimize sensor placement and tasking. As such, part of the intent of this thesis is to learn what these constraints are by developing a common dataset involving both rudimentary and complex interactions between actors and objects in a real-world scene.
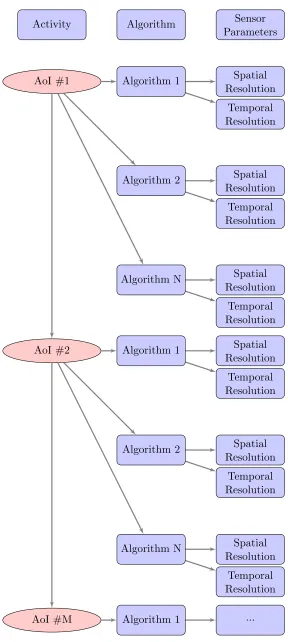
A multi-spatial, multi-temporal, multimodal tradespace will be developed to attempt to parse the problem of activity analysis and yield quantifiable results. This research will also lay the mathematical foundation required to research and develop future remote sensing systems intended for ABI-type missions. Once complete, this performance as-sessment methodology will provide mission planners with a tool to help determine which sensor assets should be utilized when searching for a given Activity of Interest (AoI). This implies mission planners will have access to at least one algorithm to search for each AoI under a variety of sensor requirements. A notional activity lookup table is depicted in Figure 1.1.
AoI #1
Activity Algorithm Sensor Parameters
AoI #2
AoI #M
Algorithm 1
Algorithm 2
Algorithm N
Spatial Resolution
Temporal Resolution
Spatial Resolution
Temporal Resolution
Spatial Resolution
Temporal Resolution
Algorithm 1
Algorithm 2
Algorithm N
Spatial Resolution
Temporal Resolution
Spatial Resolution
Temporal Resolution
Spatial Resolution
Temporal Resolution
[image:27.596.171.459.72.714.2]Algorithm 1 ...
1.2
System Acquisitions
The novelty of the Activity Based Intelligence domain means individuals attempting to solve an ABI task are faced with an unknown phenomenology, but a known physical domain. That being the case, many opt to take a route of transforming the unknown phenomenology into one more familiar. For example, if an aerial platform were searching for a car in an empty parking lot during the day, they need only make some assumptions to develop a tractable problem. The car has a predefined size, high contrast with its background, and can be seen with visible sensors. Now two metrics known as Ground Sampling Distance (GSD) and Signal-to-Noise (SNR) can be guessed and fed into an image quality equation. This will produce a requirement for the type of imaging system necessary to find said target.
However, if you were interested in finding the same car performing donuts or figure eights in the parking lot, then you would not have much to go on because the activity itself is ill-defined. Knowing that it is still a car in the same parking lot would lead you to produce the same metrics and image quality analysis. You may then be tempted toimprovethe previous results to compensate for the unknown of the situation- lower GSD and SNR. That has been the methodology going forward for technological advancements when the implementation of the advancement is not understood. Figure 1.2 graphically depicts this concept in action.
1.3
Trade Space
1.3.1 Temporal
As technology advances, so too does the capability of capturing images at a faster rate. It is certainly possible to continue upgrading sensor platforms with the latest technology such that temporal resolution rates continue to increase without bound. That begs the question, are these platforms watching objects that move at such high speeds, that it justifies the cost of upgrading this system? It is assumed that many activities of interest will involve people and modern day vehicles. Knowing that, it stands to reason that each of these categories has a maximum speed at which it can move. Once a framing system has been developed that can match the speed of the AoI, there should be less motivation to continue increasing temporal resolution.
Furthermore, having high frame rate imaging systems has brought on the well known issue of “big data” [22–25]. Innovative solutions are currently being developed to address this issue, but if the problem that originally spawned it is not curbed, this could grow out of control. There are already more hours of data being produced than will be possible to watch in the lifetimes of our current analysts [23].
A methodical analysis of this trade space is proposed to construct the framework by which future developers can determine the necessary frame rate of new imaging systems.
1.3.2 Spatial
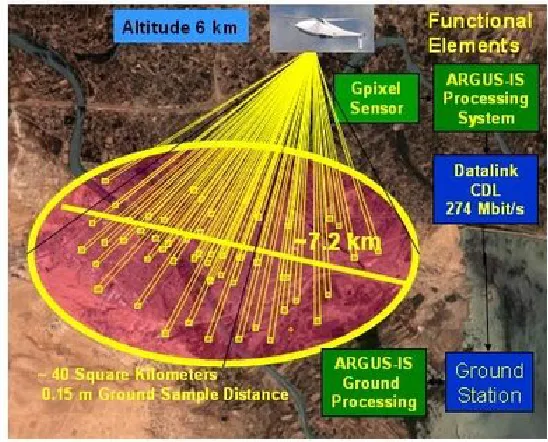
As stated above, consumers of technology may not know how to assess the utility of the technology they use. As with cell phone cameras, they may simply assume more is better [28]. Military and law enforcement are not exceptions. The recent advent of ARGUS, a 1.8 gigapixel DARPA initiative to design a sensor to provide a persistent stare capability across a roughly 40 square kilometer area, has left analysts with the same problem as the preponderance of UAV data; there is too much of it [25]. Figure 1.3 depicts a notional concept of the ARGUS imaging system.
Figure 1.3: ARGUS concept image
This research will provide a methodology of assessing the spatial requirements of such a system that links back to the mission goals.
1.3.3 Multimodal
There are many different types of sensors currently in operation and under development, however there exist no requirements for what types of sensors will be necessary for future intelligence capabilities. Thus far the old adage, “bigger is better” has given the community a myopic view on how and what technologies should be developed for tomorrow [25, 28]. This has left many without a real set of future requirements stemming from the future operational purpose.
If a particular object of interest needed to be tracked utilizing a series of Motion Im-agery (MI) sensor platforms, which platforms should be tasked? Along with that, what would the requirements be if one of those platforms could be incrementally upgraded to perform a specific mission? Part of the reason these questions exist is so the research and development community can have a common focus on the development of future systems.
Objectives
2.1
Problem Statement
Two questions drove this research: Is it possible to utilize a series of multimodal sensors in a semi- or fully- automated fashion to develop intelligence based on the activities within a given scene? If so, can an objective performance assessment be developed to determine if a sensor is capable of detecting specific AoIs in motion imagery?
2.2
Research Objectives
The objectives of this research are twofold: To develop a semi- or fully-automated method of identifying activities within motion imagery, and to produce a performance assessment methodology whereby future researchers can understand the tradespace nec-essary to find specific AoIs in motion imagery.
Each activity recognition algorithm would have an associated “likelihood of detection” graph indicating how it will perform under specific spatio-temporal sensor character-istics; Figure 2.1 depicts this notional concept. For multimodal situations, Figure 2.2 depicts a similar graph that would be used to determine the optimal combination of sensors for detecting the AoI.
Spatial R
esolution
[GSD] (m
)
0 2
4 6
8 10
Temporal Reso
lution (Hz)
0
10 20 30
40 50 60
Pro
ba
bil
ity
of
De
tec
tio
n
0.0
0.2
0.4
0.6
0.8
1.0
Spatial/Temporal Detection Tradespace
Figure 2.1: Spatio-Temporal Detection Trade Space
Pan
Spectral
Thermal
Polar Pan
Spectral
Thermal
Polar
Pro
ba
bil
ity
of
De
tec
tio
n
0.0
0.2
0.4
0.6
0.8
1.0
Multimodal Detection Tradespace
AoI #1 Activit y Algorithm Sensor P arameters En vironmen t Conditions Detection Lik eliho o d Utilit y Decision Algorithm 1 Algorithm 2 Algorithm N Spatial
Resolution Temp
or al Resolution Mo dalities W eather & Illumination Detection Surface Y es/No Spatial
Resolution Temp
2.3
Tasks
Due the unique nature of this work, there exists no dataset which can be used to ac-complish the research. Thus, including designing an experiment there are several steps required to complete the objectives of this research; they are:
1. Design ABI Experiment
2. Camera Calibration
3. Video Stabilization
4. Registration
5. Data Fusion
6. Tracking
7. Activity Recognition
8. Tradespace Development
2.4
Contributions to the Field
There currently exists no method, semi- or fully-automated, whereby activity based intelligence is developed from multi-sensor multimodal data. In addition, while there has been preliminary research into the area of activity based intelligence, there has been no consideration of the possibility of using multimodal data to augment standard visible and panchromatic sensors.
Specific contributions to the field of study will be:
• Development of a multimodal ABI dataset
• An end-to-end ABI evaluation of one activity
• Development of a limited multimodal ABI trade space
Background
3.1
Activity Based Intelligence
Activity Based Intelligence is a developing field, notionally defined as: the inference of information from agent based interactions, occurring in a multi-temporal environment. It is primarily concerned with the actions, interactions, and exchanges of people within a scene of interest. These interactions and exchanges are then used to develop relationships between the individuals in the scene to identify actions and patterns of life.
It should be emphasized that ABI is dependent on the temporal nature of datasets. If you were to take a still photo of a crowd at the mall, it could be difficult or impossible to determine the relationships of entities within the scene. If instead if you were to capture video data, these relationships may become much more apparent. Another important aspect of temporal data is the resolution at which the data is acquired. Using the same mall example, if you took an image a day, you would perceive a very different world than if you were to take an image every hour. The same could be said decreasing from hours to minutes, and even minutes to seconds. Time lapsed photography provides an example of this concept. Figures 3.1 and 3.2 depict two forms of time lapsed photography at different rates. The first is an image of a daylily blooming over a period of 24 hours whereas the second image is that of an individual performing a stunt on a motorized bike likely lasting no longer than several seconds.
Figure 3.1: Kodak capture of a blooming flower [1]
Figure 3.2: Bike stunt [2]
3.1.1 State of the Field
Currently, operational ABI is a manually intensive process whereby analysts sift through large quantities of video data to develop the relationships among the individuals within the scenes. In the context of intelligence, it could be stated that this type of video ana-lytics traces its roots to the days of photo interpretation of images from satellite imaging systems. Analysts were needed to sift through the imagery to determine the state of a nation based on its military assets, infrastructure, and even its crop production. As technology advanced, faster frame rates were possible, leading to what we now call mo-tion imagery or video data. The proliferamo-tion of imaging equipment and video cameras has led to many forms of analysis in attempts to characterize our environment. Ther-mal images of blocks in New York City can be used to determine heat dissipation rates and associated electricity consumption [33]. Also, the advent of social media has led to network-based analysis that relates digital “traffic” to real world events [34]. A recent article in The Economist spoke to the ease of acquiring and launching nanosatellites carrying terrestrial (smartphone) imaging equipment [35]. This proliferation of technol-ogy has led to an explosion of analysis capabilities. The state of the field is constantly evolving.
3.2
Quality Metrics
Quality metrics are used as a method of evaluation to determine the utility of a par-ticular technology to accomplish a task. Some common quality metrics of modern age computing are processing power (CPU clock speed), memory, and graphics capabilities. In cell phones, a set of quality metrics may include camera pixel size, screen resolution, or on-board storage space. In cars, quality metrics of performance may include top speed or torque.
Since the inception of the cell phone camera in the early 2000s, mobile device manufac-turers have engaged in what has been called “the megapixel war” [36]. This competition amongst manufacturers began when increasing the pixel count produced a noticeable improvement in the quality of images from cell phones. As technology improvements allowed manufacturers to place more pixels in cameras, consumers continued to assume that more pixels meant a product was better. The caveat to this trend was yes, more pixels can be better, but only if you need them. The continual improvement of imaging sensor technology and the need for its evaluation led to the development of a quality metric to compare image quality in a more objective manner. This metric was called the General Image Quality Equation (GIQE).
3.2.1 General Image Quality Equation (GIQE)
In order to quantify image quality, a regression-based model was developed using a col-lection of fundamental image and sensor attributes. This general image quality equation (GIQE) utilizes these attributes to produce a numerical rating on what is now known as the National Imagery Interpretability Rating Scale (NIIRS). These attributes are: scale, as expressed via the Ground Sample Distance of the system; sharpness, as measured by the Modulation Transfer Function (MTF) of the image; and Signal-to-Noise (SNR). Leachtenauer, et al developed the analytical form of of NIIRS as
N IIRS = 10.251−alog10GSDGM+blog10RERGM−(0.656·H)−(0.344·G/SN R) (3.1)
3.2.1.1 Ground Sample Distance (GSD)
Ground sampling distance is defined as the smallest distance between points on the ground that is distinguishable by a sensor. It is a geometric relationship using similar triangles that relates the GSD and the pixel pitch through the altitude (Alt) of the sensor and the focal length of the optical train. This relationship is calculated by
GSD
Alt =
p
f (3.2)
where Alt is the altitude of the sensor, p is the pixel pitch, and f is the focal length. If a sensor is looking off nadir, a slant range term R, and corresponding angle, replaces the altitude term as show in equation (3.3)
R=Alt/cosθ (3.3)
whereθrepresents the look angle of the system. Note this works even at nadir as a zero angular extent forces the cosine term to become one, thereby causing the slant range to simply become the altitude. Equation (3.2) represents the case where the sensor is nadir looking and the slant range equals the altitude. However, equation (3.4) is a more accurate representation.
GSD
R =
p
f (3.4)
The geometric GSD is calculated by multiplying the x and y components of the GSD and applying an angular extentαfor non-square focal plane arrays. This is represented in its analytical form as
GSDGM = [GSDX·GSDY ·sinα]
1/2
3.2.1.2 Relative Edge Response (RER)
The relative edge response is a measure of how fast the pixel values change when going from one side of an edge to another. Figure 3.3 depicts this measure.
Figure 3.3: Relative Edge Response [3]
This value (RER) is the slope of the system’s edge response.
3.2.1.3 Overshoot correction (H)
The overshoot-height-based term accounts for the overshoot of the edge-response func-tion due to the Modulafunc-tion Transfer Funcfunc-tion Correcfunc-tion (MTFC) factor. Take Figure 3.4 as an example. Case 1 occurs before the MTFC is applied to the dataset and case 2 after the correction has been applied. Using position 1.5 there is a 0.4 difference in the edge response of the two cases. This overshoot is captured in the overshoot correction term H. This term is measured over a range of 1.0 to 3.0 pixels from the edge in quarter pixel increments.
3.2.1.4 Noise Gain (G)
This term accounts for the noise gain induced by the MTFC and is computed by taking the Root Sum Square (RSS) of the MTFC Kernel as
G=
M
X
i=1
N
X
j=1
(kernalij)2
1/2
(3.6)
3.2.1.5 Signal-to-Noise Ratio (SNR)
The SNR is described as the “ratio of the noise of the dc differential scene radiance to the noise of the rms electrons computed before the MTFC and after calibration.” [3] The analytic form was developed as
SN R=S/N (3.7)
where S is the mean or peak signal of an image and N is the corresponding noise.
3.2.2 National Image Interpretability Rating Scale (NIIRS)
Rating Level 0
Interpretability of the imagery is precluded by obscuration, degradation, or very poor resolution.
Rating Level 1
Detect a medium-sized port facility andyor distinguish be-tween taxiways and runways at a large airfield.
Rating Level 2 Detect large hangars at airfields.
Detect large static radars~e.g., ANyFPS-85, COBRA DANE, PECHORA, HENHOUSE!.
Detect military training areas.
Identify an SA-5 site based on road pattern and overall site configuration.
Detect large buildings at a naval facility~e.g., warehouses, construction halls!.
Detect large buildings~e.g., hospitals, factories!. Rating Level 3
Identify the wing configuration~e.g., straight, swept, delta! of all large aircraft~e.g., 707, CONCORD, BEAR, BLACK-JACK!.
Identify radar and guidance areas at a SAM site by the con-figuration, mounds, and presence of concrete aprons. Detect a helipad by the configuration and markings. Detect the presenceyabsence of support vehicles at a mobile missile base.
Identify a large surface ship in port by type~e.g., cruiser, auxiliary ship, noncombatantymerchant!.
Detect trains or strings of standard rolling stock on railroad tracks~not individual cars!.
Rating Level 4
Identify all large fighters by type~e.g., FENCER, FOXBAT, F-15, F-14!.
Detect the presence of large individual radar antennas~e.g., TALL KING!.
Identify, by general type, tracked vehicles, field artillery, large river crossing equipment, wheeled vehicles when in groups.
Detect an open missile silo door.
Determine the shape of the bow~pointed or bluntyrounded! on a medium-sized submarine~e.g., ROMEO, HAN, Type 209, CHARLIE II, ECHO II, VICTOR IIyIII!.
Identify individual tracks, rail pairs, control towers, switch-ing points in rail yards.
Rating Level 5
Distinguish between a MIDAS and a CANDID by the pres-ence of refueling equipment~e.g., pedestal and wing pod!. Identify radar as vehicle-mounted or trailer-mounted. Identify, by type, deployed tactical SSM systems~e.g., FROG, SS-21, SCUD!.
Distinguish between SS-25 mobile missile TEL and Missile Support Van (MSV) in a known support base, when not cov-ered by camouflage.
Identify TOP STEER or TOP SAIL air surveillance radar on KIROV-, SOVREMENNY-, KIEV-, SLAVA-, MOSKVA-, KARA-, or KRESTA-II-class vessels.
Identify individual rail cars by type~e.g., gondola, flat, box! andyor locomotive by type~e.g., steam, diesel!.
Rating Level 6
Distinguish between models of smallymedium helicopters~e.g., HELIX A from HELIX B from HELIX C, HIND D from HIND E, HAZE A from HAZE B from HAZE C!.
Identify the shape of antennas on EWyGCIyACQ radars as parabolic, parabolic with clipped corners or rectangular. Identify the spare tire on a medium-sized truck. Distinguish between SA-6, SA-11, and SA-17 missile air-frames.
Identify individual launcher covers~8!of vertically launched SA-N-6 on SLAVA-class vessels.
Identify automobiles as sedans or station wagons. Rating Level 7
Identify fitments and fairings on a fighter-sized aircraft~e.g., FULCRUM, FOXHOUND!.
Identify ports, ladders, vents on electronics vans.
Detect the mount for antitank guided missiles~e.g., SAGGER on BMP-1!.
Detect details of the silo door hinging mechanism on Type III-F, III-G, and III-H launch silos and Type III-X launch con-trol silos.
Identify the individual tubes of the RBU on KIROV-, KARA-, KRIVAK-class vessels.
Identify individual rail ties.
Rating Level 8 Identify the rivet lines on bomber aircraft.
Detect horn-shaped and W-shapted antennas mounted atop BACKTRAP and BACKNET radars.
Identify a hand-held SAM~e.g., SA-7y14, REDEYE, STINGER!. Identify joints and welds on a TEL or TELAR.
Detect winch cables on deck-mounted cranes. Identify windshield wipers on a vehicle.
Rating Level 9
Differentiate cross-slot from single slot heads on aircraft skin panel fasteners.
Identify small light-toned ceramic insulators that connect wires of an antenna canopy.
Identify vehicle registration numbers~VRN!on trucks. Identify screws and bolts on missile components. Identify braid of ropes~1 to 3 inches in diameter!. Detect individual spikes in railroad ties.
aThe information in this table was previously published in Ref. 3.
10 November 1997yVol. 36, No. 32yAPPLIED OPTICS 8323
Figure 3.5: National Image Interpretability Rating Scale (NIIRS) [3]
by analysts in this assessment:
• Detection: Identify object from its surroundings
• Classification: target vs. non-target
• Recognition: functional category (i.e. tank)
• Identification: Target is (i.e. this is a M60)
This broad-based categorization works well on traditional imaging systems operating in the visible regime. As a result of its ubiquotous use, NIIRS began to drive R&D of future systems by indicating whether a system would or would not be able to meet a specific imaging need. It also led to a few other NIIRS-esque rating scales specific to other modalities. This includes an IR-NIIRS, a Multispectral NIIRS, and a Video NIIRS. Neither the IR nor the Multispectral NIIRS will be discussed here, but their rating scales are included in appendix A.
3.2.3 Video NIIRS (VNIIRS)
In what appeared to be a natural extension, the still imagery quality metric was ex-panded for use within the multi temporal domain by Young et al [4]. However, by simply evaluating motion imagery (MI) by still imagery metrics, you lose the inherent advantage gained by having a time changing series. Young noted this, saying: “rat-ing motion imagery us“rat-ing only static criteria lacks content validity ... motion imagery exploitation is concerned with timing and sequence of events” [4].
Table 2 Selected V-NIIRS Criteria Frame Rate Requirement (10X Temporal Sampling Rule)
V-NIIRS
V-NIIRS Task V-NIIRS Criteria Object V-NIIRS Criteria Action (implied in italics)
Maneuver/ Event Duration (sec) Minimum Sampling Rate (FPS) (10X Rule)
3 Visually track convoy Driving in formation 2.7 4 4 Visually track tracked vehicles Driving in formation 2.1 5 5 Visually confirm the turret on a main battle tank as the main gun slews during training,
live fire exercise, or combat 1.6 6
6 Visually track an identified vehicle type: car, SUV, van, pickup truck driving independently 1.2 8
7 Visually confirm unidentified deck-borne objects as they are dumped over the side or stern 0.9 11
8 Visually confirm an individual holding a shoulder fired anti-aircraft missile
as the launcher is raised to the aimed
firing position 0.7 14
9 Visually confirm the body & limbs of an individual holding a long rifle or sniper rifle
as the weapon is raised to an aimed firing position -either standing,
sitting, or prone 0.6 18
10 Visually confirm
the hands and forearms of an individual holding a compact assault weapon or
large frame handgun
as the weapon is raised to an aimed firing position -either standing,
sitting, or prone 0.4 23
11 Visually confirm
individual's fingers and hands while aiming a shoulder fired anti tank
missile
as they release safety and arm the
device 0.3 30
2.3 V-NIIRS Criteria Survey Results
A web-based criteria survey was hosted on the Motion Imagery Standards Board (MISB) website from September through December 2008.12 Motion imagery analysis groups were invited to take the survey. Each responder was asked to enter the demographic information such as gender, age and years of experience and other demographic type information as shown in Table 3.
Table 3 Demographic Information Choices
CHOICES GENDER MALE FEMALE
AGE GROUP 18-25 26-35 36-45 46-55 >56
BACKGROUND/ AREA OF EXPERTESE Imagery Analysis Video/Motion Imagery Analysis Geospatial/Topogr aphic Imagery Analysis Other
STILL IMAGERY <1 year 1-3 years 3-6 years 6-10 years > 10 years
MOTION IMAGERY
<1 year 1-3 years 3-6 years 6-10 years > 10 years
SPECIALTY ANALYSIS AREA
Air Forces Cultural / Industrial Missile Forces No one specialty / Does
not apply Ground Forces Naval Forces Electronics / Radars / Comm CURRENT ASSIGNMENT /DUTIES Image Scientist or Engineer/ Developer
Eyes on video/motion imagery analysis/production or
Sensor Operator
Eyes on imagery analysis/ production or Sensor Operator Management/ Administration or non-imagery analysis related Production Supervisor/ Mission Commander Imagery or Video Analysis Instructor Pilot /Aircraft Operator
@#%->(%A( /@)B( ;%+>(CDEC((CDECE FMT
Downloaded From: http://proceedings.spiedigitallibrary.org/ on 08/30/2013 Terms of Use: http://spiedl.org/terms
Figure 3.6: Video National Image Interpretability Rating Scale (NIIRS) [4]
Along with this rating scale, there was an attempt align the NIIRS and VNIIRS criteria. Figure 3.7 depicts this comparison of scales. The VNIIRS system was the first attempt at driving system requirements from the actions of objects and individuals within the scene.
Young also noted that utilizing time series data can lead to advances in spatial recog-nition: “activity discernment can lead to object recognition at spatial resolution levels less than what is required in still imagery.” [4] In fact, he and his co-authors indicated an improvement of object recognition of up to 1/4 of a NIIRS rating [4]. It is currently
being used to assess compression and codecs [37] and is leading to the development of a Motion Image Quality Equation (MIQE) [38, 39].
VNIIIRS defines image quality by asking two questions:
1) Can you classify the objects within the scene?
2) Can you recognize the actions occurring between the objects?
Table 1 Comparison of Selected NIIRS Criteria to V-NIIRS
Convergent validity is the degree to which concepts that should be related theoretically are interrelated in reality.10 The
previous work cited in the above background section lends credence that the V-NIIRS scale has convergent validity because it is organized by increasing spatial resolution and temporal resolution which each have strong theoretical support. For example, adequate temporal sampling prevents motion aliasing. A rule-of-thumb is that at least 10 frames should be taken across the event duration of interest. The required temporal resolution using this rule is shown in Table 2. The table shows how the event duration decreases as the object size decreases. Part of the reason for this is physics. Objects with large mass generally cannot move as fast as smaller objects.
N I I R S NIIRS Criteria Task and Object
NIIRS Criteria Context V-NI IR S V-NIIRS Task and Object V-NIIRS Criteria Object V-NIIRS Criteria Action (implied in
italics)
V-NIIRS Criteria Context
3
Identify a large surface ship by
type.
In port. 3
Visually track the movement of
Convoy of intermediate-range ballistic missile (IRBM) transporter and
support vehicles
Making turn
on an improved road near missile base, launch
site or silo
4 Identify, by general type, tracked vehicles, field artillery, large river crossing equipment when in groups 4
Visually track the movement of
individual, tracked engineering vehicles and
wheeled prime mover/trailer combinations
Making turn
during tactical road march/deployment in
the field or on an unpaved road
5
Distinguish between SS-25 mobile missile TEL and Missile
Support Vans (MSVs)
in a known support base, when not covered by camouflage . 5 Visually confirm the rotation of
the turret on a main battle tank
as the main gun slews during training, live fire
exercise, or combat
at a gunnery range, field deployment site, or battle
zone
6
Identify automobiles as sedans or station
wagons
- 6
Visually track the movement of
an identified vehicle type: car, SUV, van,
pickup truck
driving independently on roadways in medium traffic
7 Identify individual railroad ties - 7
Visually confirm the movement of
unidentified deck-borne objects
as they are dumped over the side or stern
of any surface ship or fishing vessel at sea
8
Identify a hand-held SAM (e.g. SA-7/14, REDEYE, STINGER)
- 8
Visually confirm the movement of
an individual holding a shoulder fired
anti-aircraft missile
as the launcher is raised to the aimed firing
position
in the field, in a defensive position, or in the vicinity of an airfield or airport approaches
9
Identify cargo (e.g. shovels, rakes,
ladders)
in a open-bed, light-duty truck. 9 Visually confirm the movement of
the body & limbs of an individual holding a long
rifle or sniper rifle
as the weapon is raised to an aimed firing position -either standing,
sitting, or prone
At a practice range, during live fire exercise, or during an engagement
.
- - - 10
Visually confirm the movement of
the hands and forearms of an individual holding a compact assault weapon or large frame
handgun
as the weapon is raised to an aimed firing position -either standing,
crouched, or prone
At a practice range, during live fire exercise, or during an engagement
11
Visually confirm the movement of
individual's fingers and hands while aiming a shoulder fired anti tank
missile
as they release safety and arm the device
at a tactical position in a rural or urban
environment
@#%->(%A( /@)B( ;%+>(CDEC((CDECE FMU
Downloaded From: http://proceedings.spiedigitallibrary.org/ on 08/30/2013 Terms of Use: http://spiedl.org/terms
Figure 3.7: VNIIRS - NIIRS Comparison [4]
become worse as time goes on. This rating scale also lacks the novelty of incorporating higher order interactions. It attempts to address the needs of the community for which it was made, by simply extending the previous NIIRS categories into the temporal domain of motion imagery.
Action vs. Activity Recognition Since the word “action” has come up, a
a given sequence, whereas activity recognition is concerned with the interactions that individuals have in the environment and with others in the scene. An example of action recognition would be identifying someone waving their hand, whereas activity recogni-tion would be concerned with the activity of two people saying “hello” by waving their hands.
Motion Imagery vs. Full Motion Video Motion imagery is a term used to
describe any dataset of imagery that was captured at a rate of 1Hz or faster. Historically speaking, Full Motion Video (FMV) has been a subset of motion imagery that operates at frame rates similar to those of televisions; between 24Hz and 60Hz. [40]
3.2.3.1 Spatial Degradations (GSD vs GRD)
In order to discuss the spatial degradations that occurred in this dataset, a distinction between Ground Sampling Distance (GSD) and Ground Resolved Distance (GRD) must first be made. Rearranging Equation (3.4) in terms of GSD
GSD= R·p
f (3.8)
where the slant range, pixel pitch, and focal length are represented by R, p, and f
respectively. By keeping the slant range constant, it is possible to change the GSD by either altering the pitch pitch, focal length, or some combination thereof. Altering the pixel pitch effectively changes the sampling rate at which the detector can physically collect data. Assuming a unity fill factor, decreasing the pixel pitch has the effect of sampling the ground at smaller distances, thereby allowing distinction between smaller objects. Increasing the pixel pitch has the opposite effect of reducing the distinction between objects. For example, with a 5cm GSD, two objects placed 6cm apart are generally distinguishable, whereas the same two objects would not distinguishable if the GSD were changed to 10cm.
of information stipulates that the objects within the scene are occupying more pixels, effectively being sampled more often. Figure 3.8 depicts this concept using 18, 34, and 55mm lenses [5].
Figure 3.8: Focal Length and FOV [5]
3.3
Multimodal Trade Space
There are several modalities that could be exploited to characterize AoI within a given scene. The applicable and available modalities for the problem at hand include: panchro-matic imaging, multispectral imaging, hyperspectral imaging, polarimetric imaging, thermal imaging, Light Detection And Ranging (LiDAR) imaging, and Synthetic Aper-ture Radar (SAR). In the context of this research, each has its own strengths and weaknesses, which will be discussed below. This review is designed to provide a brief overview of each modality in order to evaluate its perceived utility in activity recog-nition. Once chose the modality will be incorporated into an experiment designed to develop the data for this research.
3.3.1 Panchromatic
Panchromatic imaging provides a good basis when working across different modalities for several reasons. Since it integrates across a broad band, the SNR of your imaging system is higher than many other sensing modalities. This increase in SNR can inversely allow for detector designers to decrease the pixel sizes within the detector, thereby increasing the GSD of the sensor. This increase provides a higher spatial resolution, which can make spatial feature detection and multimodal registration a more tractable task. It is, however, its broadband nature that reduces its usefulness in distinguishing unique characteristics of objects within the scene. As RIT currently possesses these capabilities, both in sensor and in simulation, this modality will be included in this research.
3.3.2 Multispectral
Ideally, the more distinction in signatures the more able the tracking algorithm will be to keep targets separate from one another. Thus hyperspectral imaging would be more desirable than multispectral imaging. However, RIT did not have a readily available hyperspectral imager at the time of this research. It has in the past utilized such technology, but the necessary time to acquire and utilize said devices was prohibitive. Therefore, multispectral imaging will suffice.
3.3.3 Polarimetric
Polarimetric imaging provides a method of discriminating objects whose surface and sub-surface reflections cause light to change its orientation relative to its surrounds. This affords ready discernment of manmade objects from natural backgrounds [42]. Other research has shown the ability to perform object classification within a scene [43]. This modality was incorporated into this experiment for its ability to distinguish targets from natural backgrounds and due to its ability to separate objects of differing polarimetric characteristics.
Polarimetric imagery can be developed by placing a polarimetric filter in front of an imaging device. A common configuration is to have a spinning wheel with two, three, or four filters with varying angular filter orientations. Linear filters are created by placing parallel bars of conductive material at close intervals inside of a thin transmissive lens. Orienting the bars horizontally causes them to absorb horizontal electromagnetic (EM) radiation and transmit vertical EM radiation. By controlling the orientation of the filter it is possible to determine if objects in the environment favor a particular orientation. The modified Pickering method combines this orientation information to develop a polarization vector known as the Stokes vector [42]. This is written as
S0=
(E0+E45+E90+E135)
2
S1=E0−E90
S2=E45−E135
S=
S0/S0
S1/S0
S2/S0
= 1 ˜ S1 ˜ S2 (3.10)
withE0throughE135representing the image as seen through the four polarization filters.
The numerical designation is the angle of the polarized filter. S0 represents the total
energy of the image,S1 represents the energy difference between horizontal and vertical
polarization states, andS2 represents the difference between the energy in the 45 degree
and 135 degree states.
A unique aspect of this modality is the ability to fuse multiple polarimetric orienta-tions together to develop more advanced products. Two of these include the Degree of Polarization (DoP) and Degree of Linear Polarization (DoLP) as described by
DoP =
p
S12+S22+S32 S0
(3.11)
DoLP =
p
S2 1 +S22
S0
(3.12)
DoP ≈DoLP =
p
S12+S22 S0
(3.13)
withE0throughE135representing the image as seen through the four polarization filters.
The numerical designation is the angle of the polarized filter. S0 represents the total
energy