Open Access
Research article
Socioeconomic patterns in the use of public and private health
services and equity in health care
Enrique Regidor*, David Martínez, María E Calle, Paloma Astasio,
Paloma Ortega and Vicente Domínguez
Address: Department of Preventive Medicine and Public Health, Universidad Complutense de Madrid, Spain
Email: Enrique Regidor* - enriqueregidor@hotmail.com; David Martínez - davidmartinez@med.ucm.es; María E Calle - mcalle@med.ucm.es; Paloma Astasio - pastasio@med.ucm.es; Paloma Ortega - pomolina@med.ucm.es; Vicente Domínguez - vdrojas@med.ucm.es
* Corresponding author
Abstract
Background: Several studies in wealthy countries suggest that utilization of GP and hospital services, after adjusting for health care need, is equitable or pro-poor, whereas specialist care tends to favour the better off. Horizontal equity in these studies has not been evaluated appropriately, since the use of healthcare services is analysed without distinguishing between public and private services. The purpose of this study is to estimate the relation between socioeconomic position and health services use to determine whether the findings are compatible with the attainment of horizontal equity: equal use of public healthcare services for equal need.
Methods: Data from a sample of 18,837 Spanish subjects were analysed to calculate the percentage of use of public and private general practitioner (GP), specialist and hospital care according to three indicators of socioeconomic position: educational level, social class and income. The percentage ratio was used to estimate the magnitude of the relation between each measure of socioeconomic position and the use of each health service.
Results: After adjusting for age, sex and number of chronic diseases, a gradient was observed in the magnitude of the percentage ratio for public GP visits and hospitalisation: persons in the lowest socioeconomic position were 61–88% more likely to visit public GPs and 39–57% more likely to use public hospitalisation than those in the highest socioeconomic position. In general, the percentage ratio did not show significant socioeconomic differences in the use of public sector specialists. The magnitude of the percentage ratio in the use of the three private services also showed a socioeconomic gradient, but in exactly the opposite direction of the gradient observed in the public services.
Conclusion: These findings show inequity in GP visits and hospitalisations, favouring the lower socioeconomic groups, and equity in the use of the specialist physician. These inequities could represent an overuse of public healthcare services or could be due to the fact that persons in high socioeconomic positions choose to use private health services.
Published: 14 September 2008
BMC Health Services Research 2008, 8:183 doi:10.1186/1472-6963-8-183
Received: 28 March 2008 Accepted: 14 September 2008 This article is available from: http://www.biomedcentral.com/1472-6963/8/183
© 2008 Regidor et al; licensee BioMed Central Ltd.
Background
Research on health services use in wealthy countries with public healthcare systems has yielded similar results. Studies in representative samples of the general popula-tion have found that, after controlling for health status, the probability of consulting a general practitioner (GP) and of hospitalisation either do not vary across income or socioeconomic groups, or is somewhat higher in persons belonging to the lowest socioeconomic groups [1-7]. In contrast, the probability of consulting the specialist physi-cian is greater among higher-income and better-educated groups [1-3,7-9].
Based on these findings, it has been pointed out that these countries are generally characterized by the existence of equity or pro-poor inequity in GP visits and in hospitali-sation, and of pro-rich inequity in visits to specialist phy-sicians [7,10]. However, such judgements cannot be made based on the findings of these studies, since they analyse the use of healthcare services without distinguishing between the use of public and private services. Equity in the use of health services has an ethical dimension based on the social agreement according to which the objective of public healthcare systems, characterised by the exten-sion of coverage to the entire population, is to achieve equal use of health care services for equal need. This is what is known as "horizontal equity" [11]. That is, if we assume an egalitarian distribution and adequate quality of public health resources, equity would be achieved when there is equality in the use of the public health serv-ices by all socioeconomic groups with an equal level of need [12].
Some of the reasons that have been offered to explain the pro-rich inequity in access to specialist services are the existence of complementary private health insurance companies and direct payments for health services [7,10,13]. It is true that private insurance policies make it possible for a certain proportion of the population to use private health services for which there is an alternative in the public health system. Given that persons of high soci-oeconomic position are more likely to have these policies, it has been observed that this situation may reduce equity [7,10,13]. However, there is no evidence that the use of private medical services alters the attainment of equity in the use of public health services [14]. A recent investiga-tion of arthritis care in the United Kingdom showed that the National Health System achieved its equity goal of equal care for equal medical need, even though patients with more education were more likely to have private care [15].
The objective of this work was to estimate the relation between socioeconomic position and health services use in Spain, in order to evaluate whether the findings
obtained are compatible with the achievement of hori-zontal equity. Specifically, we studied socioeconomic pat-terns in the use of three health services offered by the public health system and in the use of these same three services offered by the private sector.
Methods
The data were taken from the 2003 Spanish National Health Survey carried out between April 2003 and March 2004. The data are publicly available accessing to web of Ministry of Health http://www.msc.es/estadEstudios/esta disticas/estadisticas/microdatos/frmBusquedaMicroda tos.jsp. Respondents were selected by stratified multistage sampling of the non-institutionalised population residing in Spain. The first stage units – census sections – were grouped into strata by size of the municipal population and were then selected with a probability proportional to the size of the population of the stratum. The second stage units – households – were selected within each census sec-tion with the same probability by systematic sampling with random start. Within each household one person aged 16 years or older was selected to complete the ques-tionnaire. For the present analysis, we excluded persons older than 74 years because the probability of their being institutionalised increases after that age.
The three health services investigated were GP visits, spe-cialist visits and hospitalisation. About 99.5% of the pop-ulation residing in Spain has some type of public health coverage [16] and therefore has the right to use any of these services of the public health system. Citizens are reg-istered with a public GP who is responsible for delivering primary care and who is the gatekeeper to public second-ary care – specialists or hospitalisation. In general, patients cannot gain access to public secondary care unless referred by a public GP, except in emergencies. Nevertheless, some people use these services in the private sector.
The health survey respondents were interviewed about the frequency of their medical visits. Those who had any med-ical visit in the last 2 weeks were asked if the physician consulted at the most recent visit was a GP or a specialist. They were then asked if the physician whom they had con-sulted was in the public health system, was from a private health insurance company, or was a consultation for which the patient paid directly. In the first case, the GP or specialist visit was considered to be publicly financed, while in the latter two cases the visit was considered to be privately financed
by any type of public health insurance, by any private health insurance or had been paid directly by the patient. In the first case the hospitalisation was considered to be publicly financed, while in the later two cases it was con-sidered to be privately financed. They were also asked about the reason for the last hospital admission: surgery, diagnostic study, medical treatment, birth and others. For purposes of the present analysis we excluded hospital admissions for birth.
All these questions about the use of health services are included in the six national health interview surveys that have been carried out in Spain since 1987. During this period the results observed have been consistent both among the various national surveys and with the results of regional health surveys that have used a modified formu-lation of the questions.
The variables reflecting socioeconomic position were edu-cational level of the respondent, social class of the refer-ence person in the household, and household economic income (table 1) [17]. The non-response rate for the ques-tion on household economic income was 26%. To reduce this percentage, an income value was imputed for non-respondents using a modification of the hot-deck imputa-tion procedure proposed by Cox and Cohen [18]. Follow-ing this procedure, respondents who answered the question on income were classified according to a combi-nation of the following variables: age (in 10-year inter-vals), sex, educational level and social class. The most
frequent value for income in each of these categories was obtained, and was applied to respondents with missing income data who were in the same category after grouping them according to the same variables.
The variable selected to represent the need for health care was the number of chronic diseases reported by respond-ents during the survey. They were asked whether a physi-cian had ever told them they suffered from any of a list of 16 chronic diseases (response categories: yes/no). The replies to these 16 questions were grouped into a single variable with the following four categories: none, 1, 2–3 and 4 or more chronic diseases.
Statistical analysis
[image:3.612.55.556.466.671.2]We first calculated the frequency – in percentage – of the use of each health service – public and private – in each category of the measures of socioeconomic position. We then estimated the magnitude of the association between the measures of socioeconomic position and the use of each health service. For this analysis, binomial regression was used to calculate the percentage ratio, taking the cate-gory that reflected the highest socioeconomic position as the reference group [19]. The variables age, sex and number of chronic diseases were included in the regres-sion models due to their potential confounding effect and/or because they were indicators of the need for care. In Spain, as in most of the developed countries, persons in low socioeconomic position have a higher prevalence of a large variety of chronic diseases than persons in high
Table 1: Definition of the indicators of socioeconomic position used in this study
Education1 Social Class of the person of reference2 Monthly household income3
Tertiary education I–II More than 1800 euros
Second stage of tertiary education Legislators, senior officials and mangers More than 6000 euros
First stage of tertiary education Professionals 3601 to 6000 euros
Technicians and associated professionals 1801 to 3600 euros
Upper secondary education
III 1201 a 1800 euros Lower secondary, or second stage of basic education Clerks
Administrative personnel 901 a 1200 euros
No education or primary education Service and sales workers
Primary education or first stage of basic education Self-employed Up to 900 euros
Pre-primary education Supervisors 601 to 900 euros
No education at all 361 to 600 euros
IV Less than 360 euros
Skilled manual workers
V–VI
Semi-skilled manual workers Unskilled manual workers
1. Based on highest academic diploma received.
2. The question referred to current or last occupation held by the person of reference (the one who contributed the largest income to the household). Occupation was coded according to the 1994 National Classification of Occupations and was assigned to a social class based on the classification of the Spanish Society of Epidemiology17.
socioeconomic position [20,21]. In the case of household economic income, the number of persons residing in the household was also included as a control variable.
Persons in low socioeconomic position showed higher frequency of majority of the chronic diseases, such as hypertension, diabetes, asthma and chronic obstructive pulmonary diseases, heart diseases, stomach ulcer, mus-colo-skeletal problems or hernias. Nevertheless, since some chronic diseases (like allergies) are more frequent in persons in high socioeconomic position, we evaluated the possible interaction between each measure of socioeco-nomic position and the number of chronic diseases. How-ever, the interaction term was not significant in any of these analyses.
An additional analysis was performed to determine if the data source used provided estimates similar to those of previous studies. For this purpose we studied the magni-tude of the association between the measures of socioeco-nomic position and the use of any of these health services, without differentiating between public and private serv-ices.
Results
Some 19.8% of respondents had visited a GP, and 6.9% had seen a specialist in the 2 weeks before the interview, while 7.9% had been admitted to hospital in the preced-ing year. Table 2 shows the frequency of health services
use overall and by socioeconomic position. Most GP con-sultations and almost 90% of hospitalisations were pub-lic, whereas slightly more than one fourth of the specialist visits were made with private financing. The magnitude of the frequency in the use of the public services showed an inverse gradient with socioeconomic position in all three cases, whereas exactly the opposite gradient was seen in the use of private services.
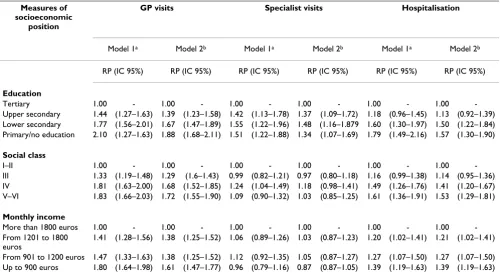
The relation between socioeconomic position and use of public services is presented in table 3 After adjusting for age, sex and number of chronic diseases, a gradient was seen in the percentage ratio for public GP visits and hos-pitalisation, with subjects in the lowest socioeconomic position showing the largest magnitude. The percentage ratio for those in the lowest socioeconomic position ranges between 1.61 and 1.88 for GP visits and between 1.39 and 1.57 for hospitalisation. That is, for persons in the lowest socioeconomic position, the probability of going to a public GP is 61–88% higher than for those in the highest socioeconomic position, while the probability of using public hospitals is 39–57% higher. There were no significant differences in the percentage ratio for the use of public specialists, except in the case of educational level, where higher values were seen for all three categories of less than tertiary education.
[image:4.612.65.556.461.713.2]The percentage ratio in the use of private services showed a gradient in all three cases, with subjects in the highest
Table 2: Sample size, frequency (in percentage) of GP and specialist visits in the 2 weeks before the interview and frequency (in percentage) of hospitalisation during the year before the interview: total and by three indicators of socioeconomic position
Measures of socioeconomic position Sample size GP visits Specialist visits Hospitalisation
Public Private Public Private Public Private
Total 18,837 18.8 1.0 5.0 1.9 6.9 1.0
Education
Tertiary 2,870 9.8 2.4 3.3 4.4 4.1 1.9
Upper secondary 4,335 13.3 1.1 4.4 2.4 4.6 0.9
Lower secondary 3,209 17.1 0.6 5.0 1.1 6.3 0.9
Primary/no education 8,423 26.8 0.4 6.1 1.0 9.8 0.7
Social classa
I–II 3,240 11.5 2.6 4.5 3.6 4.9 2.2
III 4,804 16.5 1.2 4.7 2.6 6.1 1.3
IV 5,665 22.0 0.5 5.7 1.2 7.7 0.6
V–VI 4,846 22.6 0.1 5.1 0.7 8.3 0.4
Monthly incomeb
More than 1800 euros 3,762 11.6 2.1 4.4 3.5 4.8 1.7
From 1201 to 1800 euros 3,756 16.7 0.9 4.8 1.9 5.9 1.2
From 901 to 1200 euros 3,756 18.6 0.6 5.4 1.2 7.1 0.6
Up to 900 euros 6,234 27.8 0.4 5.5 1.0 9.8 0.3
a. No social class could be assigned to 1.5% of those interviewed.
socioeconomic position presenting the greatest magni-tude (table 4). After adjusting for age, sex and number of chronic diseases, the percentage ratio for subjects in the lowest socioeconomic position ranged between 0.03 and 0.11 for GP visits, between 0.16 and 0.24 for specialist vis-its, and between 0.14 and 0.25 for hospitalisation. That is, the probability of persons in the lowest socioeconomic position using a private service was 74–97% lower than for those in the highest socioeconomic position.
When public and private health services use was com-bined, persons in the lowest socioeconomic position had the largest percentage ratio for any GP visit and the small-est percentage ratio for any specialist visit (table 5). In contrast, no significant socioeconomic differences were observed in the percentage ratio for any hospitalisation.
Discussion
Main findingsThe use of public GP and hospital services tends to favour the worst off, which suggests pro-poor horizontal equity in both types of health services while, in general, no soci-oeconomic differences were found in the use of public specialist care, which suggests horizontal equity in this health service. Persons in high socioeconomic position make more frequent use of private services.
Study limitations
Our findings with regard to health services use when no distinction was made between private and public services are similar to the results of other investigations in the gen-eral population in Spain, which supports the validity of the data source used [5,7,22]. The similarity of the find-ings for all three indicators of socioeconomic position supports the validity of the variable economic income, which was imputed for one fifth of respondents as a func-tion of other variables.
The evaluation of equity in health services use requires knowledge of both the supply and quality of public health services, however, this study offers no information about these characteristics. It might be suggested that disadvan-taged areas have a more limited supply of public health services, as some authors have noted [23]. However, a pre-vious study found no differences in the use of public health services by per capita income of the area of resi-dence [24]. Furthermore, our results in persons of low socioeconomic position, who are concentrated in these areas, suggest that this is not so.
[image:5.612.56.556.110.387.2]One indicator of the quality of public health services is the level of use of private services. The results shown in table 1 suggest that most of the population supports the public
Table 3: Use of public health services by three indicators of socioeconomic position. Percentage ratio (RP) and 95% confidence interval (CI)
Measures of socioeconomic
position
GP visits Specialist visits Hospitalisation
Model 1a Model 2b Model 1a Model 2b Model 1a Model 2b
RP (IC 95%) RP (IC 95%) RP (IC 95%) RP (IC 95%) RP (IC 95%) RP (IC 95%)
Education
Tertiary 1.00 - 1.00 - 1.00 - 1.00 - 1.00 - 1.00
-Upper secondary 1.44 (1.27–1.63) 1.39 (1.23–1.58) 1.42 (1.13–1.78) 1.37 (1.09–1.72) 1.18 (0.96–1.45) 1.13 (0.92–1.39)
Lower secondary 1.77 (1.56–2.01) 1.67 (1.47–1.89) 1.55 (1.22–1.96) 1.48 (1.16–1.879 1.60 (1.30–1.97) 1.50 (1.22–1.84)
Primary/no education 2.10 (1.27–1.63) 1.88 (1.68–2.11) 1.51 (1.22–1.88) 1.34 (1.07–1.69) 1.79 (1.49–2.16) 1.57 (1.30–1.90)
Social class
I–II 1.00 - 1.00 - 1.00 - 1.00 - 1.00 - 1.00
-III 1.33 (1.19–1.48) 1.29 (1.6–1.43) 0.99 (0.82–1.21) 0.97 (0.80–1.18) 1.16 (0.99–1.38) 1.14 (0.95–1.36)
IV 1.81 (1.63–2.00) 1.68 (1.52–1.85) 1.24 (1.04–1.49) 1.18 (0.98–1.41) 1.49 (1.26–1.76) 1.41 (1.20–1.67)
V–VI 1.83 (1.66–2.03) 1.72 (1.55–1.90) 1.09 (0.90–1.32) 1.03 (0.85–1.25) 1.61 (1.36–1.91) 1.53 (1.29–1.81)
Monthly income
More than 1800 euros 1.00 - 1.00 - 1.00 - 1.00 - 1.00 - 1.00
-From 1201 to 1800 euros
1.41 (1.28–1.56) 1.38 (1.25–1.52) 1.06 (0.89–1.26) 1.03 (0.87–1.23) 1.20 (1.02–1.41) 1.21 (1.02–1.41)
From 901 to 1200 euros 1.47 (1.33–1.63) 1.38 (1.25–1.52) 1.12 (0.92–1.35) 1.05 (0.87–1.27) 1.27 (1.07–1.50) 1.27 (1.07–1.50)
Up to 900 euros 1.80 (1.64–1.98) 1.61 (1.47–1.77) 0.96 (0.79–1.16) 0.87 (0.87–1.05) 1.39 (1.19–1.63) 1.39 (1.19–1.63)
a. Adjusted for age and sex
system: although 28% of the specialist consults are pri-vate, only 5% of the GP consults and 13% of hospitalisa-tions were made with private financing. These results
[image:6.612.57.557.109.387.2]reflect the opinion of the Spanish population about the quality of the public and private health systems. Accord-ing to the most recent health opinion survey, 70% of
Table 4: Use of private health services by three indicators of socioeconomic position. Percentage ratio (RP) and 95% confidence interval (CI)
Measures of socioeconomic position
GP Specialist Hospitalisation
Model 1a Model 2b Model 1a Model 2b Model 1a Model 2b
RP (IC 95%) RP (IC 95%) RP (IC 95%) RP (IC 95%) RP (IC 95%) RP (IC 95%)
Education
Tertiary 1.00 - 1.00 - 1.00 - 1.00 - 1.00 - 1.00
-Upper secondary 0.49 (0.34–0.68) 0.48 (0.34–0.67) 0.58 (0.45–0.73) 0.56 (0.44–0.71) 0.55 (0.38–0.80) 0.54 (0.37–0.79)
Lower secondary 0.25 (0.16–0.40) 0.24 (0.15–0.39) 0.26 (0.19–0.37) 0.25 (0.18–0.25) 0.49 (0.32–0.74) 0.47 (0.30–0.71)
Primary/no education 0.12 (0.08–0.18) 0.11 (0.07–0.17) 0.18 (0.14–0.24) 0.16 (0.12–0.22) 0.28 (0.19–0.42) 0.25 (0.17–0.38)
Social class
I–II 1.00 - 1.00 - 1.00 - 1.00 - 1.00 - 1.00
-III 0.45 (0.32–0.62) 0.44 (0.32–0.62) 0.74 (0.58–0.94) 0.73 (0.57–0.92) 0.58 (0.42–0.81) 0.56 (0.41–0.80)
IV 0.21 (0.14–0.31) 0.20 (0.14–0.31) 0.33 (0.25–0.44) 0.32 (0.23–0.41) 0.25 (0.16–0.37) 0.24 (0.16–0.36)
V–VI 0.03 (0.01–0.09) 0.03 (0.01–0.08) 0.21 (0.14–0.30) 0.20 (0.14–0.29) 0.20 (0.13–0.33) 0.19 (0.12–0.31)
Monthly income
More than 1800 euros 1.00 - 1.00 - 1.00 - 1.00 - 1.00 - 1.00
-From 1201 to 1800 euros
0.42 (0.30–0.59) 0.42 (0.30–0.59) 0.56 (0.44–0.71) 0.55 (0.44–0.70) 0.64 (0.47–0.88) 0.63 (0.46–0.87)
From 901 to 1200 euros 0.25 (0.16–0.39) 0.24 (0.15–0.38) 0.35 (0.26–0.48) 0.34 (0.25–0.47) 0.30 (0.19–0.48) 0.29 (0.18–0.46)
Up to 900 euros 0.11 (0.06–0.18) 0.10 (0.06–0.18) 0.26 (0.19–0.36) 0.24 (0.17–0.34) 0.16 (0.09–0.27) 0.14 (0.09–0.25)
a. Adjusted for age and sex
b. Adjusted for age, sex, and number of chronic diseases. In monthly income, also adjusted for number of members in household.
Table 5: Use of any health service (public or private) by three indicators of socioeconomic position. Percentage ratio (PR) and 95% confidence interval (CI)
Measures of socioeconomic position GP visits Specialist visits Hospitalisation
PRa (IC 95%) PRa (IC 95%) PRa (IC 95%)
Education
Tertiary 1.00 - 1.00 - 1.00
-Upper secondary 1.21 (1.08–1.35) 0.90 (0.77–1.06) 0.95 (0.79–1.13)
Lower secondary 1.38 (1.23–1.54) 0.77 (0.64–0.91) 1.18 (0.98–1.41)
Primary/no education 1.52 (1.37–1.68) 0.66 (0.57–0.77) 1.16 (0.99–1.37)
Social class
I–II 1.00 - 1.00 - 1.00
-III 1.14 (1.03–1.25) 0.85 (0.73–0.99) 0.96 (0.82–1.12)
IV 1.42 (1.30–1.55) 0.79 (0.69–0.91) 1.06 (0.92–1.22)
V–VI 1.43 (1.30–1.56) 0.67 (0.57–0.78) 1.12 (0.97–1.30)
Monthly income
More than 1800 euros 1.00 - 1.00 - 1.00
-From 1201 to 1800 euros 1.24 (1.13–1.35) 0.81 (0.50–0.68) 1.05 (0.91–1.21)
From 901 to 1200 euros 1.21 (1.11–1.33) 0.72 (0.63–0.85) 1.01 (0.87–1.18)
Up to 900 euros 1.39 (1.27–1.51) 0.58 (0.71–0.93) 1.06 (0.92–1.22)
[image:6.612.57.553.503.719.2]Spaniards would choose the private system based on con-siderations of how rapidly patients receive care, and 80% would choose the public system if the decision is based on the availability of medical technology and the quality of physician training [25].
Possible explanations
About 14% of the Spanish population has complemen-tary private health insurance; this proportion ranges from 5–8% for persons in the lowest socioeconomic position to 27–28% for those in the highest, depending on the indi-cator of socioeconomic position used [16]. These data, together with the different economic ability to pay directly for medical services, may explain why the use of private medical care is more frequent in persons of high socioeco-nomic position. The similarity of the socioecosocioeco-nomic gra-dient for the three health services studied supports the idea that complementary private insurance and/or direct payments would not themselves be responsible for the socioeconomic pattern observed when private and public specialist visits are studied together. This pattern probably reflects the larger proportion represented by the use of pri-vate services in the case of specialist care.
Our results regarding public GP visits and hospital admis-sions could be attributed to residual confounding due to the lack of adequate measures of the need for care. How-ever, little change was seen when we added a variable that reflects limitation of activity due to health problems (data not shown). Van Doorslaer et al also found that inclusion of a much larger battery of health measures had little effect on the relation between income and health services use [5,7].
Factors other than the existence of a health problem may be influencing the demand for public GP services, such as patients' search for solutions to social and economic problems or their need for information about bureau-cratic procedures to access the public health system [26]. That is, part of the use of the public GP by persons in low socioeconomic position may be unnecessary from the health point of view.
In contrast, the findings about public hospitalisation are surprising, since the decision to hospitalise a patient depends more on the physician's recommendation than on the patient's demand. This socioeconomic gradient in public hospital admissions may be due to the opposite socioeconomic gradient observed in private hospital admissions. Persons in high socioeconomic position probably have a lower frequency of public admission because a large proportion choose private admissions.
GPs in the public sector resolve many of their patients' health problems, and this may have contributed to the
lack of socioeconomic differences in the frequency of vis-its to public sector specialists according to social class or income. Nevertheless, this lack of socioeconomic differ-ences is probably due to the large proportion of persons who use private specialist care, not only among persons in high socioeconomic position, but in all socioeconomic groups. In the case of persons with higher educational level, the frequency of use of private specialists is very high: almost three-fifths of consultations. The large pro-portion of persons in this group who choose private spe-cialist care would explain why the rest of the categories of educational level have a significantly higher frequency of visits to specialist physicians in the public system.
When all visits to the specialist physician are taken into account (table 5), the percentage ratio in persons in the lowest socioeconomic position versus those in the highest socioeconomic position ranges between 0.58 and 0.67. This lower use of specialist physician services by persons in low socioeconomic position may be related with insuf-ficient resources to meet the demand in the public health system, or with long waiting times for specialist physician visits in the public system, or with other reasons unrelated to the supply of services and performance of the public health system. This finding raises important ethical and policy dilemmas. Indeed, based on these results, can we consider that the higher frequency of specialist physician visits among persons with higher income means there is social inequality in specialist visits in Spain? Or must we take into account the amount of resources and perform-ance of the public health system before making a moral judgment in this matter? And if it turns out that the public system has sufficient resources and performs adequately, should the higher frequency of specialist physician visits in subjects with higher income be a source of concern in health policy?
UK citizens have also been found to rate the quality of the public healthcare system as low due to long waiting lists [28]. But this evaluation does not mean that it is rational from the health point of view and, even less, from the standpoint of assignment of public resources. For some authors, many of the deficiencies attributed to the public system are related with other factors, such as refusal of the public and the mass media to accept that the health sys-tem can resolve or improve many health problems but is less effective in dealing with others, or the naivety of thinking that the interests of medical professionals will necessarily always coincide with those of the public [29].
In any event, no UK population group can be identified that uses only private medical services for which there is an alternative in the NHS [30]. The situation is similar in Spain, given the small proportion of the population that uses private GPs and hospitals. The low use of private GPs may be due to their relative lack in private practice in gen-eral medicine and to the fact that health insurance compa-nies allow direct access to specialists. With regard to private hospitalisation, its low use may be due to the fact that half of public hospital admissions are made via the emergency service [16], which allows patients to avoid the waiting time of programmed admissions. Furthermore, private hospitalisation is used for less serious elective admissions because high-technology care is concentred in the public sector [26].
Conclusion
In summary, based on the definition of horizontal equity as "equal use for equal need", this study demonstrates the existence of inequity in GP visits and hospitalisation, favouring the lower socioeconomic groups, and equity in the use of the specialist physician. Future studies should aim to determine to what extent this inequity represents an overuse of public healthcare services or is due to per-sons of high socioeconomic position choosing to use pri-vate healthcare services.
Competing interests
The authors declare that they have no competing interests.
Authors' contributions
ER originated the study. DM and MEC contributed to the analysis of this study. PA, PO, and VD contributed to the drafting of the paper. ER coordinated the writing of the article. All authors contributed to the final version of the article. All authors read and approved the final manu-script. ER is the the guarantor of the article.
References
1. Roos NP, Mustard CA: Variation in health and health care use by socioeconomic status in Winnipeg, Canada. Milbank Quar-terly 1997, 75:89-111.
2. Finkelstein MM: Do factors other than need determine utiliza-tion of physician services in Ontario? CMAJ 2001, 165:565-570.
3. Heyden S Van Der, Demarest J, Tafforeau H, Van Oyen H: Socio-economic differences in the utilization of health services in Belgium. Health Policy 2003, 65:153-165.
4. Sutton M, Gravelle H, Morris S, Leyland A, Windmeijer F, Dibben C:
Allocation of resources to English areas. Edinburgh: Depart-ment of Health,. Information and Service Division; 2002.
5. Van Doorslaer E, Masseria C, OECD Health Equity Research Group Members: Income-Related Inequality in the Use of Medical Care in 21 OECD Countries. In Health Working Paper No 14 Paris: OECD; 2004.
6. Morris S, Sutton M, Gravelle H: Inequity and inequality in the use of health care in England: an empirical investigation. Soc Sci Med 2005, 60:1251-1266.
7. Van Doorslaer E, Masseria C, Koolman X: Inequalities in access to medical care by income in developed countries. CMAJ 2006,
174:177-183.
8. Whitehead M, Evandrou M, Haglund B, Diderichson F: As the health divide widens in Sweden and Britain, what's happening to access to care? BMJ 1997, 315:1006-1009.
9. Dunlop S, Coyte PC, McIsaac W: Socio-economic status and the utilization of physician's services: results from the Canadian National Population Health Survey. Soc Sci Med 2000,
52:123-133.
10. Hurley J, Grignon M: Income and equity of access of physician services. CMAJ 2006, 174:187-188.
11. Culyer AJ: Equity – some theory and its policy implications. J Med Ethics 2001, 27:275-83.
12. Rodriguez M, Stoyanova A: The effect of private insurance access on the choice of GP/specialist and public/private pro-vider in Spain. Health Econ 2004, 13:689-703.
13. Mossialos E, Thomson SM: Voluntary health insurance in the European Union: a critical assessment. Int J Health Serv 2002,
32:19-88.
14. Propper C, Green K: A larger role for the private sector in financing UK health care: the arguments and the evidence. J Soc Policy 2001, 30:685-704.
15. Propper C, Eachus J, Chan P, Pearson N, Davey Smith D: Access to health care resources in the UK: the case for arthritis. Health Econ 2005, 14:391-406.
16. Ministerio de Sanidad y Consumo. Encuesta Nacional de Salud [http://www.msc.es/estadEstudios/estadisticas/encuestaNa cional/encuestaNac2003/home.htm]. (accessed 21 December 2007) 17. Álvarez-Dardet C, Alonso J, Domingo A, Regidor E: La medición de
la clase social en ciencias de la salud. Informe de un grupo de trabajo de la Sociedad Española de Epidemiología. Barcelona: SG Editores SA; 1995.
18. Cox BG, Cohen SB: Methodological issues for health care sur-veys. New York: Marcel Dekker Inc; 1985:214-237.
19. Skov T, Deddens J, Petersen MR, Endahl L: Prevalence proportion ratios: estimation and hypothesis testing. Int J Epidemiol 1998,
27:91-5.
20. Dalstra JAA, Kunst AE, Borrell C, Breeze E, Cambois E, Costa GJ, Geurts JJM, Lahelma E, Van Oyen H, Rasmussen N, Regidor E, Spadea T, Mackenbach JP: Socio-economic differences in the preva-lence of common chronic diseases: an overview of eight European countries. Int J Epidemiol 2005, 34:316-26.
21. Regidor E, Gutiérrez-Fisac JL, Domínguez V, Calle ME, Navarro P:
Comparing socioeconomic inequalities in perceived health in Spain: 1987 and 1995/97. Soc Sci Med 2002, 54:1323-32. 22. Borrell C, Rohlfs I, Ferrando J, Pasarin MI, Domínguez-Berjón F,
Plas-encia A: Social inequalities in perceived health and use of health services in a southern European urban area. Int J Health Serv 1999, 29:743-64.
23. Oliver A, Mossialos E: Equity of access to health care: outlining the foundations for action. J Epidemiol Community Health 2004,
58:655-658.
24. Regidor E, Martínez D, Astasio P, Ortega P, Ma Elisa Calle, Domínguez D: La asociación de los ingresos económicos con la utiliza-ción y con la accesibilidad de los servicios sanitarios en España al inicio del siglo XXI. Gac Sanit 2006, 20:352-9. 25. Ministerio de Sanidad y Consumo. Barómetro Sanitario
[http://www.msc.es/estadEstudios/estadisticas/docs/ BS_2006_total_mar.pdf]. (accessed 21 December 2007)
26. Blendon RJ, Donelan K, Novell AJ, Pellise L, Costas Lombardia E:
Spain's citizens assess their health care system. Health Affairs
Publish with BioMed Central and every scientist can read your work free of charge
"BioMed Central will be the most significant development for disseminating the results of biomedical researc h in our lifetime."
Sir Paul Nurse, Cancer Research UK
Your research papers will be:
available free of charge to the entire biomedical community
peer reviewed and published immediately upon acceptance
cited in PubMed and archived on PubMed Central
yours — you keep the copyright
Submit your manuscript here:
http://www.biomedcentral.com/info/publishing_adv.asp
BioMedcentral
27. Vera-Hernández AM: Duplicate coverage and demand for health care. The case of Catalonia. Health Econ 1999, 8:579-598. 28. Belsey T, Hall J, Preston I: The demand for private health
insur-ance: do waiting lists matter? J Public Econ 1999, 72:155-181. 29. Frankel S, Ebrahim S, Davey Smith G: The limits to demand for
health care. BMJ 2000, 321:40-5.
30. Propper C: The demand for private health care in the UK. J Health Econ 2000, 19:855-876.
Pre-publication history
The pre-publication history for this paper can be accessed here: