R E S E A R C H A R T I C L E
Open Access
Cold shock CspA and CspB protein production
during periodic temperature cycling in
Escherichia coli
Tina Ivancic
1, Polona Jamnik
2and David Stopar
1*Abstract
Background:Temperature is an important environmental factor which can dramatically affect biochemical processes in bacteria. Temperatures above optimal cause heat shock, while low temperatures induce cold shock. Since the physiological response of the bacteriumEscherichia colito slow temperature fluctuation is not well known, we investigated the effect of periodic temperature cycling between 37° and 8°C with a period of 2 h on proteome profile, cold shock CspA and CspB protein and gene production.
Results:Several proteins (i.e. succinyl-CoA synthetase subunit alpha, periplasmic oligopeptide-binding protein, maltose-binding periplasmic protein, outer membrane porin protein, flavodoxin-1, phosphoserine aminotransferase) were up or down regulated during temperature cycling, in addition to CspA and CspB production. The results indicate that transcription ofcspAandcspBincreased during each temperature downshift and consistently decreased after each temperature upshift. In sharp contrast CspA-FLAG and CspB-FLAG protein concentrations in the cell increased during the first temperature down-shift and remained unresponsive to further temperature fluctuations. The proteins CspA-FLAG and CspB-FLAG were not significantly degraded during the temperature cycling.
Conclusion:The study demonstrated that slow periodic temperature cycling affected protein production compared to cells constantly incubated at 37°C or during classical cold shock. BacterialcspAandcspBmRNA transcript levels fluctuated in synchrony with the temperature fluctuations. There was no corresponding pattern of CspA and CspB protein production during temperature cycling.
Keywords:CspA-FLAG, CspB-FLAG, Temperature cycling, Protein degradation,cspAandcspBtranscription
Background
Most of our knowledge about the cold shock response of bacteria is obtained from experiments in which cells are fast cold shocked and left at low temperatures until they recover. In the environment, however, cells are ex-posed to changes in temperature on a regular diurnal or seasonal basis, as well as on less predictable time scales. Temperature fluctuations can dramatically affect the physiology of bacterial cultures [1-7]. Under a fluctuating temperature regime, metabolic efficiency may decrease [8], the abundance ofEscherichia coli may differ [9] and the survival ofE. coliO157:H7 decreases with increasing
amplitude of the daily temperature oscillations [6]. It has been demonstrated that during temperature cyclingE. coli membrane composition may become conditioned to cold [10].
The focus of this study is how CspA and CspB re-spond to a slow temperature fluctuation between the op-timal temperature for growth (37°C) and the minimal temperature for growth (8°C) ofE. coli. Although an ed-ucated guess based on the cold shock behaviour and growth at optimal temperature of E. coli can be made, the effect of temperature fluctuation on CspA and CspB has not been experimentally verified. The cold shock re-sponse inE. coliis well documented and provides a good reference point to gauge the extent of the effect of temperature fluctuations on cell physiology [11]. During classical cold shock, CspA protein and its homologous proteins (i.e. CspB, CspG, CspI) are considered to have
* Correspondence:david.stopar@bf.uni-lj.si
1Laboratory of Microbiology, Department of Food Science and Technology,
Biotechnical Faculty, University of Ljubljana, Večna pot 111, 1000 Ljubljana, Slovenia
Full list of author information is available at the end of the article
an essential role in adaptation to low temperatures [11,12]. For instance, CspA and CspB bind to mRNA and work as chaperones to facilitate mRNA translation by preventing formation of mRNA secondary structures [13,14]. CspA also acts as a transcription regulator pro-tein [15,16]. Because CspA and CspB translation does not require cold adapted ribosomes [17], cells respond quickly to cold shock. It was postulated that induction of cold shock genes is primarily due to post-transcriptional regulation [18], while recent investigations have shown that translational preferences during cold shock are present [19-21]. It is also known thatcspAmRNA and its protein CspA are hardly detected in cells growing at a constant 37°C [22]. In the natural microbial environment, temperature changes are usually gradual. This is different from the classical cold shock experiment where the temperature is rapidly changed and cells do not experi-ence a gradual change of temperature. Slow and fast cold shock may lead to different cell adaptation. There are, however, no systematic studies to show the effect of peri-odic slowly changing temperature on transcription and translation of CspA and CspB cold shock proteins.
In this workEscherichia coli was used as a model sys-tem to study proteome and specifically cold shock CspA and CspB protein response to temperature fluctuations. Cells were grown at the optimal growth temperature (37°C) for one hour, then incubated for one hour at the minimal growth temperature (8°C), transferred back to 37°C for one hour and so forth for 12 hours of incu-bation. The response was compared to cells incubated at a constant 37°C or ones cold shocked at 8°C. The tran-scription of cspA and cspB mRNA was determined by real-time PCR. The relative protein concentration and degradation levels of CspA-FLAG and CspB-FLAG were measured by Western and immuno blot analysis. This study represents the first report of the transcription and translation of CspA and CspB during slow periodic temperature fluctuation.
Methods
Bacterial strains and plasmids
Proteins CspA and CspB were FLAG tagged as previ-ously described using the plasmids pKD46 and pSUB11 [23] and the C-term FLAG was confirmed by PCR. The pCP20 plasmid was used in order to eliminate the kana-mycin cassette in the CspA-FLAG and CspB-FLAG strains [24]. Escherichia coli wild type strain K12 MG1655 andE. coliK12 ESH10 were used.
Bacterial growth
Bacteria were grown as described previously [10]. In temperature fluctuation experiments, bacteria were incu-bated for a total period of 12 hours, with alternating one-hour periods at 37°C and 8°C. In cold shock
experiments, bacteria were incubated at 37°C until the mid exponential phase (2.5 h) and then transferred to 8°C for the remaining four hours. In control experiments, bac-teria were incubated for 12 hours at a constant 37°C. The temperature in the growth medium oscillated continu-ously between 37°C and 8°C and was monitored as de-scribed previously [10].
Preparation of bacterial lysates for two-dimensional electrophoresis
E. coli K12 ESH10 samples were harvested at different time points and centrifuged (9000 rpm, 10 min, 4°C), washed four times with 10 mM Tris HCl, 250 mM su-crose at pH 7.4. The pellet was resuspended in rehydra-tion buffer (2 M thiourea, 7 M urea, 2% (w/v) CHAPS, 2% (v/v) immobilized pH gradient (IPG) buffer, 65 mM DTT) without bromphenol blue. Cells were lysed using sonication (4 times for 15 s with intermediate ice cooling) and centrifuged (21000 × g, 30 min, 4°C). Con-centrations of proteins in the supernatant were deter-mined by the Bradford method (Bradford, 1976). A 2-D Clean Up kit (GE Healthcare) was used for protein ex-tract cleaning before 2-D gel electrophoresis and stored at−80°C until further analysis.
Two-dimensional gel electrophoresis and gel image analysis
Two-dimensional electrophoresis (2DGE) was performed as described previously [25]. Typically, gels were stained with the fluorescent dye SYPRO Ruby (Invitrogen) and scanned using a G BOX:HR CCD camera (Syngene). Gels were made in triplicate. Gel image analysis was done with 2-D Dymension software version 2.02 (Syngene). The triplicate gels were matched to create an average sample gel. Spots were detected and quantified on the basis of their normalized volume (the spot volume was divided by the total volume over the whole set of gel spots). The aver-age sample gels of temperature treated and control (those incubated at a constant 37°C) cells were compared for dif-ferentially produced proteins. The change of production was considered significant only if the intensity of the corresponding spot differed reproducibly by more than two-fold in normalized volume between the treated and control cells and if it was statistically significant (ANOVA test, p < 0.05).
Protein identification by mass spectrometry
vacuum concentrator for 20 min. Sequencing-grade, modified porcine trypsin (Promega) was dissolved in the 50 mM acetic acid supplied by the manufacturer, then diluted 5-fold by adding 25 mM ammonium bicarbonate to give a final trypsin concentration of 0.02 g/l. The gel pieces were rehydrated by adding 10μl of trypsin solu-tion, and after 30 min 25 mM ammonium bicarbonate solution was added to cover the gel pieces, which were incubated overnight at 37°C. A 1 μl aliquot of each peptide mixture was applied directly to the ground steel MALDI target plate, followed immediately by an equal volume of a freshly-prepared 5 mg/ml solution of 4-hydroxy-α-cyano-cinnamic acid (Sigma) in 50% (v:v) aqueous acetonitrile containing 0.1% (v:v) trifluoroacetic acid. Positive-ion MALDI mass spectra were obtained using a Bruker ultraflex III in the reflectron mode, equipped with a Nd:YAG smart beam laser. MS spectra were acquired over a mass range of m/z 800–4000. The final mass spectra were externally calibrated against an ad-jacent spot containing 6 peptides (des-Arg1-Bradykinin, 904.681; Angiotensin I, 1296.685; Glu1-Fibrinopeptide B, 1750.677; ACTH (1–17 clip), 2093.086; ACTH (18–39 clip), 2465.198; ACTH (7–38 clip), 3657.929.). Monoisoto-pic masses were obtained using a SNAP algorithm (C 4.9384, N 1.3577, O 1.4773, S 0.0417, H 7.7583) and a S/N threshold of 2. For each spot the ten strongest peaks of interest, with an S/N ratio greater than 30, were selected for MS/MS fragmentation. Fragmentation was performed in the LIFT mode without the introduction of a collision gas. The default calibration was used for MS/MS spectra, which were baseline-subtracted and smoothed (Savitsky-Golay, width 0.15 m/z, cycles 4); monoisotopic peak detection used a SNAP averaging algorithm (C 4.9384, N 1.3577, O 1.4773, S 0.0417, H 7.7583) with a minimum S/N of 6. Bruker flexAnalysis software (version 3.0) was used to perform the spectral processing and peak list gen-eration for both the MS and MS/MS spectra. The tandem mass spectral data were submitted to database searching using a locally-running copy of the Mascot program (ver-sion 2.1; Matrix Science), through the Bruker BioTools interface (version 3.2). Criteria to search the NCBInr database (version 2008. 09. 24; 7044224 sequences, 2433775060 residues) included tryptic digest with a maximum number of one missed cleavage and monoiso-topic peptide masses. The mass tolerance was set to ± 100 ppm after internal calibration and the fragment mass tol-erance to ± 0.4 Da. Additionally, carbamidomethylation was set to fixed modification and oxidation of methionine, and was considered as a variable modification. Peptide identifications with an expected score less than 0.05 were accepted. Protein homology identifications for the top hit (first rank) that contained at least one peptide with an ion score greater than the MOWSE identity threshold at p < 0.05 were retained. For protein matches with
only one unique peptide, the peptide sequence was searched against the non-redundant protein database in the National Center for Biotechnology Information (NCBI) BLASTp (taxonomy was limited toEscherichia coli) to ensure that no other proteins share exactly the same peptide sequence.
RNA isolation
Total RNA fromE. coliK12 MG1655 was isolated using the "RNA Protect" and "RNeasy" kits (Qiagen) according to the manufacturer's instructions. DNase I (Qiagen) was used to remove genomic DNA contamination.
Quantitative real-time PCR
One microgram of the DNase-treated total RNA was re-verse transcribed using random hexamers (Fermentas) by ImPromII reverse transcriptase (Promega). To quantify cspA transcript levels the forward primer 5'- GGCTT CGGCTTCATCACTCCTG -3' and the reverse primer 5'- TACCAGCTGCCGGGCCTTTAG -3' were constructed. PCR reactions were performed using 250 nM of each gene-specific primer in a 20μl volume with 1× SYBR green PCR master mix (Thermo Scientific). The reactions were run on a Corbett Research instrument using the following cycling parameters: 95°C for 15 min, 40 cycles of denaturation at 95°C for 30 s, primers annealing at 56°C for 20 s and exten-sion at 67°C for 25 s. To measure thecspBtranscript levels, the forward primer 5'- TGCATTTTTCTGCGATTCAG -3' and the reverse primer 5'-GCAGGACCTTTAGCACCA CT-3' were used. PCR reactions were performed using 250 nM of each gene-specific primer in a 20μl volume with 1× Power Sybr green PCR master mix (Applied Biosystems). Reactions were run on an ABI prism 7900 HD (Applied Biosystems) as described by the manufac-turer. The relative amounts of cspA and cspB tran-scripts were calculated by theΔCqmethod [26].
Degradation assay
Spectinomycin (300 μg/ml) was added to E. coli K12 MG1655 at different time points (t =5 h and 6 h during temperature fluctuations,t =2.5 h at 37°C, and 1 h after temperature downshift from 37°C to 8°C in cold shock experiments). The protein samples were taken every 30 minutes after the addition of antibiotic. Aliquots containing equal amounts of protein were fractionated by sodium dodecyl sulphate-polyacrylamide gel electro-phoresis (SDS-PAGE) and detected by the Western and immuno blot analysis as further described.
Western and immuno blot analysis
(1:1000) and horseradish peroxidase-conjugated goat anti-mouse IgG antibodies (Jackson ImmunoResearch) as secondary antibodies (1:10000). An enhanced chemi-luminescence detection kit (Pierce) was used for protein detection on the membranes. The samples were scanned by a G BOX:HR CCD camera (Syngene) and analysed with GeneTools (Syngene). A calibration curve for CspA-FLAG protein was prepared. There was a linear increase of signal in the total cellular protein range from 0 to 240μg (R2= 0.92). At 60μg of total cellular protein used for all the samples in this work, the Western assay was shown to be within the linear dynamic range.
Results
In one set of experiments the temperature in the growth medium of E. coli continuously oscillated between 37 and 8°C (Figure 1), resulting in a step-like growth curve. Bacterial growth decreased during each temperature downshift, when the temperature of the bacterial growth medium dropped to 15°C or lower. Similarly during temperature upshift, growth resumed after the temperature in the growth medium reached 20°C or higher.
The effect of the periodic temperature cycling on cel-lular protein profile was studied by two-dimensional electrophoresis (2DGE). The protein profile after five hours of temperature cycling (Figure 2) was compared to the protein profile of cells incubated at a constant 37 or 8°C. Based on this 2-D analysis, the intensities of sev-eral spots in the temperature cycled cells were changed, but only proteins which had 2-fold or greater increased or decreased production on temperature cycling were selected for further identification and study. The protein identity determined by mass spectrometry and their assigned physiological functions are given in Table 1. The proteins that were significantly (p < 0.05) up or
down regulated during thermo-cycling belong to cold stress response proteins, proteins involved in energy me-tabolism, transport proteins, and proteins involved in amino acid synthesis. The response of the cold shock proteins CspA and CspB was further characterized.
The relative production of FLAG-tagged CspA and CspB proteins during thermo-cycling was monitored by the Western blotting assay (Figure 3A and C). The rela-tive production of CspA-FLAG and CspB-FLAG pro-teins increased during the first temperature downshift. Subsequent temperature oscillations did not significantly (p > 0.05) change the relative protein levels. The relative response of CspB-FLAG was approximately 10-fold higher than of CspA-FLAG. On the other hand, the nor-malized total protein concentration increased toward the end of the incubation experiment as expected. The re-sults therefore indicate that the ratio of CspA or CspB to total protein was not constant but changed during the incubation. It first significantly increased and then slowly decreased toward the end of incubation, but never reached the initial ratio.
The corresponding protein production in cells exposed to cold shock is given in Figures 3B and D. As expected cold shock increased the production of both CspA-FLAG and CspB-CspA-FLAG proteins. Their relative response was similar to the temperature cycled cells. The degrad-ation of CspA-FLAG and CspB-FLAG proteins was measured after protein synthesis in the cell was blocked by the addition of the antibiotic spectinomycin. As shown in Figure 4, there was no significant protein deg-radation of CspA- or CspB-FLAG after five hours of in-cubation. In addition, the CspA-FLAG decay rate was measured at different times and temperatures during the experiment. Samples were taken after 5 h or 6 h during the temperature fluctuation experiment (i.e. at 37 and
0.000 0.200 0.400 0.600 0.800 1.000 1.200
0 1 2 3 4 5 6 7 8 9 10 11 12
time (h)
OD
650
0 10 20 30 40 50 60 70 80 90 100
te
m
p
er
at
u
re (
°C
[image:4.595.60.540.534.703.2])
8°C), or from cells constantly incubated at 8 or 37°C. Despite their different history, the proteins did not decay when tested by the degradation assay.
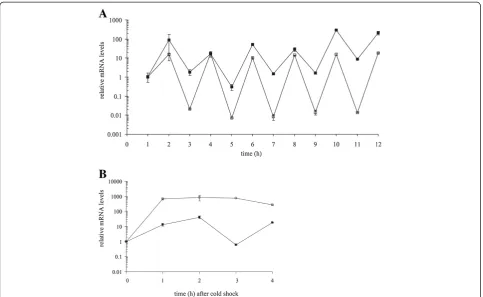
The relative amounts of cspA and cspB mRNA tran-scripts during the periodic temperature cycling and dur-ing cold shock are given in Figure 5. In sharp contrast to the relative protein production, the relative transcript levels fluctuated in synchrony with the oscillating temperature. The levels of cspA and cspB mRNA tran-scripts increased significantly (p < 0.05) after each temperature downshift. On the other hand, the levels of both transcripts significantly (p < 0.05) decreased during each temperature up-shift. The fluctuation amplitude of
[image:5.595.59.538.89.200.2]the cspA mRNA transcript was approximately constant throughout the experiment. An approximately three or-ders of magnitude difference in cspA mRNA transcript levels was observed between low and high temperatures. The corresponding change for cspBmRNA was two or-ders of magnitude. The level of cspA transcript during the cold shock experiment significantly increased after temperature downshift and remained approximately at the same level for the next 4 hours. On the contrary, the level of cspB transcript first increased and then de-creased after 3 hours to the level before the cold shock. Interestingly, after 4 hours at low temperatures thecspB transcript level increased again.
Figure 22DGE gel of total cell protein fromE. coliduring periodic temperature cycling.Two dimensional gels ofE.colilysates obtained during constant incubation at 37°C(A), periodic temperature cycling(B), and at 8°C(C). The pI range is 4–7 and the molecular mass range is 10–250 kDa. The identity of protein spots that were significantly (p>0.05) up or down produced relative to the proteins in cells constantly incubated at 37°C are given in Table 1.
Table 1 Protein identification
General function
Spot number
Protein name or function
NCBInr accession no.
Gene Up or down regulation MOWSE
score
Sequence coverage (%) temperature cycled
cells relative to cells constantly at 37°C
cold shock cells relative to cells constantly at 37°C
Stress response 1 Cold shock-like protein cspB
gi|16129516 cspB de novo de novo 301 52
2 Cold shock protein cspA
gi|15804102 cspA + 5.1 + 2.8 310 52
Energy metabolism
3 Succinyl-CoA synthetase subunit alpha
gi|1580008 sucD + 2.7 NC 105 5
Peptide transport
4 Periplasmic oligopeptide-binding protein
gi|1583099 oppA + 3.1 NC 340 11
Sugar transport 5 Maltose-binding periplasmic protein
gi|15834271 malE + 5.8 NC 519 17
Ion transport 6 Outer membrane porin protein nmpC
gi|145856 nmpC - 10.0 NC 555 26
Electron transport
7 Flavodoxin-1 gi|2781032 fldA - 2.1 NC 532 38
Amino acid biosynthesis
8 Phosphoserine
aminotransferase
gi|3891552 serC - 2.4 NC 260 14
Protein synthesis
9 30S ribosomal protein S16 gi|15803131 rpsP NC + 3.6 96 19
10 50S ribosomal protein L27 gi|15833318 rpmA NC + 2.5 112 16
[image:5.595.59.539.449.716.2]Discussion
In this work temperature was periodically fluctuated be-tween 37°C and 8°C during the growth ofE. coli, generat-ing continuous physiological stress on the bacterial cells. The two temperatures represent the optimal temperature for growth (37°C) and the minimal temperature (8°C) that sustains growth of E. coli [27]. During one temperature cycle cells spent approximately one hour at temperatures known to induce cold shock response in E. coli [28], when transient arrest of bacterial growth is expected (Figure 1) [29,30].
The results indicate that several proteins were up or down regulated during the thermo-cycling (see Figure 2, Table 1) in comparison to cells incubated at a constant 37°C in the middle of the exponential phase. The cold shock protein CspA was up regulated, while CspB was de novosynthesized. This could be the result of different thermoregulation of the two proteins [31]. In addition there was a significant up regulation of succinyl-CoA synthetase subunit alpha (SCS-α), which is a key meta-bolic enzyme in the tricarboxylic cycle (TCA), and sig-nificant down regulation of the electron transport flavodoxin-1 protein. This suggests that the cells were energy stressed [32,33] during temperature cycling. Dur-ing the thermo-cyclDur-ing proteins that are involved in
0,1 1 10 100
0 1 2 3 4 5 6 7 8 9 10 11 12
time during periodic temperature cycling (h)
re
la
tiv
e
p
rote
in
le
v
e
ls
0,1 1 10 100
0 1 2 3 4
time after cold shock
re
la
tiv
e
p
rote
in
le
v
e
ls
C
D
[image:6.595.57.541.92.353.2]A
B
Figure 3Western blot assayof CspA-FLAG, CspB-FLAG and the graphical presentation.Western blot assay during the periodic temperature cycling(A)and during the cold shock(B)is shown. The relative amounts of CspA-FLAG (empty squares), CspB-FLAG (full squares), the relative total protein concentration in CspA-Flag cells (empty triangles), and the relative total protein concentration in CspB-FLAG cells (crosses) during the periodic temperature cycling(C)and during the cold shock(D)are shown. The amounts of proteins are plotted relative to the level prior to the first temperature down shift, whereas protein values during the cold shock are normalized to the protein values just before temperature downshift. The data were obtained from three independent experiments. Mean values and standard deviation are given.
Figure 4The degradation of CspA-FLAG and CspB-FLAG.
[image:6.595.57.291.434.645.2]transport pathways such as periplasmic oligopeptide-binding protein (OppA) or maltose-oligopeptide-binding periplasmic protein (MalE) were significantly up regulated, while the outer membrane porine protein (NmpC) was down reg-ulated. It has been reported [33] that during temperature downshift the proteins involved in amino acid biosyn-thesis were induced. This might be the result of re-pressed growth at low temperature and cell effort to overcome metabolic imbalance. Our results, however, showed significant down regulation of phosphoserine aminotransferase (SerC), but only during the periodic temperature cycling. There was no corresponding down regulation during cold shock. At low temperature many different 30S and 50S ribosomal proteins are known to be inhibited [32,33]. In addition, the proteins involved in protein folding are induced during cold shock that pre-pares the cells to reinitiate protein synthesis during ex-posure to cold temperatures [34]. Consistently, 30S ribosomal protein S16 and 50S ribosomal protein L27 were up regulated during cold shock. But interestingly, no up regulation of ribosomal proteins was found during the periodic temperature cycling. As has been shown by Jones 1989, approximately two dozen new proteins were produced during classical cold shock [28]. As described in the present work several new proteins were produced
during the thermo-cycling but only CspA overlapped significantly with the known cold shock proteins [35]. Since we adopted a rather stringent criterion to label a protein as a cold shock protein (the protein concentra-tion had to increase at least two-fold), it is possible that other cold shock proteins were produced to a lesser de-gree and more overlap exists between classical cold shock and the cold shock described in this work. If we combine the results it is clear that temperature fluctu-ation has a profound effect on protein synthesis that could have not been predicted from the results in cells grown at a constant 37°C or during cold shock.
[image:7.595.57.541.88.385.2]key role in cold shock response [18,19]. It was also shown that the increased cspAmRNA stability during cold shock is the result of the functionally distinct mRNA secondary structure at low temperature, which can act as a thermosensor [38]. Therefore the results indicate that the same mechanism of RNA remodelling is also present during temperature cycling.
On the other hand, the major result of this work is the observation that CspA-FLAG and CspB-FLAG proteins did not follow the on-off regulation of cspA and cspB during temperature fluctuations. The results indicate that CspA-FLAG and CspB-FLAG levels in thermo-cycled cells were higher compared to cells incubated at a constant 37°C. It is generally accepted that CspA and CspB proteins are abundantly produced at low tempera-tures but only sparsely at high temperatempera-tures [31,39,40]. The results of the periodic temperature cycling experi-ments are therefore unexpected and could not be pre-dicted in advance. It is possible that CspA is a rather stable protein that is not degraded at high temperatures and can accumulate in the cell (Figure 3). Since CspA is mainly produced at low temperatures, it is interesting to note that apart from the first temperature down shift its level remains unchanged during temperature cycling. The absence of a relative increase in CspA levels during thermo cycling may be the result of reduced translation of the cold shock proteins [19]. However, if no cold shock protein synthesis were to occur during temperature cyc-ling, both CspA and CspB proteins would be diluted in the progeny cells. Since this has not been observed, we speculate that some protein synthesis must have occurred. As shown in Figure 1, cells resume growth after each temperature upshift. There are two possible mechanisms that could increase CspA protein synthesis in the cell. Apart from cold shock, CspA is also synthesized on carbon-source upshift at 37°C, which increases the growth rate ofE.coli. The increased transcription ofcspA is a re-sult of the close proximity ofcspAto the origin of replica-tion oriC [41,42]. This in turn leads to a higher gene dosage effect and higher cspA mRNA stability due to lower RNase activity, and allows CspA to reach one-sixth of its cold-shocked induction level [39,41]. Since growth occurred after each temperature upshift when the temperature in the growth medium reached 20°C or higher, it is possible that some CspA could be synthesized due to the higher gene dosage effect after growth resumed.
Although much less is known about the behaviour of the CspB protein, the results of this study indicate that at least qualitatively it behaves similarly to CspA protein. The stronger response of CspB relative to CspA might be the result of different thermoregulation, since it is known that CspA is more induced than CspB at temper-atures above 30°C [31]. It is, however, less likely that the
same mechanism of induction would be in operation for CspB during temperature cycling as for CspA, because CspB is not located near theoriC[42].
Conclusions
Protein production during temperature cycling is different from protein production either at 37°C or during cold shock. The results indicate consistently higher levels of cspA and cspBtranscripts after each temperature down-shift and up to three-orders of magnitude lower levels after each temperature upshift due to decreased mRNA stability at high temperatures. There was no correspond-ing fluctuation of CspA and CspB protein concentrations during the temperature cycling. It was observed that proteins were not degraded during temperature up shift. Although microbiologists have learned a great deal from experiments conducted at constant tempera-tures, the results of this study show that bacterial physiological response to fluctuating temperatures is not a simple superimposition of the results obtained at different temperature conditions.
Competing interests
The authors declare that they have no competing interests.
Authors’contributions
TI carried out the experiment, PJ participated in the 2DGE and helped with protein identification. DS participated in the design of the study. TI, PJ and DS wrote the manuscript. All authors read and approved the final manuscript.
Acknowledgements
We thank Prof. Dr. Eliora Z. Ron forE. coliK12 MG1655 and the plasmids pKD46, pSUB11, pCP20. We also thank Dr. Dvora Biran and Aviram Rasouly for constructive discussions and technical assistance. We gratefully acknowledge financial support from the Slovenian Research Agency (ARRS No. 1000-06-310164). The work was partially supported by an FEMS Research fellowship.
Author details
1Laboratory of Microbiology, Department of Food Science and Technology,
Biotechnical Faculty, University of Ljubljana, Večna pot 111, 1000 Ljubljana, Slovenia.2Laboratory of Biotechnology, Microbiology and Food Safety, Department of Food Science and Technology, Biotechnical Faculty, University of Ljubljana, Jamnikarjeva 101, 1000 Ljubljana, Slovenia.
Received: 25 June 2012 Accepted: 25 June 2013 Published: 2 July 2013
References
1. Baranyi J, Robinson TP, Kaloti A, Mackey BM:Predicting growth of
Brochothrix thermosphactaat changing temperature.Int J Food Microbiol1995, 27:61–75.
2. Bovill R, Bew J, Cook N, D'Agostino M, Wilkinson N, Baranyi J:Predictions of growth forListeria monocytogenesandSalmonelladuring fluctuating temperature.Int J Food Microbiol2000,59:157–165.
3. Bovill RA, Bew J, Baranyi J:Measurements and predictions of growth for
Listeria monocytogenesandSalmonelladuring fluctuating temperature: II Rapidly changing temperatures.Int J Food Microbiol2001,67:131–137. 4. Fujikawa H, Kai A, Morozumi S:A new logistic model forEscherichia coli
growth at constant and dynamic temperatures.Food Microbiol2004, 21:501–509.
6. Semenov AV, van Bruggen AHC, van Overbeek L, Termorshuizen AJ, Semenov AM:Influence of temperature fluctuations onEscherichia coli
O157:H7 andSalmonella entericaserovar Typhimurium in cow manure.
FEMS Microbiol Ecol2007,60:417–428.
7. Morozov II, Petin VG:The influence of cyclic heating and cooling on
Escherichia colisurvival.Microbiology2007,76:172–176. 8. Toljander YK, Lindahl BD, Holmer L, Högberg NOS:Environmental
fluctuations facilitate species co-existence and increase decomposition in communities of wood decay fungi.Oecologia2006,148:625–631. 9. Jones T, Gill CO, McMullen LM:The behaviour of log phaseEscherichia coli
at temperatures that fluctuate about the minimum for growth.Lett Appl Microbiol2004,39:296–300.
10. Ivancic T, Vodovnik M, Marinsek-Logar R, Stopar D:Conditioning of the
Escherichia colimembrane fatty acids profile during periodic temperature cycling.Microbiology2009,155:3461–3463.
11. Phadtare S:Recent developments in bacterial cold-shock response.Curr Issues Mol Biol2004,6:125–136.
12. Yamanaka K:Cold shock response inEscherichia coli.J Mol Microbiol Biotechnol1999,1:193–202.
13. Jiang W, Hou Y, Inouye M:CspA, the major cold-shock protein of
Escherichia coli, is a RNA chaperone.J Biol Chem1997,272:1196–1202. 14. Phadtare S, Inouye M:Sequence-selective interactions with RNA by CspB,
CspC and CspE, members of the CspA family ofEscherichia coli.Mol Microbiol1999,33:1004–1014.
15. La Teana A, Brandi A, Falconi M, Spurio R, Pon CL, Gualerzi CO:
Identification of a cold shock transcriptional enhancer of theEscherichia coligene encoding nucleoid protein H-NS.Proc Natl Acad Sci USA1991, 88:10907–10911.
16. Jones PG, Krah R, Tafuri SR, Wolffe AP:DNA gyrase, CS7.4, and the cold shock response inEscherichia coli.J Bacteriol1992,174:5798–5802. 17. Jones PG, Inouye M:RbfA, a 30S ribosomal binding factor, is a
cold-shock protein whose absence triggers the cold-cold-shock response.Mol Microbiol1996,21:1207–1218.
18. Brandi A, Pietroni P, Gualerzi CO, Pon CL:Post-transcriptional regulation of CspA expression inEscherichia coli.Mol Microbiol1996,19:231–240. 19. Gualerzi CO, Giuliodori AM, Pon CL:Transcriptional and
post-transcriptional control of cold-shock genes.J Mol Biol2003,331:527–539. 20. Giangrossi M, Brandi A, Giuliodori AM, Gualerzi CO, Pon CL:Cold-shock
induceedde novotranscription and translation ofinfAand role of IF1 during cold adaptation.Mol Microbiol2007,64:807–821.
21. Giuliodori AM, Brandi A, Giangrossi M, Gualerzi CO, Pon CL: Cold-stress-induced de novo expression ofinfCand role of IF3 in cold-shock translational bias.RNA2007,13:1355–1365.
22. Jones PG, Inouye M:The cold-shock response - a hot topic.Mol Microbiol1994, 11:811–818.
23. Uzzau S, Figueroa-Bossi N, Rubino S, Bossi L:Epitope tagging of chromosomal genes inSalmonella.Proc Natl Acad Sci USA2001,98:15264–15269. 24. Cherepanov PP, Wackernagel W:Gene disruption inEscherichia coli: TcR
and KmRcassettes with the option of Flp-catalyzed excision of the
antibiotic-resistance determinant.Gene1995,158:9–14.
25. Jamnik P, Goranovic D, Raspor P:Antioxidative action of royal jelly in the yeast cell.Exp Gerontol2007,42:594–600.
26. Pffafl MW:Relative quantification.InReal-time PCR.Edited by Dorak T. La Jolla, California: International University Line; 2006:63–82. 27. Shaw MK, Marr AG, Ingraham JL:Determination of the minimal
temperature for growth ofEscherichia coli.J Bacteriol1971,105:683–684. 28. Jones PG, VanBogelen RA, Neidhart FC:Induction of proteins in response to low temperature inEscherichia coli.J Bacteriol1987,169:2092–2095. 29. Mitchell GA, Brocklehurst TF, Parker R, Smith AC:The effect of transient temperatures on the growth ofSalmonella typhimuriumLT2 I: cycling within the growth region.J Appl Microbiol1994,77:113–119. 30. Mitchell GA, Brocklehurst TF, Parker R, Smith AC:The effect of transient
temperatures on the growth ofSalmonella typhimuriumLT2 II: excursions outside the growth region.J Appl Microbiol1995,79:128–134. 31. Etchegaray JP, Jones PG, Inouye M:Differential thermoregulation of two
highly homologous cold-shock genes,cspAandcspB, ofEscherichia coli.
Genes to Cell1996,1:171–178.
32. Jones TH, Murray A, Johns M, Gill CO, McMullen ML:Differential expression of proteins in cold-adapted log-phase cultures ofEscherichia coli
incubated at 8, 6 or 2°C.Int J Food Microbiol2006,107:12–19.
33. Kim Y-H, Han KY, Lee K, Lee J:Proteome response ofEscherichia coli fed-batch culture to temperature downshift.Appl Microbiol Biotechnol2005, 68:786–793.
34. Thieringer HA, Jones PG, Inouye M:Cold shock and adaptation.Bioessays1998, 20:49–57.
35. Phadtare S, Severinov K:RNA remodeling and gene regulation by cold shock proteins.RNA Biol2010,7:788–795.
36. Mitta M, Fang L, Inouye M:Deletion analysis ofcspAofEscherichia coli:
requirement of the AT-rich UP element forcspAtranscription and the downstream box in the coding region for its cold shock induction.
Mol Microbiol1997,26:321–335.
37. Goldenberg D, Azar I, Oppenheim AB:Differential mRNA stability of thecspA
gene in the cold-shock response ofEscherichia coli.Mol Microbiol1996, 19:241–248.
38. Giuliodori AM, Di Pietro F, Marzi S, Masquida B, Wagner R, Romby P, Gualerzi CO, Pon CL:ThecspAmRNA is a thermosensor that modulates translation of the cold-shock protein CspA.Mol Cell2010,37:21–33. 39. Brandi A, Spurio R, Gualerzi CO, Pon CL:Massive presence of the
Escherichia coli'major cold-shock protein' CspA under non-stress conditions.EMBO J1999,18:1653–1659.
40. Goldstein J, Pollitt NS, Inouye M:Major cold shock protein.Proc Natl Acad Sci USA1990,87:283–287.
41. Yamanaka K, Inouye M:Induction of CspA, anE. colimajor cold-shock protein, upon nutritional upshift at 37°C.Genes to Cell2001,6:279–290. 42. Yamanaka K, Fang L, Inouye M:The CspA family inEscherichia coli:
multiple gene duplication for stress adaptation.Mol Microbiol1998, 27:247–255.
doi:10.1186/1756-0500-6-248
Cite this article as:Ivancicet al.:Cold shock CspA and CspB protein production during periodic temperature cycling inEscherichia coli.
BMC Research Notes20136:248.
Submit your next manuscript to BioMed Central and take full advantage of:
• Convenient online submission
• Thorough peer review
• No space constraints or color figure charges
• Immediate publication on acceptance
• Inclusion in PubMed, CAS, Scopus and Google Scholar
• Research which is freely available for redistribution