5AC = 5-aza-2′-deoxycytidine; 5-FU = 5-fluorouracil; ALL = acute lymphoblastic leukaemia; AML = acute myeloid leukaemia; BAC = bacterial artifi-cial chromosome; bp = base pair; CGH = comparative genomic hybridisation; CsA = cyclosporin A; DLBCL = diffuse large B-cell lymphoma; DPYD = dihydropyrimidine dehydrogenase; ER = oestrogen receptor; EST = expressed sequence tag; FISH = fluorescence in situhybridisation; HIV = human immunodeficiency virus; HNSCC = head and neck squamous cell carcinoma; JNK = Jun N-terminal kinase; LCM = laser capture microdissection; LDR = ligase detection reaction; Mb = megabase (1 million bases); NC160 = National Cancer Institute’s set of 60 human cancer cell lines; PCR = polymerase chain reaction; RDA = representational difference analysis; SAPK = stress-activated protein kinase; SSH = supres-sion subtractive hybridisation; TPA= phorbol ester; Top1 = topoisomerase 1; Top2 = topoisomerase 2.
Introduction
The Human Genome Project, which is nearing completion, is expected to lead to the identification of up to 50,000 human genes. The key question now facing the cancer community is how to use information from this project for the benefit of cancer patients. One of the key technical platforms that has been developed to achieve this is microarray analysis. This review highlights the ways in which DNA microarray technology can be utilised in a wide range of approaches to aid drug discovery and development and to improve our understanding of the mechanism of cancer development. Where possible, the work will focus on breast cancer, but other cancers will be described to illustrate particular approaches that may be of relevance to breast cancer. Many new bioinformatics approaches are being developed to support the analysis of the large amount of data generated by microarray studies. It is not the intention of this review to focus on
bioinformatics, however, as information on this important area can be obtained from a number of sources (see [1]).
Microarray design
A microarray is an orderly arrangement of known or unknown DNA samples attached to a solid support. Each DNA spot on the microarray (called the probe) is usually less than 200µM in diameter and an entire array typically contains thousands of spots. Many different design formats are possible [2]. The probes attached to the solid support can be small oligonucleotides, cDNAs or genomic sequences. The array may be formatted by photolitho-graphic synthesis of oligonucleotides in situ[3–5], or the DNA samples may be applied directly to the array surface by pins, nibs or inkjet technology [6–8]. Several distinct chemistries may be used to attach the probe to the surface, and hybridisation may be electronically controlled [9]. The target sequence hybridised to probes on the array
Review
Applications of microarray technology in breast cancer research
Colin S Cooper
The Institute of Cancer Research, Sutton, Surrey, UK
Correspondence:Colin S Cooper, The Institute of Cancer Research, Haddow Laboratories, Cotswold Road, Sutton, Surrey, SM2 5NG, UK. E-mail: csc@icr.ac.uk
Abstract
Microarrays provide a versatile platform for utilizing information from the Human Genome Project to benefit human health. This article reviews the ways in which microarray technology may be used in breast cancer research. Its diverse applications include monitoring chromosome gains and losses, tumour classification, drug discovery and development, DNA resequencing, mutation detection and investigating the mechanism of tumour development.
Keywords:drug discovery, genetic gains and losses, microarrays, microarray design, mutation detection, tumour classification
Received: 8 January 2001 Accepted: 1 February 2001 Published: 20 March 2001
Breast Cancer Res2001, 3:158–175 © 2001 BioMed Central Ltd
commentary
review
reports
primary research
may be radioactively or fluorescently labelled. Despite the large number of possible permutations, only a small number of formats are in common use.
Filter arrays
Filter arrays are produced by the high-density application of DNA samples, usually cDNAs, to nylon hybridisation mem-branes such as those used for Southern analysis [10–12]. Filter arrays have the advantage that they are commercially available and require no specialised equipment. Their use may be appropriate if only small RNA samples are available, as a result can be obtained with as little as 50 ng total RNA, which is used in reverse transcription reactions to synthe-sise a radiolabelled probe (usually with 32P or 33P). There are, however, several major disadvantages to this approach. First, the hybridisation patterns of two different targets can only be compared by comparing the results obtained with duplicate files or following stripping and rehybridisation of the same filter. This system is also generally thought to be less sensitive than other formats, detecting only high- and medium-abundance transcripts. An example of a result obtained with a filter array is shown in Figure 1.
Glass DNA microarrays
Glass DNA microarrays are produced by the robotic appli-cation of DNA to a glass surface; cDNAs or genomic clones are usually applied [6,7], although oligonucleotides may also be used [13]. This approach has the advantage that the probe can be covalently attached to an appropri-ately treated glass surface. Glass is extremely durable and
its non-porous properties mean that both the access of the hybridisation target to attached probes and the washing steps are rapid and highly reproducible. In addi-tion, the transparency and rigidity of glass improves image acquisition, and its low-fluorescence background results in superior sensitivity. As the target or test samples are flu-orescently labelled, several targets can be hybridised simultaneously in a single reaction, allowing direct com-parison between samples. A disadvantage of glass DNA microarrays is that large target samples are required: probes would typically be prepared from 1–5µg poly(A)+ RNA or 50–200µg total RNA by reverse transcription under conditions that allow incorporation of one of two flu-orescently labelled dyes designated Cy3 (red) and Cy5 (green). Alternatively, if DNA sequences are under investi-gation, the same dyes may be incorporated into genomic DNA by random priming. Technical details for the fabrica-tion of arrays are provided by Southern et al[14], Cheung
et al[15] and at the websites listed in Table 1.
High-density oligonucleotide arrays
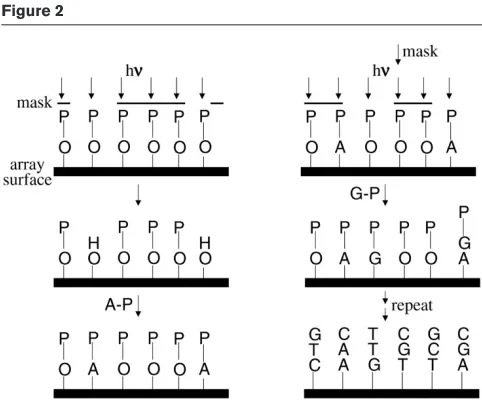
In this format, arrays of oligonucleotides (20–25mers) are synthesised in situ on a flat solid support [5,16–19]. Affymetrix achieves this by first attaching linkers containing a photochemically removable protecting group to a glass surface. Selected areas of the surface are then activated by illumination through a photolithographic mask, yielding reactive hydroxyl groups. A given nucleotide (A, G, C or T) is incubated with the surface under conditions that allow attachment of a single nucleotide only to the areas illumi-nated in the previous step. Repeating this process using a series of photolithographic masks that each direct light to different areas of the surface allows the synthesis of a large number of distinct oligonucleotides (Figure 2). Any set of oligonucleotides of length N can be synthesised in a maximum of 4 ×Ncycles. This approach has many of the advantages of the glass DNA arrays described above and allows much higher densities of probe. For example, Affymetrix typically produces arrays, called GeneChips, that contain at least 300,000 different oligonucleotides in a 1.28 × 1.28 cm area. Another advantage of this approach is that the high information density allows the use of probe redundancy to check results and provides an extensive series of controls. Disadvantages of this format are that careful development is required to produce a single reliable microarray, and it is not possible to produce custom-built arrays rapidly. For some applications, hybridisation of only one labelled target to the array is recommended, which prevents direct comparison between two samples in a single experiment. The arrays are also expensive, limiting access by academic institutions.
Image analysis
[image:2.612.60.297.92.269.2]Filter arrays hybridised to radiolabelled targets can be monitored by phosphorimager systems. Glass DNA arrays and high-density oligonucleotide arrays hybridised
Figure 1
Filter microarrays hybridised to [α-33P]-labelled cDNA probes prepared
from 50–100 ng of poly(A)+mRNA from a human cell line (a)before
to Cy3- and Cy5-labelled probes are usually monitored by commercial readers that typically use laser confocal fluo-rescent scanning or computer-controlled digital camera systems (CCD). The highly regular arrangement of probes in an array facilitates extraction of information by digital imaging processing software packages. The software packages usually have facilities for semi-automatic identifi-cation of probe spots and several methods for processing and presenting the raw data on the fluorescence intensities obtained for each individual pixel within the spot. Informa-tion on some of the currently available systems is provided in [1] and is available at the websites listed in Table 1.
Selection of the gene set
When analysing expression profiles, it is important to select an appropriate gene set. Ideally, all the genes in the genome would be present in the array, but this is currently only pos-sible for certain lower organisms such as the yeast
Saccha-romyces cerevisiae. Only around 7,000 human genes have
been identified by conventional approaches to gene discov-ery, compared to the predicted total of 50,000 genes. An alternative strategy for gene discovery involves the large-scale sequencing of expressed sequence tags (ESTs) ran-domly selected from cDNA libraries prepared from many different human tissues and cell lines. The IMAGE
[image:3.612.314.555.451.652.2]consor-tium, the Cancer Genome Anatomy Project (CGAP) and the Institute of Genomic Research (TIGR) have each made major contributions to this sequencing project.
Table 1
Microarray Worldwide Web links
Genes and ESTs
IMAGE consortium http://www-bio.llnl.gov/bbrp/image/image.html Cancer Genome Anatomy Project (CGAP) http://www.ncbi.nlm.nih.gov/CGAP
CGAP EST database http://ncbi.nlm.nih.gov/dbEST/index.html
UniGene resources http://www.ncbi.nlm.nih.gov/UniGene
Purchasing UniGene clones http://image.llnl.gov/image/html/idistributors.shtml ESTs identified by the Institute of Genomic Research (TIGR) http://www.tigr.org
Research Genetics http://www.resgen.com/index.php3
Incyte http://www.incyte.com
Ensembl resources http://www.ensembl.org
Microarray laboratories
Ed Southern http://www.bioch.ox.ac.uk/rgroups/rgroupslist.asp Pat Brown laboratory http://cmgm.stanford.edu/pbrown/index.html National Human Genome Research Institute (NHGRI) http://www.nhgri.nih.gov/DIR/LCG/15K/HTML Vivian Cheung Laboratory http://w95vcl.neuro.chop.edu/vcheung
Albert Einstein College of Medicine http://sequence:aecom.yu.edu/bioinf/funcgenomic.html Institute of Cancer Research http://wyvis.icr.ac.uk
Company links
Affymetrix http://affymetrix.com
Chroma http://chroma.mbt.washington.edu/hood-www/
Incyte http://www.incyte.com
Molecular Dynamics http://www.mdyn.com
Genometrix http://www.genometrix.com
Hyseq http://www.hyseq.com
BioRobotics http://www.biorobotics.co.uk
General Scanning http://www.genescan.com
Gene Logic http://www.genelogic.com
Bioinformatics links
Stanford Link Page http://genome-www4.Stanford.EDU/MicroArray/SMD/restech.html
Figure 2
A program called UniGene has been used to identify clus-ters of overlapping EST contigs (continuous runs of sequence) that represent a unique gene set, and represen-tatives of each cluster are commercially available as the UniGene set from selected companies including Genomic Solutions and Research Genetics. Genomic Solutions has also been able to extend its set via access to information from Incyte, a commercial organisation that has sequenced more than 3 million ESTs, producing a sequence-verified set of over 10,000 genes. The program Ensembl, which continuously scans the nearly completed human genome sequences obtained as part of the Human Genome Project and combines information from EST databases and predic-tion algorithms, has already identified more than 35,000 putative genes. The website addresses providing detailed information on EST sequences, the UniGene sets and Ensembl predictions are listed in Table 1.
Genetic gains and losses
Variation in gene dosage through either amplification or deletion of genomic regions is a frequent feature of human cancer. Amplification of genomic regions is believed to result in the overexpression of genes that drive tumour development and/or are involved in conferring drug resis-tance. In breast cancer, an amplification event at 17q results in overexpression of the CERBB2gene; amplifica-tion at 12q13–15 can cause overexpression of the MDM2
and CDK4 genes; and several different genes including
AIB1, ZNF217 and BTAK have been proposed to
corre-spond to the gene driving an amplification event found at 20q13 [20–22]. Amplification events in breast cancer have attracted particular attention because they can often be used as clinical markers of tumour behaviour [23–25], as in studies on ERBB2amplification.
The technique of comparative genomic hybridisation (CGH) was developed to monitor genome-wide variations in DNA copy number. In this technique, differentially labelled test DNAs from a tumour and from normal tissue are co-hybridised to metaphase chromosomes [26]. The relative levels of hybridisation of test and control probes can indicate loss, gain or amplification of specific genomic regions. The resolution of this technique is poor, probably in the region of 10–20 megabases (Mb). The use of microarrays of mapped cDNAs or genomic clones (for example, bacterial artificial chromosomes [BACs]) instead of metaphase chromosomes as the probe for hybridisation offers the prospect of dramatically increasing the tion of the CGH studies. In such investigations, the resolu-tion would simply be determined by the genomic map distance between arrayed DNA segments.
The utility of this approach was first shown by Pinkel et al
[27] who carried out CGH studies on arrayed BAC clones from chromosomes 20 and X, with the chromosome 20 clones mapping at an average interval of 3 Mb along the
entire chromosome. Comparison of cells containing differ-ent copy numbers of DNA initially demonstrated that fluo-rescence ratios were proportional to copy number. Application of this technique to breast cancer yielded a high-resolution map of amplification at 20q13.2 in several cell lines, revealing the presence of three distinct regions of amplification. Previous work had discounted two of these regions as loci containing important cancer genes. However, the microarray studies revealed that both could be highly amplified and should therefore be reconsidered for their potential involvement in breast cancer develop-ment. In addition, the CGH analyses detected a short region of deletion. This deletion, which was in the same position as a recurrent deletion found in acute myeloid leukaemia, was confirmed by interphase fluorescence in situhybridisation (FISH) studies. On the basis of this analy-sis, Pinkel et alconcluded that, within the 20q region, mul-tiple regions may be altered during tumour development and the complexity of amplification events in breast cancer may be significantly greater than previously recognised.
Pollack et al [28] used arrayed cDNAs in a genome-wide analysis of DNA copy number changes. The rationale of this approach is that if the set of arrayed cDNAs is suffi-ciently large it should contain representatives of all regions of the genome. The ability of this technique to detect varia-tions in copy number was again initially confirmed in CGH studies using DNA from cell lines containing different numbers of X chromosomes. The procedure was then used to map chromosomal genes in the BT474 breast carcinoma cell line. The fluorescence ratios of hybridisa-tion to BT474 genomic DNA and normal female genomic DNA was determined for 3,360 cDNAs whose chromoso-mal positions had been located onto radiation hybrid maps. An example of such a result is shown in Figure 3. These analyses not only confirmed the presence of known amplification events on chromosomes 17q and 20q, but also detected many previously uncharacterised over-repre-sentations on 1q, 8q, 11q and 15q, as well as deletions on chromosomes 3p, 6q, 9p, 10q and Xq. The usefulness of this technique to identify novel amplified genes was demonstrated when it was applied to the analysis of the NGP neuroblastoma cell line, leading to the discovery of the amplification of the zinc-finger gene ZNF133on chro-mosome arm 20p [29].
Tumour classification
Microarray technology provides a method for monitoring the RNA expression levels of many thousands of genes simultaneously in primary tumours and cell lines. In princi-ple, data from such studies could revolutionise cancer diagnosis. The rationale behind this proposition is that the overall behaviour of a cancer must be determined by the expression of the genes within it. It should, therefore, be possible to identify sets of genes whose expression or lack of expression defines each individual property of a tumour,
commentary
review
reports
including its precise diagnosis and clinical behaviour. The potential of this approach was demonstrated by Golub et al[30] who determined the RNA expression profiles of a series of acute myeloid leukaemias (AML) and acute lym-phoblastic leukaemias (ALL). A class discovery program automatically identified the distinction between these leukaemia groups without prior knowledge of the diagno-sis. Using this data set, the program was then able to clas-sify new leukaemia cases. Alizadeh et al[31] extended this approach to the analysis of diffuse large B-cell lymphoma (DLBCL), the most common subtype of Hodgkin’s lym-phoma. Analysis of the microarray expression profiles led to the definition of two molecularly distinct categories of DLBCL. One subtype, which had a statistically significant better overall survival, had a gene expression profile char-acteristic of germinal B cells. The second subtype, which had poor prognosis, expressed genes normally induced fol-lowing in vitro activation of peripheral blood B cells. This study showed that microarray technology has the potential for identifying previously uncharacterised and clinically sig-nificant tumour subgroups. Interestingly, these analyses also highlighted the potential limitations of the microarray approach, as the two new DLBCL groups were not monomorphic. For example, within the group showing overall favourable prognosis, five patients in fact died within two years of diagnosis, whereas three patients from the poor prognosis group were alive after five years. The
authors proposed that more extensive microarray analyses might reveal additional markers that would improve the pre-dictive value of microarray profiling.
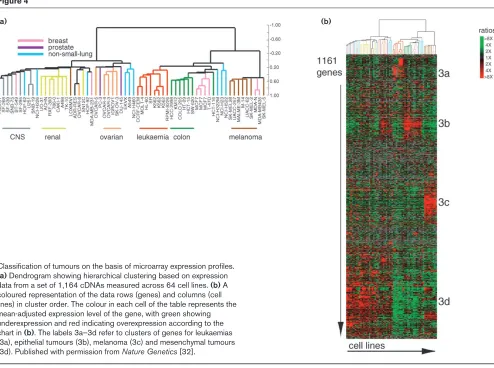
Ross et al[32] used cDNA microarrays to determine the expression of 8,000 genes within the 60 cell lines used in the National Cancer Institute screen for anticancer drugs (the NCI60 cell lines). When hierarchical clustering analy-sis was performed, cells of the same tissue origin usually grouped together. Clustering was observed for groups of cell lines derived from leukaemia, melanoma, the central nervous system, colon, kidney and ovarian tissue (Figure 4). However, lines derived from breast tissue were located in multiple distinct branches, suggesting a hetero-geneous pattern of gene expression. More specifically, the profile obtained for two related breast carcinoma cell lines, MDA-MB435 and MDA-N, that were derived indepen-dently from the same patient, was similar to that from melanoma cell lines (Figure 4). This suggested either that some breast cancers may have expression profiles exhibit-ing neuroendocrine features or that the cell lines are actu-ally derived from a melanoma.
A potential problem with the application of microarray tech-nology to primary human tumour specimens is that the spec-imens may represent mixtures of cell types. The presence of variable levels of normal cells, supporting stroma, blood vessels and lymphocytes in samples could mask expression patterns attributable to cancer cells. To investigate this issue, Ross et al[32] determined the microarray profiles of specimens of primary breast carcinoma. The samples expressed sets of genes in common with two breast-derived cell lines MCF-7 and T47D, stromal cells, and cells of haematopoietic lineage. This is consistent with the presence of stromal tissue and lymphocyte infiltration within the primary cancer specimens. Such a study indicates that, for optimal analysis of primary breast tumours, it may be neces-sary to microdissect tumour specimens to separate popula-tions enriched in cancer cells and/or to electronically remove signals believed to result from contamination with normal cells. Despite these potential pitfalls, microarray profiling has been applied to the gross analysis of primary cancer speci-mens. For example, using an Affymetrix GeneChip contain-ing 6,500 human genes, Alon et al [33] determined the expression profiles for a series of 40 colon adenocarcino-mas and 22 normal colon tissue samples. Clustering analy-sis demonstrated that cancerous and non-cancerous specimens could be readily distinguished.
[image:5.612.56.299.92.302.2]Sgroi et al[34] demonstrated that laser capture microdis-section (LCM) can be used to obtain high-quality microar-ray profiles from primary breast carcinomas. LCM was used to isolate purified populations of normal breast epithelial cells, invasive cells and metastatic cells from a single patient. Labelled cDNA targets were then hybridised to an array of 8,084 cDNAs. These studies identified genes
Figure 3
Comparative genomic hybridisation (CGH) on human cDNA clones microarrayed onto a glass slide. The slide was hybridised
simultaneously to normal DNA (green) and DNA from a breast cancer cell line (red). (a)Complete array of 6,000 cDNAs; (b)magnified region of the array showing the CERBB2gene (arrow). The red colour of this array point indicates that the CERBB2gene is amplified. Figure provided by Jeremy Clark.
that were differentially expressed in normal, invasive and metastatic cells, and the differences in expression were verified by real-time quantitative polymerase chain reaction (PCR) and by immunohistochemistry. Genes found overex-pressed in invasive and metastatic disease compared to normal tissue included the breast cancer susceptibility gene BRCA1 and genes for apolipoprotein D, annexin I and the chemokine RANTES.
Thirteen grade II–III grossly dissected infiltrating breast ductal carcinoma specimens were also examined as part of this study. Several clusters of genes showing altered expression were detected. A cluster of genes involved in cellular proliferation was highly expressed in a subset of tumours and a correlation was observed between the level of expression of these genes as determined in the microar-ray studies and the number of cells positive for the Ki-67 proliferation-associated antigen. The patterns of expression were also consistent with the presence of lymphocytes and stromal cells in the primary tumour specimens. The inter-feron-regulated gene cluster identified in studies of cultured mammary epithelial cells was highly expressed in some tumours, moderately in others, and was silent in others.
Perou et al [35] obtained microarray portraits of a set of 65 surgical specimens of human breast tumours from 42 individuals. There was considerable variation in the pattern of gene expression among the tumours. This variation could be partly due to changes in the levels of certain cell types within the tumours, such as endothelial cells, stromal cells, adipose-enriched normal breast cells, B and T lymphocytes and macrophages. Once genes character-istic of these cell types had been excluded, the authors selected a subset of 496 genes, called the ‘intrinsic’ gene set, that still showed considerable variation in expression levels between different tumours. When variations in level of expression within the genes were used to order the tissue samples, a striking division of the tumours into oestrogen receptor (ER)-positive and ER-negative cate-gories occurred. Interestingly, the ER-positive group was characterised by the expression of many genes specific to breast luminal cells. The ER-negative tumours could be further divided into several subgroups. A subgroup of six tumours had an expression pattern characteristic of breast basal (myoepithelial) cells, whereas another subgroup was partially characterised by high expression levels of genes associated with overexpression of the ERBB2oncogene.
commentary
review
reports
[image:6.612.60.554.91.459.2]primary research
Figure 4
(a) (b)
On the basis of these results the authors suggested that we are far from a complete understanding of the diversity of human breast tumours.
Drug discovery and development
Microarray technology can, in principle, provide many types of information to help drug discovery and develop-ment. In their simplest application, microarrays can be used to screen for changes in gene expression following exposure of tumour cells to drugs either in culture or in patients following treatment. Studies of this type may provide information on the precise mechanism of action of the drug or could lead to the identification of early markers of drug response. For predicting the longer-term clinical response to drug treatment, microarray information could also yield information about possible side effects, and identify markers that, in a clinical context, could be used to predict possible adverse events. This technology can also provide information for identifying and validating new ther-apeutic targets (reviewed in [36]).
Scherf et al [37] used microarrays to determine the expression profiles of 9,703 genes in the NCI60 cell lines. To dissect the mechanisms of drug action, they combined the database of gene expression data obtained in this study with molecular pharmacology data that had been obtained using the same cell lines. They constructed a dendrogram of relationships between a set of 188 drugs based only on the activity pattern of the drugs against the NCI60 cell lines. Five large drug clusters were obtained, corresponding to different mechanisms of drug action: DNA and DNA/RNA antimetabolites; tubulin inhibitors; DNA-damaging agents; topoisomerase I (Top1) inhibitors; and topoisomerase 2 (Top2) inhibitors. When data from gene expression and drug activity patterns were used together to construct the dendrogram, however, many of the clusters were altered. In some cases, the changes were not clearly related to known mechanic or metabolic characteristics of the drug, suggesting the existence of hitherto unsuspected biological relationships between drugs that remain to be unmasked. In other cases, the changes could be interpreted on the basis of our current knowledge of the drug. For example, for the topoiso-merase inhibitors, mechanistic distinctions between indi-vidual drugs were revealed: Top1 inhibitors that did not required activation clustered together, whereas prodrugs formed a distinct group. In addition, a subgroup of the Top2 inhibitors, including mitoxanthrone and oxanthrazole, clustered close to porfiromycin and mitomycin, suggesting that the ability to induce double-stranded DNA breaks may be a common feature of these drugs.
A good example of how the NCI60 data set can be used to generate new clinical hypotheses is provided by the analy-ses of the effects of 5-fluorouracil (5-FU), which is used to treat both colorectal and breast cancer. The NCI60
microarray data unveiled a very strong negative correlation between the level of dihydropyrimidine dehydrogenase (DPYD) mRNA and the potency of 5-FU, with most of the lines deficient in DPYD showing high levels of sensitivity to 5-FU [37]. Indeed, DPYD catalyses the rate-limiting step in the catabolism of uracil, thymidine and 5-FU, so tumours with high levels of this enzyme are expected to show resis-tance to 5-FU. These observations suggested that DPYD should be investigated further as a possible marker of response of breast and other cancers to 5-FU.
Marton et al [38] used a yeast model system to validate drug targets and identify secondary drug targets. The method was applied to FK506 and cyclosporin A (CsA), drugs that inhibit calcineurin activity in both mammalian and yeast cells and are used clinically as immunosuppres-sants. Calcineurin is a highly conserved calcium- and calmodulin-activated serine/threonine protein phos-phatase that is required in yeast for intracellular ion home-ostasis, regulation of the onset of mitosis, and response to mating pheromone. Treatment of wild-type S. cerevisiae
by FK506 or CsA resulted in a signature pattern in which the levels of expression of a small group of genes (36 for FK5076) were altered more than twofold. A very similar signature pattern was found in an untreated yeast mutant that had deletions of the genes encoding calcineurin cat-alytic subunits, demonstrating the equivalence of removal of calcineurin function by either drug action or genetic deletion. To assist target validation, a second or ‘decoder’ step was used in which the yeast strain mutated in the proposed target gene is treated with the drug. If the mutated gene encodes a protein involved in the pathway targeted by the drug, the microarray signature pattern should not be altered. Application of this ‘decoder’ strat-egy to FK506 and CsA confirmed that their characteristic signature pattern was not observed in the strain with the mutated calcineurin genes when exposed to these drugs.
To investigate secondary drug effects, wild-type yeast strains were exposed to higher doses of FK506 and CsA, leading to much more complex alterations in microarray expression profiles. Significantly, many of the new alter-ations in expression were also observed when strains har-boured mutations in calcineurin genes, indicating that they resulted from secondary drug effects in calcineurin-inde-pendent pathways. Further investigation revealed that FK506 may have several other targets, including the drug efflux pump PD45 and a pathway involving the transcrip-tional activator Gcn.
resemble those resulting from perturbation of the ergos-terol pathway. Biochemical analysis subsequently indi-cated that the sterol C-8 isomerase Erg2p within this pathway may represent the drug target in yeast. The human homologue of Erg2p is known as the sigma recep-tor, a neurosteroid-intracting protein that regulates potas-sium conductance and binds to known neuroactive drugs. It was therefore proposed that the anaesthetic properties of dyclonine in humans may be mediated by its binding to the sigma receptor.
A yeast model system has been used to investigate the mechanism of action of fluaropiridol and a purvalanol ana-logue called compound 52, which inhibit human and S.
cerevisiae cyclin-dependent kinases (CDKs) [40].
Sixty-two transcripts were identified whose levels changed more than twofold in wild-type yeast in response to treatment with either drug. They included groups of genes involved in cell-cycle progression (CLB1, CLB2, HTA2, HTB2 and
EGT2) and phosphate metabolism (PHO80, PHO81,
PHO84, PHO5, CTT2, HSP12 and UBI4). These two
groups of alterations were entirely consistent with the demonstrated ability of compound 52 to inhibit both the cell-cycle-regulating kinase Cdc28p and the Pho85p kinase, which is involved in phosphate metabolism.
Using a filter microarray of 4,132 genes and 32P-labelled targets, Clarke et al [41] investigated alterations in gene expression pattern in human colon cancer cell lines follow-ing inhibition of signal transduction by 17-allylamino-17-demethoxygelanamycin, an inhibitor of the molecular chaperone, heat-shock protein 90 (HSP90). Biochemical studies demonstrated that treatment of each of four colon cancer cell lines resulted in depletion of RAF1 and AKT proteins and inhibited signal transduction. The array studies revealed that the genes for HSP70, HSP90B and caveolin were upregulated, whereas the genes for keratins 8 and 18 were consistently downregulated. Interestingly, expression of genes for the protein clients of HSP90 was not affected by drug treatment. The authors suggest that these genes could be used as possible molecular markers of drug action in clinical trials.
Mutation detection
As the Human Genome Project nears completion and alterations in more genes become implicated in human pathology, there will be a growing demand for techniques allowing high-throughput resequencing of genomic DNA. In the breast cancer field, there is already a requirement for large-scale population-based detection of inherited mutations within genes such as BRCA1, BRCA2, P53
andCHK2, which predispose towards the development of this disease. Such studies could provide information on the prevalence of particular classes of mutations and, through the collection of epidemiological data, shed some light on the possible role of aetiological agents in cancer
development. Large-scale screening studies on new genes found to be somatically mutated in breast cancer might lead to the identification of molecular diagnostic markers and, through analysis of mutational spectrum, provide clues to the possible role of chemical exposure in breast cancer development.
Affymetrix arrays for comparative sequencing
Several microarray-based strategies have been developed to facilitate large-scale comparative sequencing. Hacia et al [42,43] have described a ‘gain-of-hybridisation signal’ approach to identification, in which the arrays contain large sets of oligonucleotides complementary to all possi-ble sequence changes under investigation. Hybridisations are performed under conditions in which fluorescently tagged target DNA only binds to wild-type and mutant oligonucleotides that are exactly complementary to its sequence, leading to a gain-of-hybridisation signal at selected oligonucleotide positions. The Affymetrix array for identifying mutations in the BRCA1 gene contains over 96,000 dimers corresponding to wild-type sequences and all possible single-base substitutes, single-base insertions and 1–5 base pair (bp) deletions. To detect substitution mutations, the array contains four oligonucleotides for each position in the BRCA1 sequence. One oligonu-cleotide is precisely complementary to the wild-type sequence, whereas the remaining three are complemen-tary to the three possible substitution mutations at that position. To maximise the discrimination of hybridisation of target sequences to the oligonucleotides, the base being interrogated is positioned in the centre of the oligonu-cleotide. Hybridisation to the array is then performed using a two-colour system to provide a direct comparison between wild-type sequence and the test sample poten-tially containing a mutant sequence. The strategy is shown in Figure 5a. Disappointingly, only four of the fourteen
BRCA1 mutations examined could be detected by this
method. An example of the results obtained by Hacia et al
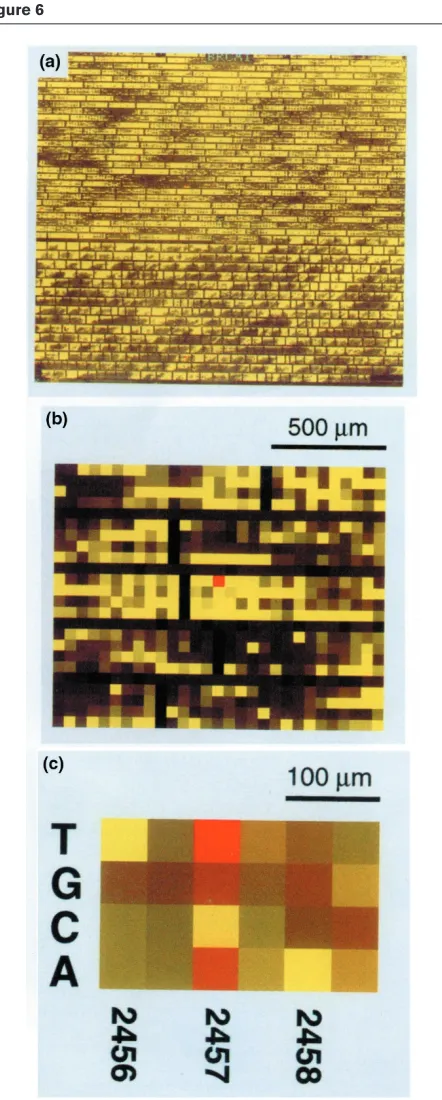
[42] is shown in Figure 6.
Hacia et al [42] also utilised a ‘loss-of-signal’ analysis to glean additional information from the BRCA1 Affymetrix array. In this approach, changes in the signal ratio between test and wild-type target samples are monitored (Figure 5b). Homozygous loss (complete loss of wild-type sequence) in the test sample should result in total removal of the hybridisation signal, whereas heterozygous muta-tions should cause a 50% reduction in signal intensity. Whereas this strategy does not, unfortunately, provide information on the nature of the mutations, the sensitivity of detection is improved, as 14 of the 15 BRCA1 muta-tions screened were detected.
Affymetrix arrays have now been used to interrogate
BRCA1 and BRCA2 and gene sequences from human
mitochondria, P53 and the human immunodeficiency
commentary
review
reports
virus (HIV) [3,42–47]. For example, analysis of germline
P53 mutations in 42 breast cancer families using these arrays identified three families with a G to C base change at nucleotide 13,964 [45]. A significant chal-lenge for this technology is to develop assay conditions where an even hybridisation of targets to attached oligonucleotides is achieved, irrespective of the base composition of the sequence (the GC:AT ratio). To address this issue, Hacia et al [19] incorporated modi-fied bases into target sequences and found that targets containing 5-methyluridine gave a more even signal and retained hybridisation specificity.
Minisequencing assay
High-density oligonucleotide chips have some potential drawbacks, such as low sensitivity in the gain-of-hybridisa-tion strategy and high background and problems in achieving even hybridisations across all sequences inde-pendently of the GC:AT composition. To overcome these problems, alternative microarray-based sequencing strate-gies have been developed. In the ‘minisequencing’ assay (reviewed in [48]), target hybridisation is combined with an enzymatic primer extension assay. Oligonucleotides are attached to the surface by their 5′ends, leaving free 3-OH groups. Following hybridisation to the test DNA, the attached oligonucleotide acts as a primer for nucleotide incorporation at the 3-OH, using the hybridised test DNA as a template (Figure 5c). The extension reaction contains a mixture of four dideoxyribonucleoside triphosphates, each tagged with a distinct fluorescent label. The pres-ence of dideoxyribonucleotides ensures that only a single fluorescently tagged nucleotide is added to each 3′-OH group, so that the identity of the tagged nucleotide that becomes covalently attached to each oligonucleotide can be monitored by fluorescence microscopy. To scan both strands of a sequence of length Nusing this approach the array must contain 2Noligonucleotides, each with its 3′ -OH immediately preceding the base to be interrogated. It is important to note that Affymetrix chips are not suitable for microsequencing because the oligonucleotides are attached to the surface through their 3′-OH ends.
Universal DNA microrarrays
A universal DNA microarray method may be used for high-throughput detection of small groups of previously charac-terised mutations [49–51]. In this procedure, the PCR-amplified target gene sequences are annealed to two oligonucleotides (called the upstream and down-stream LDR primers) that complement immediately adja-cent regions in the genomic DNA flanking the nucleotide under investigation. The two annealed primers are then subject to a ligase detection reaction (LDR) that links the two oligonucleotides if, and only if, the correct base paring is present at the junction (Figure 5d). The upstream allele-specific LDR primer contains a nucleotide complementing the mutant sequence being interrogated at its most 3′end
and a ‘zip code’ sequence composed of a six tetramer repeat, for example (CGTT)6, at its 5′ end. The down-stream LDR primer contains a fluorescent tag that becomes covalently joined to the oligonucleotide contain-ing the zip code sequence if ligation is successful. Four different upstream primers, each containing a unique zip code sequence and a different base at their 3′ ends are used to screen for substitution mutations at each nucleotide position. After the LDR step, the unique zip code sequences are used to direct the LDR products con-taining the fluorescent tag to specific complementary zip code address sequences attached covalently in an array format to a glass microscope slide (Figure 5e). For example, the zip code address (AACG)6 attached to the glass surface would be used to bind the (CGTT)6 oligonu-cleotide zip tag mentioned above. The technique is referred to as ‘universal’ DNA microarray analysis because the arrayed zip code addresses remain constant and their complementary zip code tags can be attached to any set of LDR primers. This approach can detect mutation with extreme selectivity, even when the mutant sequence is only present at low abundance (down to 1:200). This technique has been successfully applied to the detection of point mutations in KRAS and P53in human tumours and to the detection of small insertions and deletions in
BRCA1and BRCA2[49,50,52].
Determining the function of normal or
mutated genes
Gene function may be monitored by examining the pertur-bations of gene expression after introduction of either normal or mutated genes. Studies involving, for example, transformation of NIH3T3 cells by the PAX-FKHR onco-genes revealed activation of the myogenic transcription programme involving upregulation of genes for the tran-scription factors MyoD, myogenin, Six and Slug, as well as many other genes involved in muscle function [53].
BRCA1encodes a protein that has been implicated in the
cellular response to DNA damage. Affymetrix GeneChip arrays were used to monitor altered gene expression fol-lowing induced expression of BRCA1in U20S osteosar-coma cells and in MDA435 breast cancer cells [54].
BCL1 was constitutively expressed in these cells to prevent apoptosis, which usually occurs after introduction
of BRCA1. Twenty-three genes and ESTs had increased
An array of 6,416 genes was used to investigate the effects of the overexpression of the proto-oncogene
CMYC in primary human fibroblastomas [55]. Following retroviral infection with a construct expressing CMYC, 27 genes were consistently upregulated and 9 were
consis-tently downregulated [56]. The downregulation of the extracellular matrix proteins fibronectin and collagen and of the cytoskeletal protein tropomyosin indicated that
CMYC may have a role in modulating cell adhesion and cell structure. Several cell-cycle genes were identified as
commentary
review
reports
[image:10.612.57.554.92.642.2]primary research
Figure 5
targets, including those for cyclin D2 and the cyclin-depen-dent kinase-binding protein CKSHS2, which were induced, and the P21Gp1gene, which was repressed. Identification of the gene encoding the tumour necrosis factor receptor-associated protein TRAP1 as a target suggested a poten-tial link to an apoptosis-associated pathway. The results were compared to data obtained using the same microar-ray in experiments in which HL60 cells were induced to undergo differentiation by exposure to phorbol ester (TPA), a process that involves rapid downregulation of MYC
expression. Notably, 17 of the 27 genes upregulated fol-lowing CMYCexpression in human fibroblasts were down-regulated in this experiment, providing further evidence for the role of CMYCin their regulation.
Induction of p53 expression from a metallothionein pro-moter in the p53-deficient colon-derived EB1 cell line results in cell death by apoptosis within 1–4 hours. Microarrays were used to identify 161 genes whose expression was altered more than threefold following p53 induction [57,58]. These genes could be divided into eight clusters with distinct expression kinetics following p53 induction, and into several distinct functional groups, such as genes involved in cell regulation (P21, GADD45
and GOS8), apoptosis (FAS, KILLER), oxidative stress (PIG3, genes for neutrophil NADPH oxidase and superox-ide dismutase 3), cell structure (genes for collagen and NRP/B nuclear matrix protein), signal transduction (ECK,
P2XM, EPR1, ACK, HSR1, ARL2, C/EBPα, TGF-α) and
oncogenes (genes for endothelin 2 and thrombospondin).
Response to radiation
Amundson et al [59] identified 48 sequences whose expression was changed when the ML-1 human myeloid cell line, which contains wild-type p53, was treated with ionizing radiation. Many of these transcripts were not known to be induced by radiation exposure. Analysis of a subset of these genes in a series of 12 cell lines, including the MCF7 and T47D breast cancer cell lines, following exposure to ionizing radiation, UV radiation or methyl-methanesulphonate (MMS) treatment revealed a heteroge-neous response pattern with the exception that expression of the ATF3gene was consistently upregulated following UV or MMS treatment. ATF belongs to the ATF/CREB family, whose members can homodimerise to repress tran-scription from promoters containing ATF-binding sites.
[image:11.612.66.287.87.637.2]ATF3can be induced following stresses such as exposure to carbon tetrachloride (CCl4), alcohol intoxication and wounding, and may have a key role in modulating cellular response to radiation and chemical exposure. The studies also provided evidence that a second gene, FRA1,was involved in the p53-associated response to radiation treat-ment. Following γ-irradiation, expression of this gene was upregulated in MCF7 breast cancer cells that contain wild-type p53, but no response was observed in MCF7/E6 cell lines, which lack wild-type p53 function.
Figure 6
The use of an Affymetrix DNA microarray to sequence the BRCA1 gene. The array is hybridised with a mixture of normal DNA (green) and test DNA from a carrier of the BRCA1mutation (red). Equal
hybridisation to the two probes gives yellow. (a)Composite image of hybridisation to normal control and test DNA. (b) Magnification of the region surrounding the 2,457 C→T mutation. (c)Close-up of the probe sets surrounding the 2,457 C→T mutation. The bright red signal online indicates the presence of the mutation. Published with
In a more extensive investigation of the mechanism of radi-ation-induced apoptosis using a 11,000-gene microarray, Voehringer et al [60] compared expression profiles in apoptosis-sensitive and apoptosis-resistant mouse B-cell lymphomas, both before and after exposure to 5 Gy of
γ-irradiation. In these studies, 184 genes were uniquely induced following irradiation in the apoptosis-resistant line, and 617 were uniquely induced in the apoptosis-sen-sitive line. One interesting cluster of genes induced in the apoptosis-sensitive cells disrupts normal mitochondrial function. These included Vdac-1, which has been recog-nised to be part of the permeability transition (PT) pore, which has a central role in controlling apoptosis, and
Ucp-2, which is believed to be involved in uncoupling
electron transfer from oxidative phosphorylation. As Ucp-2
expression peaked before apoptosis-associated mitochon-drial changes, it was proposed that Ucp-2may have a role in regulating apoptosis. These studies also identified a pathway involving the expression of a family of Fabp (fatty-acid-binding protein) genes that may be important in pre-venting apoptosis in the resistant line. The upregulation of FABP proteins is significant, because they bind fatty acids such as retinoic acids, which can function as signals for differentiation as well as for apoptosis. The authors propose that FABPs may have a specific role in sequester-ing fatty acids that act as apoptotic signals. An alternative explanation is that they may act as scavengers that bind to the oxidised fatty acids generated during oxidative stress, thus terminating a cascade of lipid peroxidation which may represent an early step in commitment to apoptosis.
Subcellular fractionation
Subcellular fractionation may be combined with microarray technology to investigate gene function. This approach has been used to identify eukaryotic mRNAs that are translated in the absence of the cap-binding complex eIF4F [61]. Most eukaryotic mRNA needs a functional cap-binding complex for efficient translational initiation. However, a few cellular RNAs and transcripts produced from hepatitis C virus and picornaviruses can function even in the presence of low levels of eIF4F. Polyribosomes were first prepared from human cells depleted for eIF4F. Analysis of the polyribosome-associated mRNA on microarrays showed that approximately 200 of the 7,000 microarrayed genes remained associated with the polyri-bosome, including the MYC and PIM1 proto-oncogenes and genes for immediate early transcription factors, kinases and phosphatases.
Subcellular fractionation has also been used by Diehn et al [62] to identify secreted and membrane-associated gene products. mRNA species bound to membrane-asso-ciated polysomes were first separated from other cytosolic mRNA by sedimentation. The different fractions were then used to prepare labelled cDNA probes that were hybridised to microarrays. Based on these analyses, 275
human gene and 285 yeast genes were identified that potentially encoded previously unrecognised secreted or membrane-associated proteins [63].
Gene deletion
Gene deletion or inactivation, for example by the produc-tion of knockout mice or mutaproduc-tions, may also be combined with microarrays to investigate gene function. An elegant demonstration of the power of this approach was provided by Hughes et al [39], who used a yeast microarray to compile a database of expression profiles for 300 muta-tions and chemical treatments. Analysis of the 300 profiles present in the compendium identified groups of co-regu-lated transcripts as well as groups of experiments with similar profiles, and it appeared that different mutations affecting the same cellular process in general displayed related profiles. To determine the function of novel yeast genes, the profile caused by deletion of the uncharac-terised gene was then compared to the compendium. Using this approach, this group identified and experimen-tally verified the involvement of new genes in cell wall function, mitochondrial respiration and protein synthesis.
Treatment by agents that induce growth and
differentiation
A very simple experimental design involves the analysis of alteration of gene expression profile following exposure of cells to growth factors or agents that induce differentiation or apoptosis. Perou et al[64] utilised a glass-based array system to analyse the gene expression patterns of mammary epithelial cells grown in culture and subjected to a variety of experimental perturbations. Epithelial cells were treated with transforming growth factor-β1 (TGF-β1), interferon-α (IFN-α) or IFN-γ, and were also subjected to withdrawal of epidermal growth factor (EGF). The effects of senescence and growth in Matrigel were also exam-ined. Analysis of the data by hierarchical clustering revealed that reduction in cell proliferation rate, which occurred with several of the treatment protocols, was associated with alteration in expression levels of a specific set of genes involved in cell-cycle progression, including
MCM2, MCM3, MCM6 (cyclin B), and Ki-67.When
cul-tures became confluent or underwent senescence, many interferon-regulated genes were consistently induced, for example those for (2′-5′) oligoadenylate synthetase E, interferon-induced 17 kDa protein and Stat1. Induction of transcription from this gene set is modulated by the JAK/STAT signalling pathway, and Perou et al suggest that reaching confluence and undergoing senescence both result in activation of this pathway.
Particular attention has been directed to the analysis of leukaemias and T- and B-cell responses. For example, Rusiniak et al [65] examined the effects of retinoic acid (RA) on leukaemia cells engineered to contain a fusion of the retinoic acid receptor-αgene (PML-RARαconstructs),
commentary
review
reports
the gene fusion that characterises acute promyelocytic leukaemia. They identified B94, originally isolated as a gene inducible by tumour necrosis factor-α (TNF-α) in endothelial cells, as a gene induced by RA exposure. Expression arrays have been used to investigate the mechanism of T-cell and B-cell stimulation [66–68]. Teague et al[67] showed that T-cell activation was asso-ciated with considerable changes in expression profile compared to resting T cells and, as expected, many genes associated with cell division were activated. Rogge et al
[68] compared the gene expression profiles in T helper type1 (Th1) and T helper type 2 (Th2) cells in an attempt to unravel the genetic programme that controls the func-tional properties of these cells. This approach identified 15 differentially expressed genes encoding proteins involved in transcriptional regulation, apoptosis, proteoly-sis and cell adhesion and migration.
Iyer et al[69] examined the response of human fibroblasts to serum treatment using a 8,600 gene array. They found that the altered genes could be grouped on the basis of their temporary pattern of expression. For example, genes such as P27, KIP1, P57, KIP2and P18were expressed in quiescent fibroblasts but downregulated following fibroblast stimulation. One of the most striking features was the altered expression of many genes known to be involved in the physiology of wound healing, including genes involved in remodelling blood clots, promoting chemotaxis and activating neutrophils and T and B cells, promoting angiogenesis and promoting the migration and proliferation of fibroblasts and keratinocytes. Iyer et al pro-posed that the role of fibroblasts in the response to wounding is greater and more complex than had previ-ously been appreciated.
Extracellular interaction of plasma clotting factor VIIa (FVIIa) with tissue factor (TF) on the cell surface results in intracellular signalling, but it is currently unclear which of these signals initiates blood coagulation. Using a microar-ray approach, Pendurthi et al [70] examined changes in the transcriptional programme in human fibroblasts in response to treatment with FVIIa and noted that the genes encoding the extracellular matrix signalling protein CYR61 and connective tissue growth factor (CTGF) were upregu-lated in a time and dose-dependent manner. Other studies have looked at the response of HT1080 fibrosarcoma cells to interferon treatment [71], of HL60 cells to stimula-tion of the cannabinoid receptor [72] and of prostate cancer cells to androgen treatment [73].
Arrays were used to investigate the effect of inhibiting DNA methyltransferase by 5-aza-2′-deoxycytidine (5AC) in HT29 colon adenocarcinoma cells [74]. The studies revealed that 10 of 19 genes induced by 5AC were previously identified interferon-response genes. Whereas the expression levels of the interferon genes themselves remained unaltered,
biochemical studies show that STAT transcription factors and interferon signalling were upregulated. As interferons are growth inhibitors, this observation may explain the growth inhibition observed following 5AC treatment.
Tumour growth and progression
Several distinct approaches have been used to examine tumour growth and progression. Hilsenbeck et al[75] used a xenograft model system to investigate changes in gene expression during the development of acquired tamoxifen resistance in the human MCF-7 breast carcinoma cell line. MCF-7 cells were injected into the mammary fat pads of athymic mice that had been supplemented with an oestro-gen pellet to allow the tumour cells to grow. When the pellet was removed and the animals treated with tamoxifen, the tumours shrank and remained stable for several months before developing resistance to tamoxifen and resuming growth. Expression patterns were determined for the origi-nal oestrogen-stimulated tumours (OS) before tamoxifen treatment, for the tamoxifen-sensitive (TS) tumours during tamoxifen treatment but before acquired resistance, and for the tamoxifen-resistant (TR) tumours following growth resumption. Two of the genes, ERK2 and HSF1, whose expression altered during the transition from OS to TR, were selected by western blot analyses. The western blot data agreed with the array data: HSF1 protein, which is involved in the cellular response to stress was upregulated in TS cells compared to OS cells and downregulated in TR cells; expression of the kinase gene ERK2increased in the TS tumours relative to OS tumours.
To study the effect of infection of keratinocytes by human papilloma virus type 31, Chang and Laimins [76] used an array containing 7,075 genes and ESTs. They identified 178 upregulated genes and 150 downregulated genes. Although no specific pattern of alteration was identified, the authors highlighted the fact that Stat1, a transcription activator with a role in mediating the response to interferon, was repressed. Bubendorf et al [77] used microarrays to identify differentially expressed genes in hormone-refrac-tory human prostate cancer. Differential expression between hormone-refractory CWR22R prostate cancer xenografts and xenografts of the parental hormone-sensi-tive CWR22 strain was examined using a 588 cDNA Clon-tech filter microarray. These analyses identified 10 overexpressed genes. They included the genes for insulin-like growth factor binding protein 2 (IGFBP2), the insulin receptor, insulin-like growth factor 3 (IGF-3) and HSP27, as well as 14 underexpressed genes. Tissue arrays were then used to analyse the expression of IGFBP2 and
HSP27in 238 primary human prostate cancers. A strong
association between increased IGFBP2 and HSP27
The same Clontech microarray was used to identify genes that had altered expression in prostate cancer compared to normal prostate tissue [78]. The filter was indepen-dently hybridised to 32P-labelled targets prepared from three separate prostate tumours and from normal tissue. Sixteen genes were found to be altered in at least two of the three tumours. With the exception of the gene for glu-tathione-S-transferase 1, however, reverse transcription-polymerase chain reaction (RT-PCR) studies could not confirm differential expression. Expression profiles were also collected for LNCaP cells grown in the presence and absence of the androgen analogue R1881. Androgen treatment appeared to cause the upregulation of several genes including HSP27, DBI (diazepam-binding inhibitor),
DAD1 (defender against cell death) and NME-2 (non-metastatic cell 2 antigen) as well as the transcription factor genes EGR-1, GATA2 andCJUN.
Alternatively, it is possible to construct custom-made microarrays tailored to suit specific investigations. To investi-gate gene expression in prostate cancers, Carlisle et al[79] constructed a microarray comprising 5,184 different cDNAs selected from the 35,000 prostate cDNA library-derived ESTs present in the database at the National Center for Biotechnology Information (Table 1). cDNAs for microarrays can also be preselected by cDNA subtraction. This approach was used by Villaret et al [80] to identify new tumour markers and vaccine candidates for head and neck squamous cell carcinomas (HNSCCs). A subtracted library enriched for expression in HNSCCs was prepared and arrayed on glass slides. When the slides were probed simul-taneously with fluorescently labelled probes prepared from primary HNSCC and from control tissues, the differentially overexpressed genes identified included those for keratins 6 and 16, laminin-5, plakophilin-1, matrix metalloproteinase-2, vascular endothelial growth factor, connexin 26, 14-3-3 sigma, CaN19, and four previously unidentified genes. A similar approach has been used to identify genes that are dif-ferentially expressed in human prostate cancer [81]. Yang et al [82] combined suppression subtractive hybridisation (SSH) with microarray technology to identify differentially expressed genes in positive (MCF-7 and T47D) and ER-negative (MDA-MB 23 and HBL100) breast cancer cell lines. SSH is based on the technique of representational dif-ference analysis (RDA) but modified to analyse mRNA abun-dance. SSH was first performed using ER-positive MCF-7 mRNA as a ‘tester’ and ER-negative MDA-MB-231 cDNA as a ‘driver’. A set of 332 cDNA clones which should be enriched for genes overexpressed in MCF-7 cells compared to MDA-MB-231 cells was identified and arrayed. When microarrays were hybridised to probes prepared from ER-positive and ER-negative breast cell lines, 10 clones were found to be overexpressed at least fivefold in ER-positive cells. The sequences included those for cytokeratin 19, GATA3, CD24 and glutathione-S-transferase γ-3, as well as several EST sequences and novel genes.
Similar approaches usually comparing tumour and normal tissue and sometimes incorporating cDNA subtraction have been used to examine progression in lung cancer [83], rhabdomyosarcoma [84,85], ovarian cancer [86], kidney cancer [87], melanoma [88], prostate cancer [78], Ewing’s sarcoma [89] and colon cancer [33].
Microarrays and developmental biology
Microarrays are powerful tools for dissecting programmes of organogenesis. Li et al [90] have investigated the role of the mouse homeobox gene GSH1, which is expressed in discrete domains in the ganglionic eminences, dien-cephalon and hindbrain during brain development. Trans-genic mouse technology was first used to construct immortal GSH1–/– null cell lines from developing braincells that normally express GSH1. The GSH1 gene was then reintroduced into the cells, and Affymetrix GeneChips were used to monitor alterations in gene expression. When 15 apparently differentially expressed genes were examined in northern blot analyses, around half appeared to represent display artefacts. Genes whose altered expression was confirmed included the
pro-α2 (I) collagen gene, which was downregulated, and the
PBX1 homeobox gene, GAS1(growth arrest specific 1) and ceruloplasmin genes, which were upregulated.
Lee et al[91] used microarrays to investigate the
mecha-nism of action of the WT1 Wilms’ tumour gene during kidney development. When introduced into U20S osteosarcoma cells, the WT1(+KTS) isoform induced apoptosis after 48 h, an effect that was not observed for the WT1(–KTS) isoform. Further analysis of alteration of gene expression induced by the WT1(+KTS) isoform using a 6,800 gene microarray identified 12 genes and ESTs that were upregulated, four of which were confirmed by northern analysis. The most striking alteration was a 74-fold induction of the amphiregulin gene which was accom-panied by lower low levels of induction were observed for
HSP70, P21CIP1 and the gene for acidic fibroblast
growth factor. Subsequent analysis showed that the in vivoexpression profile of amphiregulin mirrors the pattern of WT1 expression, that the WT1(+KTS) isoform can bind directly to the amphiregulin promoter, and that, in primary cultures of embryonic mouse kidney, amphiregulin can stimulate epithelial branching. These studies strongly indi-cate that a major role of WT1 is to act as a transcriptional activator of amphiregulin.
Work carried out by Phillips et al [92] demonstrated the way in which microarrays can be used to identify genes specifically expressed in stem-cell populations. A cDNA library from which housekeeping genes had been sub-tracted was first prepared from mouse fetal liver, the first tissue in development to contain significant numbers of haematopoietic stem cells. The library of 18,000 clones was then arrayed onto nylon membranes and genes that
commentary
review
reports
were differentially expressed either in fetal haematopoietic stem cells or adult bone marrow stem cells were identified by a variety of screening strategies. Four genes, including
CD27and three novel sequences, were overexpressed in both fetal and adult stem cells. Sets of genes that were predominant in either fetal or adult hematopoietic cells were also identified. The cytosine methyltransferase gene
Dnmt-3b and the variant histone gene macroH2A1.2
were, for example, highly overexpressed in fetal stem cells.
The use of microarrays in gene cloning
Microarray technology may be used to assist in positional cloning projects as illustrated by the recent identification of the gene responsible for insulin resistance in the spon-taneously hypertensive rat strain SHR [93]. To identify genes differentially expressed between SHR and insulin-sensitive controls, microrrays of rat cDNA clones were hybridised to targets from adipose tissue from the SHR strain, a congeneic SHR.4 strain and the parent BN strain. These experiments pinpointed clones encoding rat CD36 that showed substantially reduced hybridisation signals in the SHR strain. CD36mapped to the region of rat chro-mosome 4 associated with insulin resistance and encoded a fatty acid translocase, and its encoded product was completely missing from the SHR adipocyte plasma membrane. It was concluded from these studies that
CD36was the gene whose alteration was responsible for the insulin resistance.
The use of microarrays in toxicology
Microarray technology can, in principle, be used to study the toxicology of anticancer drugs and of environmental and dietary agents potentially involved in cancer develop-ment [97,98]. To facilitate these analyses, a so-called ‘ToxChip’ has been developed that contains most of the human genes known or proposed to be involved in toxico-logical responses. These include DNA replication and repair genes, apoptosis genes and genes involved in cellu-lar responses to polycyclic aromatic hydrocarbons (PAHs), dioxins, peroxisome proliferators, oestrogenic compounds and oxidants. The goal of these studies is to identify the patterns of alteration of gene expression char-acteristic of exposure to each class of toxicant in cultured human cells. Once signatures are identified, the patterns of altered gene expression induced by unknown agents might identify their likely mechanism of action. This approach could also be applied, with the equivalent rat or mouse gene arrays, to the investigation of responses to toxicants in rodent models. The aim would be to identify signatures for various types of tissue-specific toxicants, providing a more rapid test for the possible toxicological effect of drugs and less need to use animals.
It has been proposed that microarray profiling could be used to monitor environmental exposure to chemicals in humans. The rationale is that, as gene expression is a
sen-sitive end-point, alterations in microarray expression pro-files may act as useful biomarkers to define more precisely the nature and level of exposure to hazardous chemicals. Gene expression profiles in an exposed individual would be compared to control samples taken before exposure, for example, in an occupational health setting. Studies are currently underway to apply this approach to monitoring gene expression in peripheral blood in potential cases of extreme exposure to chemical toxicants, such as Polish coke oven workers.
Amplification of mRNAs for microarray
analysis
A problem with mRNA profiling by microarray is that up to 200µg of total RNA or 5µg of poly(A)+ RNA may be required to determine an expression profile, making analy-sis of small tumour lesions extremely difficult. In some cases, many smaller lesions can be pooled to make enough RNA. Amplification of poly(A)+RNA or cDNA can in principle increase detection by orders of magnitude [4,94–96]. For example, Wang et al[96] have developed a procedure to optimise amplification of small RNA samples. First, a 5′reverse transcriptase primer containing the T7 promoter sequence fused upstream of an oligodT sequence together with template switching is used to generate full-length cDNA molecules from the template RNA. Next, many hundreds of antisense RNA molecules are generated from each cDNA molecule using T7 poly-merase. Finally, the antisense RNA is reverse transcribed to produce fluorescently labelled cDNA that is hybridised to the microarray. One round of this amplification yielded a 103-fold amplification, and two rounds yielded 105-fold amplification. The microarray expression profiles obtained with amplified RNA were comparable to those obtained with the original RNA.