Rochester Institute of Technology
RIT Scholar Works
Theses Thesis/Dissertation Collections
11-1-2011
Characterizing adaptive capacity to climate change
in developing countries: a case study on Peru
Rosa Mitsumasu Heredia
Follow this and additional works at:http://scholarworks.rit.edu/theses
This Thesis is brought to you for free and open access by the Thesis/Dissertation Collections at RIT Scholar Works. It has been accepted for inclusion in Theses by an authorized administrator of RIT Scholar Works. For more information, please [email protected].
Recommended Citation
I
Characterizing adaptive capacity to climate change in
developing countries: a case study on Peru
By Rosa Mitsumasu Heredia
Master of Science in Sustainable Systems
Rochester Institute of Technology
II
Characterizing adaptive capacity to climate change in developing
countries: a case study on Peru
By Rosa Mitsumasu Heredia
This thesis is approved as a creditable and independent investigation by a candidate for the
Master of Science in Sustainable Systems degree at the Rochester Institute of Technology and is
acceptable for meeting the thesis requirements for this degree.
_____________________________
Nabil Nasr, Ph.D.
Golisano Institute for Sustainability Assistant Provost and Director
_____________________________
Thomas Smith, Ph.D.
Golisano Institute for Sustainability Interim Academic Director
___________________________
Callie W. Babbitt, Ph.D. Thesis Advisor
___________________________
Michael Thurston, Ph.D. Thesis Committee Member
___________________________
III
Dedication
I want to dedicate my Master Thesis to my parents who always supported my academic goals
and the pursuit of my lifelong dreams. To my Father, who inspired me with his work in
sustainability and my Mother, who encouraged me not just with her words, but most importantly
IV
Acknowledgements
This Master Thesis could not have been written without Dr. Callie W. Babbitt, who not only
served as my thesis advisor but also encouraged me throughout my academic career at RIT. Dr.
Babbitt challenged my thoughts on sustainability and climate change adaptation and inspired me
V
Abstract
Characterizing adaptive capacity to climate change in developing
countries: a case study on Peru
By Rosa Mitsumasu Heredia
VI
Table of Contents
Dedication ... III
Acknowledgements ... IV
Abstract ... V
Table of Contents ... VI
List of Abbreviations ... VII
List of Tables ... VIII
List of Figures ... VIII
1. Introduction ... 1
2. Literature review ... 4
2.1 Theoretical approach ... 4
2.2 Practical Approach - Modeling AC ... 8
3. Improving AC methodology for Domestic Policy ... 15
3.1 Goal and scale ... 16
4. Methodology ... 18
4.1 The Exploratory AC Model ... 19
4.2 Principal Component Analysis ... 32
4.3 Integrating Exploratory AC Model with PCA ... 37
4.4 Case Study ... 37
5. Results, Discussions and Broader Impacts... 41
5.1 Exploratory AC Model ... 41
5.2 Principal Components Analysis... 61
5.3 Integrating Results ... 64
5.4 Policy Implications and Broader Impacts ... 68
6. Weaknesses and limitations ... 70
7. Assessing Climate Change Challenges and Adaptation – Extending on AC Characterization ... 72
8. Conclusions and Extensions ... 76
VII
List of Abbreviations
AC - Adaptive Capacity
GDP - Gross Domestic Product
ICT - Information and Communications Technology
ICU - International Communications Union
IMS - Information Management Systems
INEI - National Institute of Statistics and Information (in Spanish)
IPCC - Intergovernmental Panel of Climate Change
MINSA - Health Ministry (in Spanish)
MPPAC - Model of Private Proactive Adaptation to Climate Change
NGO - Non-Governmental Organization
NRC - National Research Council
VIII
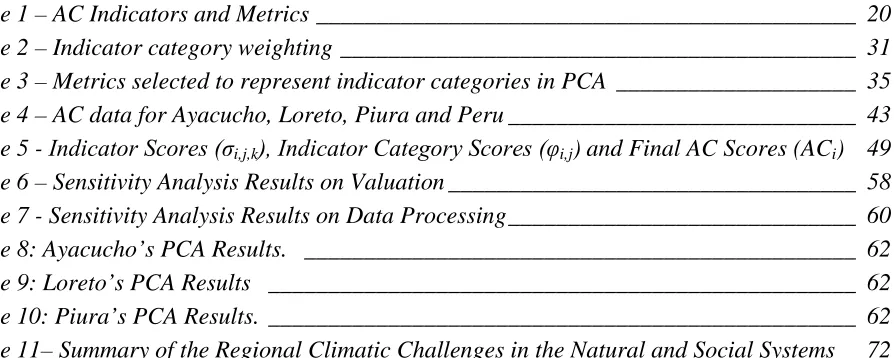
List of Tables
Table 1 – AC Indicators and Metrics _____________________________________________ 20 Table 2 – Indicator category weighting ___________________________________________ 31 Table 3 – Metrics selected to represent indicator categories in PCA ____________________ 35 Table 4 – AC data for Ayacucho, Loreto, Piura and Peru _____________________________ 43 Table 5 - Indicator Scores (σi,j,k), Indicator Category Scores (φi,j) and Final AC Scores (ACi) 49
[image:9.612.94.541.108.287.2]Table 6 – Sensitivity Analysis Results on Valuation __________________________________ 58 Table 7 - Sensitivity Analysis Results on Data Processing _____________________________ 60 Table 8: Ayacucho’s PCA Results. ______________________________________________ 62 Table 9: Loreto’s PCA Results _________________________________________________ 62 Table 10: Piura’s PCA Results. _________________________________________________ 62 Table 11– Summary of the Regional Climatic Challenges in the Natural and Social Systems _ 72
List of Figures
1
1. Introduction
In the last few years, climate-related catastrophes across the world illustrated the importance of a
nation’s capacity to act and react when facing disaster. The impacts from the earthquake in Haiti
and flooding in Pakistan, both in 2010, were significantly different from those in the 2005
hurricane Katrina, in the United States. Hurricane Katrina, the costliest natural disaster, as well
as one of the five deadliest hurricanes in the history of the United States, resulted in
approximately US$ 81 billion in property damage, 33,500 displaced people and 1,836 lost lives
[1]. Still, with adequate financial and planning capabilities, the federal and local government
was able to react and assist the population, providing temporary housing and relocation,
performing risk analysis, and reconstructing the infrastructure of the region. On the other hand,
disasters occurred in Haiti and Pakistan resulted in a total of 310,000 deaths, and 5.5 million
people affected by the catastrophes [2, 3]. Unlike the United States, these nations lack the
necessary infrastructure and resources to respond as quickly, relying mainly on international aid.
In addition, the countries’ deficient access to basic sanitation services, poor infrastructure, and
high levels of poverty, resulted in the breakout of fatal diseases such as cholera and
gastroenteritis [4, 5].
Climate change is expected to increase the frequency of natural disasters, such as hurricanes,
precipitation and flooding [6]. Understanding a nation’s capacity to react when facing
catastrophes is a short-term part of the long-term solution to climate variability, which consists
of adapting to more unforeseen changes in climate. Natural disasters are not the only impacts
resulting from climate change. A shift in sea and ambient temperatures has resulted in
biodiversity and water cycle problems affecting socio-economic activities such as agriculture and
2
climate variability effects is a critical strategy for societies to successfully cope, and possibly
even take advantage, of the irreversible changes in climate [6, 8].
Climate adaptation is made up of actions throughout society and can be manifested in myriad
ways, through market exchanges, extension of social networks, or through actions of individuals
and organizations to meet their own individual or collective goals [9]. Currently, international
groups and organizations like the United Nations Framework Convention on Climate Change
(UNFCCC) and the Intergovernmental Panel of Climate Change (IPCC) [8, 10, 11] are
addressing the challenges of adaptation for different countries and regions. These organizations
provide support to generate knowledge on the different factors that build or weaken adaptation to
climate change, including socio-economic, political and even psychological elements of human
systems. Methodologies and case studies are being developed and implemented to examine the
challenges of different countries, localities and economic activities for those systems with greater
vulnerability to climate variability1.
For a nation to determine its adaptive capacity (AC) to climate change effects, it must have
information regarding its population, which is frequently incomplete. In many developing
countries, the process of collecting, using and analyzing information for policy making is not
extensive due to the resources required in the process. Therefore, this thesis develops a
methodology to characterize sub-national levels of AC for domestic policy making on climate
adaptation, while considering the informational challenges of developing countries. More
specifically, the model characterizes AC with the use of existing available socio-economic and
1 Climate vulnerability is defined as “[the] degree to which a system is susceptible to, or unable to cope with, adverse effects of climate change, including climate variability and extremes. Vulnerability is a function of the character, magnitude and rate of climate variation to which a system’s exposure, sensitivity and AC”
3
demographic population data, minimizing the effort to collect additional information. The output
of the methodology is expected to allow more effective capacity building for adaptation
purposes; prioritizing aid and allocating adequate resources were most needed.
4
2. Literature review
Prior to discussing the methodology, the existing adaptation and AC literature is reviewed. The
literature shows a bifurcation – The first half takes a theoretical, almost philosophical approach
to the concepts of AC, contextualizing them in terms of development and sustainability. The
second half of the literature consists of systematic characterizations of AC, and can also be
divided in two approaches: a system’s natural ability to adapt to climate change and the role and
capability of institutional organizations to enhance the system’s AC. These two approaches will
be summarized in the following sections.
2.1 Theoretical approach
Adaptation and AC have taken an important role in the developing world because of the
prevalent social stresses of these nations, such as deficient disease control, population increase
and lack of basic services, which are expected to exacerbate climate change impacts [13, 14].
Thus, much of the theoretical literature is contextualized in commonly discussed topics among
developing nations, including resilience, sustainable development, equity, human security and
governance.
2.1.1 Resilience and Sustainable Development
The literature notes the natural relationship between adaptation, resilience and sustainable
development [9, 15-19]. Resilience was originally defined as a measure of the persistence of
systems and their ability to absorb change and disturbance while still maintaining the same
relationships between populations or state variables [20]. In the context of sustainable
development, the concept of resilience has been defined as the ability of groups or communities
to cope with external stresses and disturbances as a result of social, political, and environmental
5
periods of consolidation, refocusing and redirection [9]. The IPCC notes that “[The
enhancement] of AC involves similar requirements, [such as the] promotion of sustainable
development, including: improved access to resources; reduction of poverty; lowering of
inequities in resources and wealth among groups; improved education and information;
improved infrastructure, diminished intergenerational inequities; respect for accumulated local
experience; moderate long-standing structural inequities, assurance that responses are
comprehensive and integrative; active participation by concerned parties,; and improved
institutional capacity and efficiency” [8].
2.1.2 Equity and Human Security
Equity and human security are concepts closely related to adaptation, especially in developing
countries [21]. According to Adger [22], poverty is an important aspect of vulnerability to
climate change because of its direct association with access to resources, and adaptive and
coping capacity to extreme climate events. Similarly, O’Brien and Leichenko [23] discuss
adaptation in the context of human security and equity. According to these authors, equity is not
only related to the distribution of attributes or outcomes, but it is also influenced by the
availability and access to opportunities and the realization of human potential. Thus, inequity
may be enhanced in the allocation of funding for adaptation (the distribution of the benefits and
the negative consequences of any adaptive responses), which is a result of the perspective of
procedural justice, issues of interest, influence and participation in the adaptation process (many
time unevenly distributed across the population). For instance, a particular geographical area
might have greater access to adaptation funding than other regions with greater exposure to
6
making process. This could be driven by stronger socio-political power or economic support
from industrial groups through lobbying measures.
O’Brien and Leichenko note the direct relationship with equity and human security, arguing that
people only achieve the latter when and where individuals and communities have the options
necessary to end, mitigate, or adapt to threats to their human, environmental and social rights,
which will be achieved only if there is an evenly distributed implementation of adaptation
measures (ibid.).
With a more comprehensive view of equity, O’Brien et al. [24] argue that inequities related to
climate change impacts are not exclusive to developing countries. The authors note that there are
other factors besides GDP, technological development and education that affect equity. For
instance, a less-diverse economy can be significantly detrimental to adaptation, especially if the
dominant economic activity is already strained by climate stimuli (e.g., a monotonic type of
agriculture that is exposed to extreme weather conditions such as drought or increased
precipitation).
2.1.3 Government and governance
Implementing climate change adaptation strategies require a good understanding of the different
stakeholders involved and their role in the process. According to Adger et al. [25], adapting to
climate change involves cascading decisions across a landscape made up of agents (e.g.,
individuals, firms and civil society, to public bodies and governments at local, regional and
national scales, and international agencies), which result in conflicting interests across
stakeholders. For instance, adaptation measures determined by the government can conflict
with the goals of private and public entities (e.g., decreasing water supply due to potential
7
argue that maintaining the sustainability in adaptation depends on the heterogeneity of AC across
stakeholders, which can be a difficult goal in developing nations where there is greater inequity
in opportunities, representation and access to resources.
According to Paul-Wostl [26], AC is defined as a function of governance ability to respond to
climate variability challenges, which depends on the diversity of the government. More
specifically, Paul-Wostl argues that a to capture the complexity of a system for AC
characterization, governments should receive information from different groups including formal
as well as informal institutions (socially shared and cultural norms that are not codified or
written down) and implement multi-level governance (i.e. dispersion of authority away from the
central state). According to Haddad [27], having a clear notion of socio-political goals allows
nations to assess their AC based on their governmental philosophy. For instance, resource
allocation strategies for AC building could be based on utilitarian approaches, which invoke
welfare invoke policies that would maximize utilities (in terms of risk), or by maximin
perspectives, which consist of the maximization of greatest expected benefit for the least
advantaged members of society.
Eakin and Lemos [28] relate adaptation to economic tendencies and state that globalization and
rapid economic liberalism in developing nations has resulted in the minimization of their AC.
More specifically, Eakin and Lemos state that governmental decentralization, a major result of
globalization coupled with international agency intervention, consists of the devolution of power
to more local oriented groups but is often not parallel to the allocation of resources. This results
in little human and financial assets for local governments and consequentially limiting local
8
2.2 Practical Approach - Modeling AC
As opposed to the theoretical framework, other efforts have been placed on developing tools to
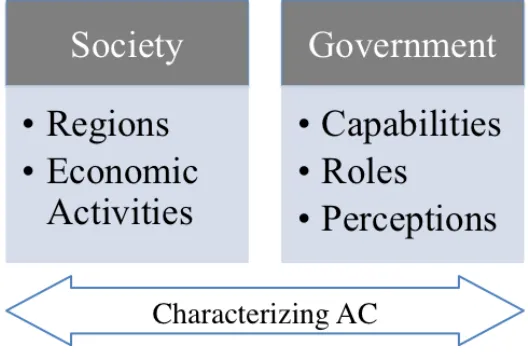
characterize AC. Fig. 1 illustrates the structure of this characterization with two different
focuses. The first focus aims to characterize societal AC using geographical boundaries (e.g.,
regional, national, sub-national) and economic activities (e.g., agriculture). The second aims to
determine roles and capabilities of the government in a system’s AC, based on socio-economic
[image:17.612.72.336.283.461.2]and socio-cognitive determinants.
Fig. 1 – Structure and distribution of the AC literature
2.2.1 Characterizing AC
AC characterization consists of the development of frameworks, indexes and determinants to
assess the AC of a system, which can represent a region, nation or even economic activity
[29-37]. These efforts can be implemented by two different methodologies: deductive or inductive,
9 Deductive Approach
Deductive research proposes relationships derived from theory or conceptual framework to
select indicators on climate change vulnerability, adaptation and AC. The first step in a
deductive or theory-based approach consists of understanding a particular phenomenon and the
main processes involved. The second step identifies the relationship between the phenomenon
and the identified processes. Finally, the third step determines the best possible indicators for
these processes, and consequently, of the studied phenomenon. This deterministic approach is
used by the IPCC [8] to identify six AC indicator categories: economic resources, technology,
information and skills, infrastructure, institutions and equity. These categories are chosen based
on an expert understanding of the conditions that influence the adaptability of societies to
climate stimuli in the fields of hazards, resource management and sustainable development.
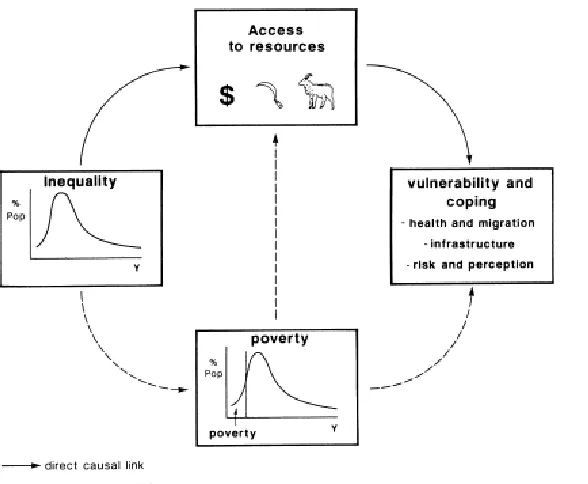
Adger [22] takes a deductive approach to illustrate the direct and indirect links between
socio-economic factors and vulnerability to climate change (Fig. 2) using a case study in Vietnam.
Adger concludes that it is not poverty that increases the impact of external shocks but instead it
is the increase in income of a specific community that restricts the remaining proportion of the
population from accessing resources that buffer extreme environmental changes. As a result
inequality, and not poverty, is the key indicator resulting from the assessment.
Cutter et al. [36] evaluated social determinants that would enhance or minimize vulnerability to
environmental hazards in the U.S. The authors used existing socio-economic and demographic
data and factor analysis methods to establish the determinants including ethnicity, family
structure, and age. Similarly, efforts by Brooks [35], Adger et al. [30], and Brooks et al. [37]
developed a national level conceptual framework to establish a system’ vulnerability and AC
10
Fig. 2 - Direct and indirect links between inequality and vulnerability. Adapted from Adger et al. [22]
Moss et al. [32] developed a model to index climate change vulnerability at the national level by
the year 2095. The model incorporated AC and sensitivity indicators. The results yielded scores
for both current and potential future conditions for 38 countries, of which 16 were determined to
be more vulnerable than the rest of the world. Vincent [29] created an index to assess relative
levels of social vulnerability to climate-induced variations in water availability across African
countries. This aggregate index of social vulnerability was calculated as a weighted average of
five composite sub-indices: economic well-being and stability (20%), demographic structure
(20%), institutional stability and strength of public infrastructure (40%), global interconnectivity
(10%) and dependence on natural resources (10%). The author notes the subjectivity that is
incorporated by using the deductive approach, for both the weighting and indicator selection,
and states that this element can be addressed by ensuring that all decisions are grounded in
literature and made fully transparent: “Making such choices is an inherently subjective process,
[image:19.612.80.374.74.316.2]11
relating to their functional relationship with vulnerability (i.e. whether it is a direct or inverse
relationship)” [29].
In a recent publication, Hinkel [38] noted that indicators have the tendency to minimize
complexity, and thus the use of AC indicators are only appropriate when a system boundary can
be narrowly defined, mainly at local scales. Along those lines, work focused in sub-national
level and economic sector-specific analysis of AC was recently published. Agriculture takes
significant attention due to the socio-economic implications of climate variability on this
activity. Morton [14] focused on small scale agriculture and developed a conceptual framework
to assess this particularly vulnerable group. Similarly, Nelson et al. [39, 40] modeled the climate
vulnerability of Australian rural communities, including AC as well as the sensitivity and
exposure to climate stimuli. Simoes et al. [41] focused on small-scale farmers in Brazil’s
semi-arid region and characterized the system’s vulnerability to the climate stimuli and the practical
ways to enhance the farmers’ AC by implementing innovative techniques such as irrigation
systems and planning strategies.
Inductive Approach
Unlike the theory-based approach in deductive methods, inductive research uses empirical
information to find generalizable data patterns [30]. Yohe and Tol [42] take this approach to
determine a direct relationship between a discrete number of determinants and the number of
people affected (killed or harmed) and damage done by natural disasters. The authors evaluated
the correlation of these determinants to specific locations and thus generate a more suitable
framework for the system under study. In a later study, Tol and Yohe [43] evaluated a
previously developed indexing method [42] by analyzing AC determinants. The authors
12
balancing with another really strong determinant (e.g., good economic development) or
compensating with similar, stronger determinants (e.g., nutrition). With this work, the authors
show dynamics between AC determinants and conclude that there is no such thing as a general
valuation for all AC stressors. Rather, the factors from which systems draw to create AC are
different for different risks, invoking elements for the specific determinants used.
Posey [44] tests the relationship between individual socio-economic status and capacity to take
collective action in response to environmental impacts at the municipal level. The
socio-economic indicators included population, poverty rates, per capita income, educational
attainment, race and ethnicity, home ownership rates, occupancy rates, home values and median
rents. The analysis showed that there was a high correlation between all variables, and that the
capacity to manage and react to flooding is highly correlated to individual socio-economic
characteristics in a community. Posey also identifies the importance of social capacity elements,
such as community networks and memberships, which were not captured by his current model.
2.2.2 Governance
In addition to general AC characterization, some recent work has focused on the role and
capabilities of governmental institutions in the assessment and enhancement of a system’s AC.
Engle and Lemos [45] developed an index to assess the capacity of governance mechanisms to
manage Brazilian water systems that are affected by climate variability. The authors build
relationships between governance and AC, assuming that a more flexible, democratic and
participatory government increases AC. Nine indicators were included in the index:
representation, participation, knowledge and information use, equality and decision making and
knowledge availability, flexibility, commitment, networks, experience and resources. Specific
13
obtained from surveys of government members. After evaluating and indexing 18 river basins,
the model showed that stronger governance mechanisms and higher levels of participation and
representation are associated with higher AC.
Gupta et al. [46] developed a “wheel” framework to assess the inherent characteristics of
institutions to enable the AC of society, specifically the institution’s ability to empower social
actors to respond to climate stimuli. The wheel has six dimensions and uses colors to rank and
identify the positive or negative results of the assessed governmental system. The framework is
used to help improve the role of institutions in the process of enhancing societal AC by
redesigning the organization and its structure.
The literature shows that perception plays a particular role when characterizing AC. For
example, the existence of particular institutions (e.g., the media) can play a role in amplifying or
attenuating the associated risks of vulnerability to natural hazards [47]. Within the hazards
literature, there have been some studies on how people behave under conditions of uncertainty
and the possibility to underestimate the likelihood of the hazard affecting them [48, 49].
Grothmann and Patt [50] note that previous studies evaluate AC based on socio-economic
determinants and resources without taking in consideration socio-cognitive factors. Thus, the
authors developed a socio-cognitive Model of Private Proactive Adaptation to Climate Change
(MPPACC) to incorporate the psychological factors of perception to risk and AC when taking
action to climate stimuli. Frank et al. [51] added social identity to MPPACC by determining
how social groups view scientific or technical experts as a climate authority to properly channel
adaptation messages. To do this, Frank et al. observed how media, cooperatives, technical
experts and other authorities influenced the adaptation process for coffee farmers in the sector of
14
a variety of different sources, they ultimately followed media (e.g., radio and television)
guidance to make climate-related decisions for their crops.
Eakin et al. [52] affirm that the discrepancy on perceived flood risks between different
governmental agency results in decreased AC for a system. For example, increased bridging
among government levels improved the overall AC within peri-urban areas in Mexico, because a
clearer, more uniform understanding of flood risk was shared across agencies and resulted in
more fair allocation of financial and human resources.
15
3. Improving AC methodology for Domestic Policy
The adaptation and AC literature shows an increasing number of publications, including efforts
to conceptualize adaptation and modeling initiatives to characterize AC. Despite the growth and
richness of the literature, significant knowledge gaps have been identified. The literature shows
significant effort to generate one size fits all indices and determinants [29, 30, 32, 35, 36, 53] to
characterize vulnerability to climate change, adaptation and AC. At the same time, there is an
increasing body of literature that criticizes vulnerability indicators as not being scientifically
sound or policy relevant [38, 54, 55] due to large aggregation and uncertainty. The critics
suggest smaller scale approach and a better understanding of the causes of vulnerability, in this
case the impacts of climatic change. One-sized-fits-all efforts are contrasted by case-by-case
studies of specific locations and economic activities [14, 39-41, 51, 56], showing little to no
bridge among methodologies where determinants can be used for more than one location, while
still incorporating the particularities of each locality.
The literature also falls short when incorporating the particularities of distinct social groups
when using existing AC methods. Adaptation strategies are not isolated from other decisions,
but occur in the context of demographic, cultural and economic change [57]. There is little
discussion on the importance of customization and indicator valuation based on existing social,
political and economic factors. A good example of valuation is provided by Vincent [29, 58]. In
her work, the author notes the importance of weighting when generating a vulnerability index
since the effect of a socio-economic determinant on AC (e.g., socio-economic, education, health)
varies across regions, countries and even lower level social systems. Thus, the weighting of the
different AC factors in Vincent’s assessment of African nations is determined based on
16
Finally, the information technology literature has identified the critical role of information
management systems (IMS) in a country’s economic, social and even political development [59].
On the other hand, failures of implementing successful IMS in developing countries can result
from a lack of existing resources, inadequate methodologies and poor design of the IMS itself
[60-62]. It must be assumed that perfect or ideal access to such data is unrealistic, since many
countries, especially developing nations, lack solid statistical institutions to support such
requirements.
With such limitations, there is a need to develop a methodology for AC that bridges top-down
and bottom-up approaches focusing on domestic policy while incorporating the informational
challenges in developing nations. This thesis details such a methodology, which focuses on
developing countries and uses existing relationships between socio-economic determinants and
AC, while incorporating realities of the decision-making process of the developing nations and
valuation (i.e. weighting) of AC factors.
3.1 Goal and scale
The goal of this AC Methodology is to analyze existing regional characteristics and use this
information for domestic and regional policy-making in developing countries. To meet this goal,
the AC Methodology has two specific priorities. First, it ranks a nation’s regional AC to help
prioritize the aid to those localities with lesser capacity for climate change adaptation; and
second, it provides comprehensive regional socio-economic information for the building and
strengthening of regional AC.
Establishing the time and spatial scale of the system boundary of study is critical in AC
assessment, particularly to manage uncertainty associated with future AC predictions [58].
17
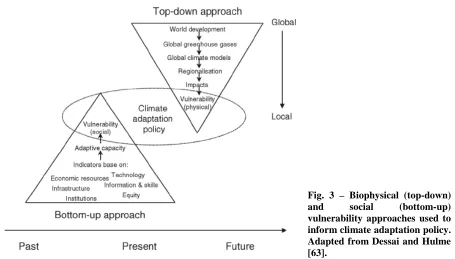
and AC from a social perspective (i.e. using socio-economic and demographic indicators)
requires the use of past and present information, while assessing adaptation with a biophysical,
climatic perspective requires estimating future climate patterns with mid to long-term future
projections (Fig.3).
Fig. 3 – Biophysical (top-down) and social (bottom-up) vulnerability approaches used to inform climate adaptation policy. Adapted from Dessai and Hulme [63].
The AC Methodology developed here uses a time-scale based on recent past data (i.e. last ten
years), although this is subject to data availability. For instance, where data are scarce, data as
old as 30 years may be used (Refer to section 4.1.2). Geographically speaking, the analysis is
performed at the regional level to allow considerations of regional socio-economic and
[image:26.612.89.544.192.451.2]18
4. Methodology
As noted in section 3, the AC Methodology developed here aims to prioritize AC enhancement
and guide effective allocations of resources for AC decision-making. To do this, the AC
Methodology was built with two sections: the Exploratory AC Model and the principal
components analysis (PCA), each of which will be described in greater detail below.
The Exploratory AC Model follows the deductive approach, which uses the existing knowledge
to generate socio-economic and demographic indicators for AC characterization. This first half
of the methodology has a well-known, almost conservative approach. It is based on existing
literature on the use of determinants in social vulnerability, environmental hazard and climate
adaptation studies, including assessments at the national [32, 36, 37, 53, 64], regional [29, 30]
and economic activity levels [14, 40, 41]. The Exploratory AC Model generates a sub-national
index, which reflects relative AC across the regions within a country, allowing the
decision-maker to prioritize aid for those regions requiring the most help and to identify particular areas
that weaken region-specific AC.
The second part of the methodology, the PCA section, complements the Exploratory AC Model
in two ways. First, it uses a mathematical approach to confirm the validity of the indicator
categories of the Exploratory AC Model. Second, it characterizes the most relevant indicator
categories that correlate with AC, providing guidance to the policy maker such that allocation of
budget and resources has the greatest likelihood to increase AC of the region.
To illustrate the development and application of this AC Methodology using existing
19
country. The selected country of study is Peru, and the national regions included are Loreto,
Piura and Ayacucho. A description of the regions under study is provided in section 4.3.
4.1 The Exploratory AC Model
As discussed at the beginning of section 4, The Exploratory AC Model uses socio-economic and
demographic determinants to characterize a region’s AC. Developing and executing the model
consists of three steps: development of indicators and metrics; data collection and processing;
and final scoring. The first step reviews literature and available data to generate the indicators to
characterize AC. In the second step, data are collected based on existing Peruvian statistics and
extensive literature review; and then processed to generate uniform data. In the third step, scores
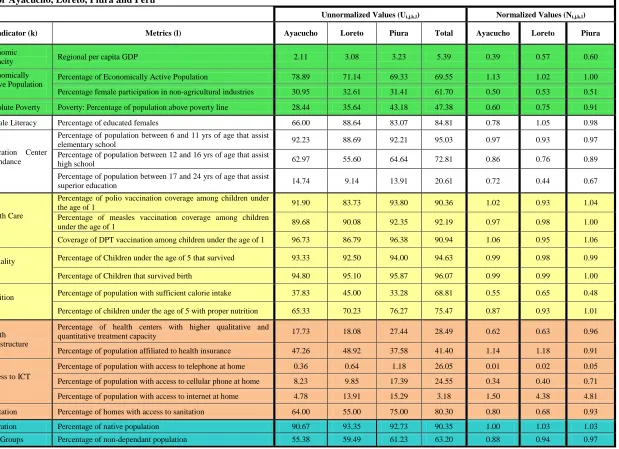
are generated for each indicator, indicator categories and total AC for each of the regions.
4.1.1 Metric and Indicator Development
Desirable indicators and metrics are variables that summarize or otherwise simplify relevant
information; make visible or perceptible phenomena of interest; and quantify, measure, and
communicate relevant information [32]. These variables should be transparent and
understandable and should also simplify or summarize a number of important properties rather
than focus on isolated characteristics of a system [65].
The Exploratory AC Model includes five AC indicator categories identified from the literature2: socio-economic status, education, human health, infrastructure and population demographics.
The number of indicators ranges from two to five, per category. Each indicator has at least one
metric. A total of 23 metrics were chosen (Table 1), as described within each category below.
20
Table 1 – AC Indicators and Metrics
Indicator
Category Indicator Metrics Years Data Source
Socio-Economic
Economic
Capacity Regional per capita GDP 2001 – 2008
National Institute of Statistics Informatics (INEI) – Regional GPD 2001-2008
Economically Active Population
Percentage of Economically Active Population 2007 INEI – National Household Survey (ENAHO), – 2007 Percentage female participation in
non-agricultural industries 2001 – 2008
INEI – ENAHO, 2001-2008 Poverty Poverty: Percentage of population outside of
poverty 2001 – 2008
Education
Literacy Percentage of educated females
2001-2008 INEI – ENAHO, 2001-2008 Education
Center Attendance
Percentage of population between 6 and 11 yrs of age that attend elementary school
Percentage of population between 12 and 16 yrs of age that attend high school
Percentage of population between 17 and 24 yrs of age that attend superior education
Human Health
Vaccination
Percentage of polio vaccination coverage among children under the age of 1
2001-2008
Health Ministry – Office of Statistics and Information Percentage of measles vaccination coverage
among children under the age of 1
Percentage of DPT vaccination coverage
among children under the age of 1 1996-2008
Mortality
Percentage of Children under the age of 5 that
survived 1996, 2000 y
2007/2008
INEI – Demographic and Family Health Survey (ENDES) 1996, 2000 y
2007/2008 Percentage of Children that survived birth
Nutrition
Percentage of population with sufficient calorie
intake 2000, 2002,
2007
INEI – (ENDES) 2000, 2005, 2007 Percentage of children under the age of 5 with
proper nutrition
Infrastructure
Health
Percentage of health centers with higher
qualitative and quantitative treatment capacity 2004-2008
Ministry of Health Percentage of population affiliated to health
insurance 2001-2008
Access to ICT
Percentage of population with access to telephone at home
2001-2008 INEI – ENAHO, 2001-2008 Percentage of population with access to cellular
phone at home
Percentage of population with access to internet at home
Sanitation Percentage of homes with access to sanitation 2007 INEI – Compendio Estadistico 2008
Population Demographics
Migration Percentage of native population 1981, 1993
INEI – National Census of Population and Housing,
1993
Age Groups Percentage of non-dependant population 2000 – 2015
INEI – Estimates and Proyections, according to rural, urban, sex and age by
21
Socio-economic status
Within the socio-economic status category, three indicators were selected: economic capacity,
economically active population (EAP) and absolute poverty. Economic capacity relates to the
region’s wealth, as determined by access to markets, technology, and other resources. This
indicator is directly related to the notion of collective AC to recover from climate variability
impacts [32]. For instance, a region with greater economic capacity will have greater resources
to rebuild damaged infrastructure needed for economic flow to continue after climate change
related disasters. On the other hand, a region with lower economic wealth would have a limited
capacity to respond, minimizing the ability to cope or adapt to such impacts. The selected metric
used to measure economic capacity is the average per capita GDP from 2001 until 2008.
EAP is defined as a group that includes all persons of either sex who furnish the supply of labor
for the production of economic goods and services [66]. The EAP metrics include the
percentage of the population above 15 that participates in the economy and the percentage of
female participation in the labor force, excluding agricultural activities. A high percentage of
EAP reflects different sources of income in a social group, resulting in a lower dependency3 ratio, and thus, greater AC. Female economic participation was explicitly identified as an
important element in the climate change AC literature [67, 68]. Women make decisions
differently than men in the sense that they tend to act based on the wellness of the entire group to
which they belong [68]. In addition, women are responsive to social bonds, demonstrating
greater cooperation and altruism to the community. Having high economically active female
participation not only increases the AC of those families with economically influential women,
3
22
but also reaches other families where social bonding has been formed and expands the AC to an
extended family, group of friends or neighborhood [36, 67].
Absolute poverty relates to poverty measured with a monetary focus, meaning that it is measured
as a function of monetary expense to satisfy basic needs. Thus, it does not include other
dimensions of poverty such as malnutrition and education [69]. More specifically, poverty refers
to those residents of households that cannot afford the minimum monetary amount to satisfy
basic nutritional and other non-nutritional needs such as clothing, rent, fuel, transportation,
communications, culture and other expenses [69]. The selected poverty metric is percentage of
the population living in poverty. As expected, there is a high inverse correlation between
poverty and AC – poverty has an inverse relationship to resource access and availability, which
enables communities to absorb and recover from losses more quickly due to social safety nets
[29, 70]. Also, from a community standpoint, the poor are likely to require substantial
government assistance and more commonly become the inhabitants of refugee camps and
temporary housing, tending to remain there for longer time [71, 72]. Such dependency makes
them potentially more vulnerable to climate variability impacts. For indicators like poverty that
have an inverse correlation with AC, metric conversion has been implemented to maintain
positive correlation consistency across the model. Conversion consists of adjusting the collected
socio-economic and demographic data into a format that illustrates a direct, positive relationship
with the region’s AC. Refer to section 4.1.2 for further data conversion details.
Education
Education is critical for long-term adaptation goals [35]. A lack of education constrains the
ability to access recovery information and understand climatic impact warnings (e.g., disaster
23
providing a support system when facing climate change impacts [73]. Female literacy and school
attendance are the two indicators selected within this category. The gender-based education
indicator measures the proportion of literate females in a region, with a similar rationale to
inclusion of the gender-based EAP indicator. Educated women are critical leaders in their
communities. The higher the percentage, the greater the capacity to understand climate change
impacts and inform, plan and reach people to cope and assess adaptation challenges in the
household and community.
School attendance is measured by percentage of population in elementary school, high school
and superior education, based on their respective age groups (i.e. between 6 and 11, 12 and 16
and 17 and 24, respectively). This indicator not only illustrates the capacity to educate in a
conventional form, but also the capacity to inform in the event of climate change impacts,
communicating preventive and coping measures. Schools are primary centers of information
dissemination because students spend up to eight hours in schools, where emergency or disaster
plans are usually implemented. Having high percentages of student-aged population attending
schools is a way to educate the population accordingly while maintaining open communication
lines to the community, increasing the AC of the system.
Human Health
Vaccination, mortality and nutrition are the indicators selected for the human health category.
Vaccination is related to the health of the population as well as the health of newborns and
children. Sick children require significant amount of care, time and economic resources, which
24
measured by the percentage of polio, measles and DPT4 coverage, all for children under the age of 1.
Nutrition and mortality are diagnosis of health status [35]. Intuitively, a healthy population is
less susceptible and thus more likely to resist potential climate variability impacts that would
lead to exposure of hazards, such as water-borne diseases. In the case of nutrition, a
well-nourished population will have more energy to resist periods of hunger due to relocation and
delayed shelter and food aid resulting from climate related catastrophes. Percentage of
population with sufficient calorie intake and percentage of children under the age of 5 with
proper nutrition are used to characterize this indicator.
The metrics used to quantify mortality include survival percentage of children at birth and under
the age of five. According to UNICEF, childhood mortality rates are highly related to poverty
and social vulnerability [74], thus affecting the community’s AC . Children born in poorer
countries are more exposed to contaminated water and poor housing. They are also more likely
to be undernourished and to suffer greater exposure to infectious diseases. This link between
poverty and child death is also evident within developing countries where rates of under-five
mortality are higher in poorer households (ibid.).
Infrastructure
Three indicators were selected for the infrastructure indicator category: health infrastructure,
access to sanitation and access to information and communications technology (ICT). Access to
health care infrastructure is positively correlated with higher AC because it provides alternatives
to recover from health problems resulting from climate impacts, such as cholera, dengue fever
and respiratory illnesses. Two metrics were selected for this indicator: percentage of population
25
with access to insurance and number of high quality health care centers. Having medical
insurance allows people to rely on existing health infrastructure, including health centers,
medicine and medical staff. Similarly, health care centers are a source of relief. The lack of
appropriate resources will lengthen immediate relief efforts and long-term recovery from
disasters [73, 75]. Health care centers are measured in terms of the qualitative and quantitative
capacity of the existing health care centers. According to Peru’s Ministry of Health (MINSA),
there are three types of health care centers: health stand, health center and hospital [76]. The
health stand only addresses minor injuries and has mainly a promotional and preventative role.
On the other hand, health centers and hospitals have greater capacity of staff and equipment to
handle more complex injuries or illnesses. In terms of AC, a region’s coping and adaptation to
climate change should not only be preventive but should also have resources to attend to
potential injuries or plagues resulting from climate change. For this factor, the model measures
the ratio of health care infrastructure with greater capacity of staff and equipment (i.e. health
centers and hospitals) to the total number of health care resources (i.e. health stands, health
centers and hospitals combined) in a region.
Access to adequate sanitation infrastructure is related to minimized exposure to water-borne
diseases such as cholera. Climate variability impacts (e.g., flooding and drought) can result in
reduced access of water supply for sanitation purposes, resulting in the spread of infection and
disease, minimizing a system’s AC. The metric used in this category, percentage of homes with
access to sanitation, is an aggregation of four statistics provided by the National Institute of
Statistics and Informatics (INEI), including access to latrine, septic tank, and sewers inside and
outside the household. While access to sanitation is normally assumed to have a positive
26
can also result in lower AC if the sanitation network suffers a significant structural impact and
results in the breakdown and loss of service [36]. However, for the scope of this study, higher
access to a sewerage system is assumed to lead to higher AC due to the country’s history to
cholera outburst in the 1990’s because of poor sanitation conditions [77].
According to the literature, access to ICT is directly correlated to higher AC [29, 35, 73]. The
International Communications Union (ICU) states that access to ICT can be used for planning
purposes to manage climate change variability impacts by helping observe, describe, record and
understand the environment; sharing information; and facilitating the coordination of
environmental decision-making [78]. Access to ICT is quantified with the following metrics:
percentage of population with access to the Internet, landline telephones and cellular phones.
Population Demographics
AC indicators selected for population demographics include migration and age group
distribution. Migration rates are inversely correlated to AC, as migrants might face cultural
barriers that minimize their ability to adapt to climate variability impacts. For instance, migrants
might not speak the language of the destination, and thus might be excluded from media and
information communication, a source of alarm for disasters [70, 72]. Also, migrants might be
unfamiliar with existing social norms or have little interaction with the information or planning
sources that aim to adapt to climate change impacts, such as seismic drills implemented by local
government and practiced by the population. The metric used to measure migration is
percentage of native population5.
5
27
Families with a large number of dependents (i.e. people younger than 15 and older than 60 years)
must juggle work responsibilities and care for family members [72, 73]. Even though not all
elderly are frail and/or poor, it can be generalized that older residents are more likely to need
disaster-related assistance. In the case of children, their vulnerability is self-evident, especially
in the developing world. According to UNICEF, environmental degradation from contaminants
and disaster is felt more acutely in developing nations where most of the world’s children live
and where most children mortality occurs (i.e. 98% of all children mortality occurs in developing
nations) [79]. With such exposure to disease and health vulnerability, children are a significant
source of economic dependency for the other non-dependant family members. The metric used
for the age group indicator is the percentage of non-dependant population.
4.1.2 Data Collection and Processing
The data for the AC metrics (Table 1) were collected from publicly available databases generated
by Peru’s National Institute of Statistics and Information (INEI). The amount and resolution of
the data depended on their availability. For instance, for some indicators (poverty, literacy and
access to ICT) the values consisted of data from the last few years (2001 – 2008). In other cases,
the number of observations was much less – as few as 2 data points, as in the case of migration
rates, which only had data from the years of 1981 and 1993. For other indicators, the data
consisted of only one discrete value, such as the 2007 statistic for sanitation.
Data processing consisted of three steps: averaging, conversion and normalization. The model
averaged the available data points to generate one estimate for each metric. This average
allowed for consistent input data across metrics and indicators and for minimization of data
28
Conversion consisted of adjusting the collected socio-economic and demographic data into a
format that illustrates a direct, positive relationship with the region’s AC. For instance, section
4.2 discusses the inverse relationship between poverty and AC, as opposed to the direct
relationship between economically active population and AC. To generate data inputs with a
consistent relationship with the dependent variable (AC), all inverse metrics were converted to
direct metrics by taking the complement of the original value. For example, if the poverty level
of Ayacucho were 71.56%, the converted metric would be percentage of population above
poverty line, and its value would be 100-71.56, or 28.44%. This step was applied to poverty and
five other metrics: mortality rate in children under the age of 5, children mortality rate,
percentage of population with deficient calorie intake, percentage of malnutrition among children
under the age of 5 and percentage of immigrant population.
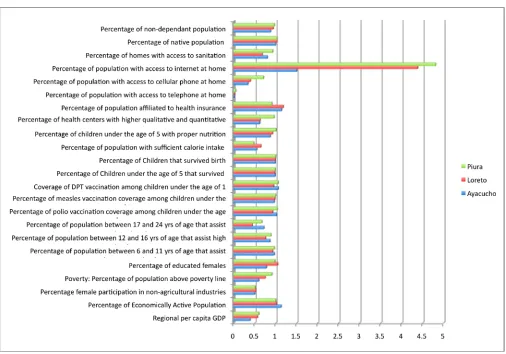
After the data observations were averaged and converted, the values were normalized. The goal
of normalization is two-fold: to place indicator results into a broader context and to adjust the
results to have common dimension. Normalization is carried out by dividing the value of each
indicator metric over the value of the reference system [80]. The reference system can be
selected using two approaches: internal or external normalization [81]. Internal normalization, or
operational view, can be used in comparative studies where one of the alternatives is selected as
the reference. The purpose of this approach is to understand the non-commensurate units prior to
the interpretation of results. On the other hand, external normalization, or contextual view, uses
an auxiliary reference system, such as a geographical area (e.g., region, country, continent or
world) to assess the relative significance of the results across the categories, putting them in
context (ibid.). In this case, since the goal of the AC model is to rank AC within across the
29 Peru.
It is important to note that the external normalization method used in this work might potentially
cluster or skew the results of the case study subjects. The country of reference averages
socio-economic and demographic characteristics that include its total population. Peru is a highly
centralized country in which most of the country’s GDP is generated in Lima, the capital [82,
83]. Also, large migration waves from less economically developed regions have resulted in a
densely populated capital (i.e. 30.93% of Peru’s population inhabit in Lima) [84]. This
combination of high population and high GDP in the capital results in a concentrated area of
people with greater access to infrastructure, education and certain socio-economic status
indicators than other regions. Having Peru as the reference system includes the data from Lima
as well. Lima’s significant socio-economic outperformance in comparison to the other regions
might result in clustering the normalized results of Ayacucho, Loreto and Piura, even though
there might be significant differences across these latter regions. This potential effect will be
discussed in the results section below.
Eq. 1 shows the relationship between the normalization elements, where i is the region, j is the
indicator category, k is the indicator and l is the metric, N is the normalized value, U is the non
normalized regional value and R is the metric value for the reference system.
Eq. 1:
Intuitively, to normalize the values for the AC metrics, statistics and information need to be
established, not only for the selected regions of the country, but also for the country as a whole.
Thus, conversion for the nation-level indicator values is also needed. Continuing with
30
Ayacucho’s poverty example, the converted value for Ayacucho’s poverty metric is 28.44.
Normalizing Ayacucho’s poverty requires dividing 28.44 over Peru’s converted poverty metric.
Since Peru’s poverty is a total of 52.62, its converted poverty value is 100-52.62 = 47.38.
Therefore Ayacucho’s normalized poverty value is equal to 28.44/47.38 = 0.60.
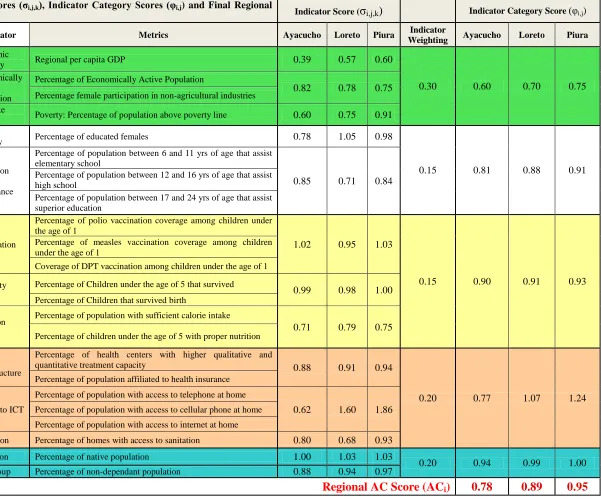
4.1.3 Final AC Scoring
Estimating final regional scores (ACi) requires three calculations, in the following order:
indicator values, indicator category values and final AC regional scores. Estimating indicator
values is illustrated in Eq. 2 where σ represents the score of the indicator, p is the respective
number of metrics of each indicator, N is the normalized and converted value, estimated in the
previous step. As noted, the value of each indicator is the result of averaging the value of its
respective metrics.
Eq. 2:
σ
i,j,k=
1
p
∑
p=1N
i,j,k,lEstimating the indicator category value is illustrated in Eq. 3, where φ is the score of the
indicator category and m is the number of indicator per indicator category. As noted, the score
of each indicator category is the result of averaging the value of its respective indicators.
Eq. 3:
The equation used to the final regional ACi score is illustrated in Eq. 4, were wj represents the
weight of indicator category j (see Section 5.33). As noted in the latter equation, the regional AC
value is a summation of the weighted indicator values.
ϕ
i,j=
1
31 Eq. 4:
Weighting consists of providing valuation to each of the indicator categories under the
assumption that not all categories will have the same effect on AC. For instance, economic
status is expected to have a greater effect on minimizing vulnerability than population
characteristics, but less effect than infrastructure. The values for weighting (Table 2) were
initially based on existing nation level AC models in developing African countries [58]. These
models use theory-driven indices that capture theoretical determinants of AC based on literature
and expert judgment.
Table 2 – Indicator category weighting
Indicator Categories Weight
Socio-Economic Status 30%
Education 15%
Human Health 15%
Infrastructure 20%
Population Characteristics 20%
The final weightings for the Exploratory AC Model were estimated based on the model’s
structure, including the indicator categories, indicators and metrics selection. Indicator valuation
is incorporated in the final step of the scoring process, which is explained in the following
section. Despite the initial use of these preset weights, the Exploratory AC Model allows users
with expert knowledge to change these values. The use of different category valuation is
evaluated in a sensitivity analysis to determine possible impacts from weighting on the results of
the Exploratory AC Model (See section 4.1.4).
AC
i=
w
jj=1
32 4.1.4 Sensitivity Analysis
A sensitivity analysis is carried out to determine how robust the Exploratory AC Model is in
response to variable weighting and data quality. For weighting, the model is tested to determine
sensitivity to equal weighting across category indicator and skewed weighting allocated to one
single indicator category (i.e. valuing one category significantly higher than the others). Equal
weighting is assumed when there is no clear understanding of the valuation for each category.
Skewed weighting is assumed as a possibility by the user, since economic variables are often
given more importance by decision-makers, especially if those with greater economic capacity
have more access to the decision-making process [25]. In the two skewed weighting analyses,
the socio-economic indicator category was evaluated with weights of 50 and 60 percent, with all
other indicator categories having equal weighting. More specifically, when the socio-economic
status category had skewed weighting of 50%, the other categories had a weight of 12.5%;
whereas when the skewed weighting was 60%, the other categories had a weight of 10%.
In terms of data quality, the model was tested using a range of lower and upper boundaries of
data collected for each metric instead of the point estimate used in the initial model setting. This
analysis relates to the goal of the Exploratory AC Model to incorporate the available national
statistics with flexibility, while still maintaining the validity and transparency of the data.
Additionally, this analysis is used to determine the effects of data aggregation by averaging on
each of the metrics used.
4.2 Principal Component Analysis
The PCA section of this methodology compliments the Exploratory AC Model in two ways.
33
information to characterize the most critical regional factors that affect AC and thus, generate
effective policy instruments to increase a region’s AC.
PCA is a statistical methodology used to reduce the dimensionality of a data set consisting of a
large number of interrelated variables, while retaining as much as possible of the variation
present in the data set [85]. This reduction is carried by replacing p measured variables Xl,
X2,..., Xp by m principal components (PC) or derived variables, Zl, Z2, ..., Zm, where m is much
less than p, whilst minimizing any loss of information . The variables Zl, Z2,..., Zm are taken to be
linear functions of Xl, X2, …, Xp [86, 87]. The PCs with maximum possible variance (Zk) are
selected based on the significance of the corresponding eigenvalues, provided by the software.
According to the methodology, eigenvalues greater or equal than 1 are those that fall within the
Zk group [87]. In addition, the software used provides the proportional variance that Zk has on
the variables X2,..., Xp. Finally, the ap coefficients show the correlation between the variables and
the selected PCs.
The first PC extracted in a PCA accounts for most of the total variance in the observed variables.
Under typical conditions, this means that the first PC will be correlated with at least some of the
observed variables and may be correlated with many. The second PC extracted will account for
most of the variance in the data set that was not accounted for by the first component. This
means that the second component will be correlated with some of the observed variables that did
not display strong correlations with PC 1[86].
For the category validation, the PCA will confirm the high correlation of all the categories in the
model with the PCs with maximum possible variance. On the other hand, to characterize the
most critical categories, the PCA will select only the indicator categories in the first PC. This
34
determine those elements that need to be addressed to increase region-specific AC. For instance,
if the model results show that Ayacucho has five particular indicators that are weakening the
region’s AC (e.g., economic capacity, poverty, education, migration and nutrition), and the PCA
results show two critical categories for the region (e.g., socio-economic status and population
demographics), the user should select the indicators that fall within those two critical categories
(i.e. economic capacity, poverty and migration). By narrowing the indicator selection based on
the PCA results, the policy and decision makers are able to focus on the most critical factors and
thus, optimize the allocation of resources and budget in the process of AC building.
It is important to stress that PCA results do not generate causalities (i.e. the effect that the PC
have on the variables). PCA is simply a variable reduction procedure that (typically) results in a
relatively small number of components that account for most of the variance in a set of observed
variables [20]. Interpretation of these PCs is subjective and left for the user to generate using the
base information, in this case the input statistics.
4.2.1 Variable Selection
To generate a robust statistical analysis, the number of observations (n) in a PCA has to be
greater than the number of variables (p) [88]. Ideally, the PCA section of this methodology
would incorporate each metric within the AC Model; this was not possible because the number
of observations n ranged from 1 to 9 across the AC Model and thus, it was not only inconsistent
but also resulted less than p (i.e. there is a total of p = 23 metrics in the Exploratory AC Model).
Therefore, the PCA section was performed using the indicator categories instead of the metrics,
resulting in p = 5 instead of p = 23. To do this, one metric per indicator category was selected
based on its number of observed sample size (i.e. years included in time series) and a fair
35
with data from the same years (2002 – 2008, resulting in n = 7) for consistency purposes. With
this adaptation, the final parameters of the PCA were n = 7 > p = 5, providing greater robustness
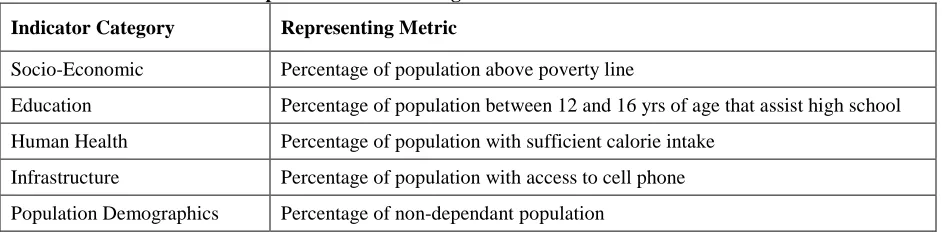
[image:44.612.72.543.165.282.2]to the methodology. Table 3 shows the variables selected per indicator category.
Table 3 – Metrics selected to represent indicator categories in PCA
Indicator Category Representing Metric
Socio-Economic Percentage of population above poverty line
Education Percentage of population between 12 and 16 yrs of age that assist high school
Human Health Percentage of population with sufficient calorie intake
Infrastructure Percentage of population with access to cell phone
Population Demographics Percentage of non-dependant population
Population above poverty line was the selected metric for the socio-economic status category.
Although economic capacity may intuitively seem more important, there is a conflict between
individual and collective AC. A region’s GDP could represent the economic power of one main
economic activity, and potentially the wealth of a small group of people, without necessarily
representing the population’s economic capacity. On the other hand, selecting poverty, instead
of economic activity, illustrates the population’s access to monetary resources, which can be
used to satisfy nutritional and other needs (e.g., fuel, transportation and communications) to react
to climate related disaster (See section 4.1).
Population proportion between 12 and 16 yrs of age that attend high school was selected to
characterize the education category. At this age, children have greater responsibilities in their
household than those of lesser age. Having this age group attending school, a source of alert and
communication to the community, is expected to spread climate related information to their
families and friends (See section 4.1). Unlike the older age group that attends school (from 17 to
24), the selected group is preferred since high school education in developing countries is more
![Fig. 4– Regions selected for the case study and their characteristics [84, 93-95]](https://thumb-us.123doks.com/thumbv2/123dok_us/113939.10821/48.612.73.521.261.703/fig-regions-selected-case-study-characteristics.webp)