Open Access
Short Report
Comparison of threshold selection methods for microarray gene
co-expression matrices
Bhavesh R Borate
1, Elissa J Chesler
3, Michael A Langston
2,
Arnold M Saxton*
4and Brynn H Voy
3Address: 1Genome Science and Technology Program, University of Tennessee, Knoxville, Tennessee, USA, 2Department of Electrical Engineering and Computer Science, University of Tennessee, Knoxville, Tennessee, USA, 3Oak Ridge National Laboratory, Systems Genetics Group, Biosciences Division, Oak Ridge, Tennessee, USA and 4Department of Animal Science, University of Tennessee, Knoxville, Tennessee, USA
Email: Bhavesh R Borate - [email protected]; Elissa J Chesler - [email protected]; Michael A Langston - [email protected]; Arnold M Saxton* - [email protected]; Brynn H Voy - [email protected]
* Corresponding author
Abstract
Background: Network and clustering analyses of microarray co-expression correlation data often require application of a threshold to discard small correlations, thus reducing computational demands and decreasing the number of uninformative correlations. This study investigated threshold selection in the context of combinatorial network analysis of transcriptome data.
Findings: Six conceptually diverse methods - based on number of maximal cliques, correlation of control spots with expressed genes, top 1% of correlations, spectral graph clustering, Bonferroni correction of p-values, and statistical power - were used to estimate a correlation threshold for three time-series microarray datasets. The validity of thresholds was tested by comparison to thresholds derived from Gene Ontology information. Stability and reliability of the best methods were evaluated with block bootstrapping.
Two threshold methods, number of maximal cliques and spectral graph, used information in the correlation matrix structure and performed well in terms of stability. Comparison to Gene Ontology found thresholds from number of maximal cliques extracted from a co-expression matrix were the most biologically valid. Approaches to improve both methods were suggested.
Conclusion: Threshold selection approaches based on network structure of gene relationships gave thresholds with greater relevance to curated biological relationships than approaches based on statistical pair-wise relationships.
Introduction
To extract gene networks from microarray data, correla-tions are often used as a measure of gene co-expression. A typical microarray with 20,000 gene probes will produce 200 million correlations. Correlations below a threshold value, closer to zero, will be less meaningful. Hard and
soft threshold approaches have been applied to biological data. Hard thresholds discard gene pairs with correlation below the threshold, while soft thresholds use the correla-tion value to weight gene network relacorrela-tionships. Zhang and Horvath [1] concluded that soft thresholds based on aggregate, modular relationships between genes gave
Published: 2 December 2009
BMC Research Notes 2009, 2:240 doi:10.1186/1756-0500-2-240
Received: 27 August 2009 Accepted: 2 December 2009
This article is available from: http://www.biomedcentral.com/1756-0500/2/240
© 2009 Saxton et al; licensee BioMed Central Ltd.
more robust results, but data reduction by a hard thresh-old is often essential for computational tractability of graph algorithms.
We focus on relevance networks, created by applying a hard threshold to the gene expression correlation matrix [2], then extracting gene networks. The resulting networks have been well documented in recent literature to yield sets of co-expressed genes [3-5]. Relevance networks are easily converted to graphs, with genes as vertices, only connected by an edge if their correlation is above the threshold. A clique is a sub-graph in which all nodes are connected to each other [6]. A disadvantage of using cliques is the computational requirements, which grow exponentially with number of genes. Thus hard threshold selection is required when performing clique extraction on microarray data.
Current approaches to threshold selection are typically statistically based, and do not fully reflect the connectivity of the data [7]. Methods based on statistical arguments may not necessarily yield biologically significant relation-ships [3,8].
Some studies used an arbitrary threshold correlation such as 0.80 [9]. Moriyama et al. [10] obtained random corre-lation distributions for gene pairs by permuting their expression values and defended their choice of threshold based on statistical significance. Lee et al. [11] used the top 1% of correlations (absolute value) to build a co-expression network. Voy et al. [3] used distribution of cor-relations of genes with buffer spots on the arrays to select a threshold correlation value of 0.875.
However, using connectivity of the data to derive thresh-olds has been suggested. Langston et al. [12] recom-mended use of ontological distance, statistical significance and various graph structural attributes to arrive at a correlation threshold. Palla et al. [13] found that a threshold based on clique size was effective at sepa-rating networks.
Here two threshold selection methods based on correla-tion graph structure are compared with common statisti-cally based methods. The graph based methods used spectral properties [14] or number of cliques to select a threshold. Objectives were to compare the various hard threshold methods for validity (retention of biological information), stability, and reliability.
Methods
DatasetsThree yeast S. cerevisiae time-series datasets were chosen for this study: 31 arrays for Anoxia state [15], 21 arrays for Reoxygenation state [15] and 18 arrays from yeast cultures
synchronized using Alpha-factor arrest [16]. Data are available on Gene Expression Omnibus under GSE2246, GSE2267 and GSE22. Extensive GO annotation for S. cer-evisiae genes influenced the selection. Exploratory data analyses within each dataset using PCA, box plots and pair-wise correlations between arrays found no outlier arrays. Quantile plots showed data were normally distrib-uted, and distribution of correlations among gene expres-sion profiles had the expected bell-shaped curve, so all data were used.
Software
Software written by Langston and colleagues (University of Tennessee) was used, including Datagen version 1.4a for computing correlations, maximal clique enumeration code version 2.0.1 [17], spectral analysis code [14], and GO Pairwise Similarity analysis code version 1.0. Matrix calculations for spectral graph analysis were carried out in MATLAB 7.0. P-values were calculated in SAS version 9.1 (Cary; NC). Statistical power was calculated using PASS statistical software http://www.ncss.com/pass.html.
Threshold Estimation
Six conceptually different approaches were evaluated:
1) Numbers of maximal cliques were calculated at each potential correlation threshold, starting at r = 0.99. The threshold was lowered, in steps of 0.01, and number of maximal cliques increased due to greater connections among genes. When clique number increased two times (Maximal Clique-2) or three times (Maximal Clique-3) the previous value, that correlation was chosen as the threshold.
2) For each potential threshold correlation value, spectral graph theory [18] was used to decompose the resulting graph into eigenvalues and eigenvectors, which were used to enumerate spectral clusters [19]. As the potential threshold was incrementally lowered in steps of 0.01, a peak in the number of clusters occurs, and the threshold is chosen to maximize cluster number. Details are in [14].
3) Correlations of control spots with all other genes on the array were calculated, creating a null distribution. The 99th percentile correlation value (absolute value) of this distribution gave the threshold.
5) A p-value for every correlation was computed, testing if the correlation was zero (Fisher's z-transformation). Threshold estimate was the correlation value correspond-ing to the critical Bonferroni p-value, 0.05/number of cor-relations. This threshold will remove any correlations that are statistically equal to zero.
6) Statistical power calculations were used to find the cor-relation value that gave an 80% chance of rejecting the null hypothesis, Ho: correlation = 0. Type I error rate in these calculations was Bonferroni-adjusted to correct for multiple testing.
Further details on computing these threshold estimation methods are in the Additional file 1.
Performance Evaluation
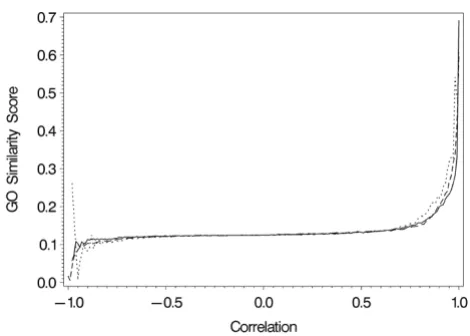
Performance of the threshold estimation methods was evaluated by comparison to a biologically based Gene Ontology threshold. GO data used was gene_ontology_edit.obo.2008-05-01.gz. The biological meaning for each correlation bin (in 0.01 increments) was the average of functional similarity scores for all gene pairs within that correlation bin. Functional similarity for a pair of genes was defined as log(n/N)/log(2/N), where n is the number of genes in the lowest GO category that con-tained both genes, and N is the total number of genes annotated for the organism. The formula normalizes Functional similarity to a 0 to 1 range, and a value of 1 means the GO category contained only the two genes being considered (perfect similarity). GO threshold esti-mate was defined as the correlation at which change in average functional similarity exceeded median change plus half its standard deviation, thus identifying where biological information begins to accumulate.
To study stability of the methods, 10,000 block bootstrap samples were created by sampling arrays with replace-ment from each block. Blocks were defined to be 2 or 3 adjacent time periods, such that each block contained 3 or 4 arrays. Block bootstrapping was necessary to preserve as much as possible the time-course dependency structure of the experiments [20]. For each of the 10,000 samples, a threshold estimate was calculated by each method, and the distribution of these thresholds was used to compare threshold methods for stability.
Results
Functional similarity scores for the three datasets are dis-played in Figure 1. Changes in scores across correlation values were similar for all datasets, and the lack of GO term relationship for negative correlations is striking. Because of this, the GO threshold was defined by the curve for positive correlations. Biological relationship
begins to increase sharply above a correlation value of 0.80, and this produced the GO thresholds in Table 1.
Estimated thresholds obtained by each method are listed in Table 1 for the three datasets. If estimated threshold is higher than the biological threshold, false negatives will occur, because data reduction by the higher threshold will remove real relationships. Conversely, using a threshold below the biological threshold will create false positives, and relationships that are not real would be included in the network. In discovery-based settings, false positives are more acceptable, as they can be removed with further validation. Thus methods that estimate a lower threshold are preferred. Maximal Clique-2 and Spectral Clustering performed better than the other methods, based on summed absolute deviations from GO threshold (Table 1). Maximal Clique-2 was further from the GO threshold, but might be preferred since it never exceeded that thresh-old.
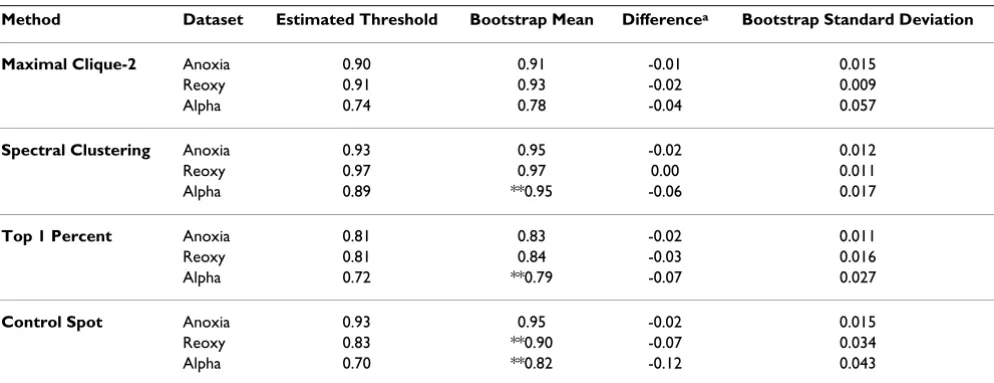
The estimated threshold derived for selected methods for each dataset is compared to bootstrap distributions in Table 2. The best methods from above, Maximal Clique-2 and Spectral Clustering, and two other methods for com-parative purposes were chosen for this analysis. The boot-strap mean was never less than the estimated threshold, and occasionally was two standard deviations above. This upward bias in correlation is expected, as each time period had a limited number of arrays, making it likely that the identical array would be resampled. However, Maximal Clique and Spectral Clustering methods showed more resistance to this bias. The bootstrap standard deviation measures ability of the methods to produce similar
[image:3.612.318.553.85.253.2]Change in GO functional similarity score across correlation values
Figure 1
threshold estimates from randomized arrays. Again the network-based methods showed the lowest standard devi-ations, and highest stability. All methods showed poorest performance with the Alpha dataset, possibly due to its unreplicated design. This makes it less likely that all time levels would be represented in the bootstrap samples, whereas the other datasets had glucose and galactose bio-logical replicates.
Discussion
The two network-based methods, Maximal Clique-2 and Spectral Clustering, performed very well in terms of
boot-strap stability and biological validity. Though Maximal Clique-2 method gave thresholds close to the biological threshold, and always below, the method had slightly higher bootstrap standard deviations. The robustness of the Maximal Clique-2 algorithm could be enhanced by exclusion of smaller cliques in the graph, for example cliques of size 3. Spectral Clustering thresholds were on average closer to biological thresholds, but too often exceeded it. However, if all thresholds for Spectral Cluster-ing were lowered by 0.05, it would have been clearly the best method. Further fine-tuning of the parameters in the algorithm (size of sliding window, different tolerance
lev-Table 1: Estimated threshold for each method by dataset, with methods sorted by the sum of absolute deviations from the GO functional similarity threshold.
Method Anoxia Reoxygenation Alpha Absolute deviations from GO threshold
GO Functional Similarity 0.97 0.92 0.85
Spectral Clustering 0.93 0.97a 0.89 0.04+0.05+0.04 = 0.13
Maximal Clique-2 0.90 0.91 0.74 0.07+0.01+0.11 = 0.19 Power 0.88 0.94 0.96 0.09+0.02+0.11 = 0.22 Bonferroni adjustment 0.85 0.93 0.95 0.12+0.01+0.10 = 0.23 Control-Spot 0.93 0.83 0.70 0.04+0.09+0.15 = 0.28 Maximal Clique-3 0.87 0.89 0.60 0.10+0.03+0.25 = 0.38 Top 1 Percent 0.81 0.81 0.72 0.16+0.11+0.13 = 0.40
[image:4.612.51.554.110.307.2]aThresholds above the GO functional similarity threshold are in bold.
Table 2: Summary of bootstrap results compares the estimated threshold with the bootstrap distribution for the four selected methods.
Method Dataset Estimated Threshold Bootstrap Mean Differencea Bootstrap Standard Deviation
Maximal Clique-2 Anoxia 0.90 0.91 -0.01 0.015
Reoxy 0.91 0.93 -0.02 0.009 Alpha 0.74 0.78 -0.04 0.057
Spectral Clustering Anoxia 0.93 0.95 -0.02 0.012
Reoxy 0.97 0.97 0.00 0.011 Alpha 0.89 **0.95 -0.06 0.017
Top 1 Percent Anoxia 0.81 0.83 -0.02 0.011
Reoxy 0.81 0.84 -0.03 0.016 Alpha 0.72 **0.79 -0.07 0.027
Control Spot Anoxia 0.93 0.95 -0.02 0.015
Reoxy 0.83 **0.90 -0.07 0.034 Alpha 0.70 **0.82 -0.12 0.043
a Estimated threshold minus bootstrap mean.
[image:4.612.58.555.519.710.2]els for cluster formation) may improve the method's validity. In a recent paper, Almendral and Díaz-Guilera [21] documented the sensitivity of the non-zero eigen-value to network changes. All methods had subjective set-tings, and further work on many more species and experiments would be needed to establish best choices.
The results from this study complement the work of Zhang and Horvath [1] which concluded that thresholds based on the scale-free topology - the formation of hubs and densely-connected sub-graphs - produced more robust results. The statistically-based methods studied here are directly dependent on the correlation distribution and thus were unable to capture biological relationships. Although the Control-Spot method is based on logical reasoning, the high correlation of control spots with other genes on the arrays weakened the method's validity. The Top 1% Correlations method is arbitrary, and failed to capture biological relationships. Statistical considerations used for the Power and Bonferroni methods were also not able to identify biological relationships, reflecting the well-known discrepancy between biological and statistical significance. Experiments that are small will produce thresholds that are too high, while large experiments will give excessively low thresholds, even though the biologi-cal relationships are the same.
The GO similarity measure of biological validity we have used, however, is by no means perfect and is just one way of quantifying biological information. Khatri and Dragh-ici [22] have listed limitations of GO in detail. We also found low GO scores at high negative correlations as com-pared to the high GO score associated with high positive correlations for all three datasets. The drop in GO score at high negative correlations could be due to several reasons, for example experimental and analytical limitations to detect biologically negative correlations among genes, and limited gene annotations [11]. As the quantification of biological information in data gets more precise, the selection of thresholds should become easier. In fact, note that a method like the GO threshold used here would be a logical choice if GO information were complete and accurate.
Competing interests
The authors declare that they have no competing interests.
Authors' contributions
BRB wrote code for the analyses, summarized results, and drafted the paper. All authors were involved in study design, and read and approved the final manuscript.
Additional material
Acknowledgements
This research has been supported in part by the National Institutes of Health under grants P01DA015027-01, R01HD052472-02, R01MH074460-01, U01AA013512 and U01AA013641-04 and by the UT-ORNL Science Alliance. Dr. E.J. Chesler was supported by NIAAA Integrative Neuro-science Initiative on Alcoholism under grants U01AA13499 and U24AA13513. This research used resources of the National Energy Research Scientific Computing Center, which is supported by the Office of Science of the U.S. Department of Energy under Contract No. DE-AC02-05CH11231. Additional support was provided by the University of Tennes-see Genome Science and Technology program. John Eblen, Andy Perkins, Gary Rogers and Yun Zhang helped with basic issues of algorithm synthesis. Drs. Bing Zhang and Roumyana Yordanova provided valuable comments on certain aspects of this study.
References
1. Zhang B, Horvath S: A general framework for weighted gene co-expression network analysis. Stat Appl Genet Mol Biol 2005, 4:. 2. Butte AJ, Tamayo P, Slonim D, Golub TR, Kohane IS: Discovering functional relationships between RNA expression and chem-otherapeutic susceptibility using relevance networks. Proc Natl Acad Sci USA 2000, 97(22):12182-12186.
3. Voy BH, Scharff JA, Perkins AD, Saxton AM, Borate B, Chesler EJ, Branstetter LK, Langston MA: Extracting gene networks for low-dose radiation using graph theoretical algorithms. PLoS Com-put Biol 2006, 2(7):e89.
4. Yan X, Mehan MR, Huang Y, Waterman MS, Yu PS, Zhou XJ: A graph-based approach to systematically reconstruct human transcriptional regulatory modules. Bioinformatics 2007, 23(13):i577-586.
5. Freeman TC, Goldovsky L, Brosch M, van Dongen S, Maziere P, Gro-cock RJ, Freilich S, Thornton J, Enright AJ: Construction, visualisa-tion, and clustering of transcription networks from microarray expression data. PLoS Comput Biol 2007, 3(10):2032-2042.
6. Baldwin NE, Chesler EJ, Kirov S, Langston MA, Snoddy JR, Williams RW, Zhang B: Computational, integrative, and comparative methods for the elucidation of genetic coexpression net-works. J Biomed Biotechnol 2005, 2005(2):172-180.
7. Butte AJ, Kohane IS: Mutual information relevance networks: functional genomic clustering using pairwise entropy meas-urements. Pac Symp Biocomput 2000:418-429.
8. Quackenbush J: Genomics. Microarrays--guilt by association. Science 2003, 302(5643):240-241.
9. Sanoudou D, Haslett JN, Kho AT, Guo S, Gazda HT, Greenberg SA, Lidov HG, Kohane IS, Kunkel LM, Beggs AH: Expression profiling reveals altered satellite cell numbers and glycolytic enzyme transcription in nemaline myopathy muscle. Proc Natl Acad Sci USA 2003, 100(8):4666-4671.
10. Moriyama M, Hoshida Y, Otsuka M, Nishimura S, Kato N, Goto T, Taniguchi H, Shiratori Y, Seki N, Omata M: Relevance network between chemosensitivity and transcriptome in human hepatoma cells. Mol Cancer Ther 2003, 2(2):199-205.
11. Lee HK, Hsu AK, Sajdak J, Qin J, Pavlidis P: Coexpression analysis of human genes across many microarray data sets. Genome Res 2004, 14(6):1085-1094.
Additional file 1
Methodology for Threshold Estimation. Details on the six threshold esti-mation methods are presented in a computationally oriented manner.
Click here for file
Publish with BioMed Central and every scientist can read your work free of charge
"BioMed Central will be the most significant development for disseminating the results of biomedical researc h in our lifetime."
Sir Paul Nurse, Cancer Research UK
Your research papers will be:
available free of charge to the entire biomedical community
peer reviewed and published immediately upon acceptance
cited in PubMed and archived on PubMed Central
yours — you keep the copyright
Submit your manuscript here:
http://www.biomedcentral.com/info/publishing_adv.asp
BioMedcentral 12. Langston MA, Perkins AD, Saxton AM, Scharff JA, Voy BH:
Innova-tive Computational Methods For Transcriptomic Data Anal-ysis: A Case Study in the Use Of FPT For Practical Algorithm Design and Implementation. ACM symposium on Applied Computing: 2006; Dijon, France 2006.
13. Palla G, Derenyi I, Farkas I, Vicsek T: Uncovering the overlapping community structure of complex networks in nature and society. Nature 2005, 435(7043):814-818.
14. Perkins AD, Langston MA: Threshold selection in gene co-expression networks using spectral graph theory techniques. BMC Bioinformatics 2009, 10(Suppl 11):S4.
15. Lai LC, Kosorukoff AL, Burke PV, Kwast KE: Metabolic-state-dependent remodeling of the transcriptome in response to anoxia and subsequent reoxygenation in Saccharomyces cerevisiae. Eukaryot Cell 2006, 5(9):1468-1489.
16. Spellman PT, Sherlock G, Zhang MQ, Iyer VR, Anders K, Eisen MB, Brown PO, Botstein D, Futcher B: Comprehensive identification of cell cycle-regulated genes of the yeast Saccharomyces cer-evisiae by microarray hybridization. Mol Biol Cell 1998, 9(12):3273-3297.
17. Zhang Y, Abu-Khzam FN, Baldwin NE, Chesler EJ, Langston MA, Sam-atova NF: Genome-scale computational approaches to mem-ory-intensive applications in systems biology. Supercomputing 2005 Proceedings of the ACM/IEEE SC Conference: 2005 2005:12. 18. Chung FRK: Spectral Graph Theory. American Mathematical
Society; 1994.
19. Ding CHQ, He X, Zha H: A spectral method to separate discon-nected and nearly discondiscon-nected Web graph components. Proceedings of the Seventh ACM SIGKDD International Conference on Knowledge Discovery and Data Mining. San Francisco, California 2001:275-280 [http://ranger.uta.edu/~chqding/papers/kdd3a.ps]. 20. Politis DN: The impact of bootstrap methods on time series
analysis. Statistical Science 2003, 18(2):219-230.
21. Almendral JA, Diaz-Guilera A: Dynamical and spectral proper-ties of complex networks. New Journal of Physics 2007, 9:187. 22. Khatri P, Draghici S: Ontological analysis of gene expression