R E S E A R C H A R T I C L E
Open Access
The footprint of the ageing stroma in older
patients with breast cancer
Barbara Brouwers
1,2*†, Debora Fumagalli
3†, Sylvain Brohee
3, Sigrid Hatse
1,2, Olivier Govaere
4,5, Giuseppe Floris
4,5,
Kathleen Van den Eynde
4,5, Yacine Bareche
3, Patrick Schöffski
1,2, Ann Smeets
6, Patrick Neven
6,
Diether Lambrechts
7, Christos Sotiriou
3and Hans Wildiers
1,2,6Abstract
Background:Tumours are not only composed of malignant cells but also consist of a stromal micro-environment, which has been shown to influence cancer cell behaviour. Because the ageing process induces accumulation of senescent cells in the body, this micro-environment is thought to be different in cancers occurring in old patients compared with younger patients. More specifically, related fibroblastic features, such as the senescence-associated secretory profile (SASP) and the induction of autophagy, are suspected to stimulate tumour growth and progression.
Methods:We compared gene expression profiles in stromal fields of breast carcinomas by performing laser capture microdissection of the cancer-associated stroma from eight old (aged≥80 years at diagnosis) and nine young (aged <45 years at diagnosis) patients with triple-negative breast cancer. Gene expression data were obtained by microarray analysis (Affymetrix). Differential gene expression and gene set enrichment analysis (GSEA) were performed.
Results:Differential gene expression analysis showed changes reminiscent of increased growth, de-differentiation and migration in stromal samples of older versus younger patients. GSEA confirmed the presence of a SASP, as well as the presence of autophagy in the stroma of older patients.
Conclusions:We provide the first evidence in humans that older age at diagnosis is associated with a different stromal micro-environment in breast cancers. The SASP and the presence of autophagy appear to be important age-induced stromal features.
Keywords:Breast cancer, Stroma, Senescence, Senescence-associated secretory profile, Autophagy, Gene expression, Old patients, Ageing
Background
Oncological research over the past decades has been fo-cussed primarily tumour cell characteristics. However, tumoural masses are not exclusively composed of ma-lignant cells; they also comprise a stromal component containing endothelial cells, (myo)fibroblasts, smooth
muscle cells, adipocytes and inflammatory cells. Research on the stromal component of tumour masses has shown that stromal characteristics are correlated with disease out-come and behaviour [1–10] in several malignancies. The stroma seems to play a very important role in tumour initi-ation, progression and metastatic spread [11, 12]. The fibro-blasts contained in this stromal compartment show a specific phenotype and are called carcinoma-associated fibroblasts[13]. Because cellular senescence progressively occurs throughout a person’s lifetime in fibroblasts of various origins [14], it seems plausible that the charac-teristics of the stromal compartment of breast cancers would differ between young and older patients and that this could result in a pro-tumourigenic
micro-* Correspondence:brouwersbarbara@icloud.com
Barbara Brouwers and Debora Fumagalli share first authorship. Christos Sotiriou and Hans Wildiers share last authorship. †Equal contributors
1
Laboratory of Experimental Oncology (LEO), Department of Oncology, KU Leuven, Leuven, Belgium
2Department of General Medical Oncology, Leuven Cancer Institute,
University Hospitals Leuven, Leuven, Belgium
Full list of author information is available at the end of the article
environment with stimulation of proliferation, migra-tion/invasion and de-differentiation.
The incidence of breast cancer, the most frequent tumour occurring in women, increases with age [15, 16]. Cancer in older patients is thought to arise from lifelong exposure to harmful stimuli, such as DNA-damaging agents, oxidative stress factors and telomeric loss. In addition, the micro-environmental changes caused by senescent cells might also be an important harmful trigger. Breast cancer in young patients usually reflects either a genetic defect or the impact of early life-transforming effects on an imma-ture breast epithelium.
Senescence in general is a protective mechanism that shuts down damaged cells [17]. Nature has selected for this mechanism to protect young organisms from devel-oping cancer. Senescent cells are forced into a state of irreversible growth arrest [18, 19] and exhibit a specific phenotype characterised by enlarged size, flattened morph-ology, senescence-associated β-galactosidase activity, reor-ganisation of chromatin into foci of heterochromatin and resistance to apoptosis [20]. They also acquire the so-called senescence-associated secretory profile (SASP) [21, 22], maintaining the growth arrest and recruiting immune cells towards the damaged cells in order to eradicate them. However, the SASP also seems to have a detrimen-tal influence on nearby cells. Epithelial cells neighboured by senescent fibroblasts lose differentiated properties, become invasive and undergo full malignant transform-ation [20, 23–25]. In this process, a major role has been attributed to matrix metalloproteinase 3 [23] together with other components of the SASP [25, 26], such as inflammatory cytokines and chemokines. This concept of senescence as a useful cancer-protective mechanism in younger life but a detrimental cancer-promoting mechanism in later life has repeatedly been described as an example of ‘antagonistic pleiotropy’ [27, 28] in cellular or animal models [23, 24, 29–32]. Senescent cells have been reported in vivo in a variety of tissues of different organisms, including mice, primates and humans [14, 33–36]. Also, studies have provided evidence that in-creasing age does result in a higher frequency of senescent cells [14, 33, 34, 37], albeit mostly in the skin.
An additional mechanism that has been proposed to explain the tumour-promoting effects of a senescent micro-environment is the ‘the autophagic tumor stroma model of cancer’[38–42]. This model states that fibroblasts, in transition to a senescent state, activate the autophagic process. During this so-called autophagy-to-senescence transition (AST), the cells shift towards an aerobic gly-colysis metabolism, creating high-energy mitochondrial fuels that feed the nearby epithelial cancer cells. Autophagic fibroblasts were shown to have tumour- and metastasis-promoting activity [39]. The discovery of this concept was preceded by the finding that tumoural cells can induce
AST in surrounding fibroblasts by secreting hydrogen peroxide that causes oxidative stress and activation of au-tophagy in the fibroblasts. This process was named the re-verse Warburg effect(as opposed to the original idea, called theWarburg effect, by which aerobic glycolysis takes place in epithelial cancer cells). Fibroblasts displaying a constitu-tively activated autophagy programme turned out to show many morphological characteristics of senescence, including induction of P21WAF1/CIP1, which led to the hypothesis that AST is one of the mechanisms by which senescent stromal cells create a‘fertile soil’for the initiation and progression of cancer.
Despite this knowledge, stromal differences with increas-ing patient age have so far never been investigated in vivo, and little clinical evidence can be found for a more aggres-sive behaviour of tumour cells growing in a context of ‘older’stroma. On the contrary, breast cancers in older patients have in general been shown to grow more slowly and to behave less aggressively, even when adjusting for dif-ferent histological tumour characteristics [43, 44]. On these premises, we sought to compare gene expression profiles of tumour-adjacent stroma in older versus younger patients with breast cancer matched for other clinico-pathologic parameters.
Methods
Patient selection and clinical specimens
This study was approved by the ethics committee of the University Hospitals Leuven (Leuven, Belgium) in accord-ance with the International Conference on Harmonisation Harmonised Tripartite Guideline for Good Clinical Practice. Candidate patients were selected using the following criteria: (1) aged <45 years or ≥80 years, (2) no neo-adjuvant chemotherapy treatment or hormone treatment before surgery, (3) surgery for early triple-negative breast cancer (defined as oestrogen receptor [ER] and pro-gesterone receptor [PR] <1% and human epidermal growth factor receptor 2 [HER2] <2+ by immunohistochemistry or fluorescent in situ hybridisation-negative) with fresh frozen resection specimens available (stored at−80 °C at the path-ology department of the University Hospitals Leuven) and (4) no chronic inflammatory diseases to exclude confound-ing variables.
basis of the above criteria, 17 female patients with breast cancer (9 young patients <45 years old at diagnosis and 8 old patients ≥80 years old at diagnosis) were included in the study.
Staining procedures and laser capture microdissection Preparation of the tissue slides
For the selected patients, ten frozen sections of 10-μm thickness were mounted onto specific membrane slides (steel frames with polyethylene terephthalate membrane, catalogue number 11505151; Leica Microsystems, Wetzlar, Germany) and were kept at−80 °C until the staining and dissection procedure was started. All tissue slides under-went LCM within 7 days after preparation.
Staining
Prior to LCM, tumour slides were stained with cresyl violet following a procedure optimised for maximising RNA yield. Briefly, tumour slides were taken from−80 °C and were fixed into a 95% ethanol solution for 30 seconds. Next, they were transferred to ethanol solutions with progressively decreasing concentrations (75%, 50%) for 30 seconds each. Then, cresyl violet dye (cresyl violet acetate pure high-purity biological stain, catalogue number AC229630050; Acros Organics, Geel, Belgium) at a concen-tration of 0.2% was applied for 30–60 seconds, after which dehydration of the tissue was achieved by rinsing the slides with increasing concentrations of ethanol (50%, 75%, 95%, 100%, 100%) for 15 seconds each.
Laser capture microdissection
After the staining procedure, LCM was accomplished within 30 minutes by using a laser microscope (LMD6500; Leica Microsystems). Dissected stromal pieces were im-mediately collected in an RNase/DNase-free capture vial
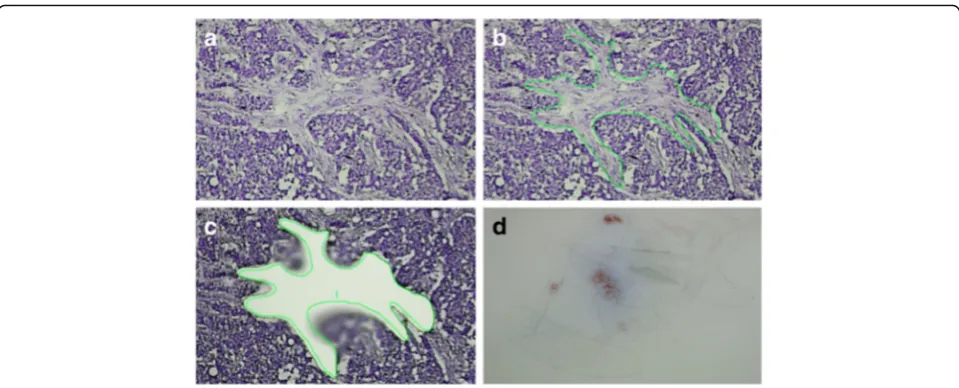
containing 25 μl of stabilising RNA extraction buffer. During dissection, care was taken to avoid blood vessels, zones containing infiltrating immune cells, or fatty tissue. Dissection was restricted to fields contained within the perimeter of the invasive tumour or at the invasive front of the tumour, but in direct relationship with invasive epithelial nests. Pictures were taken before and after the dissection procedure (see Fig. 2 as an example). After finishing dissection for one tumour slide, 25μl of RNA ex-traction buffer was added to the capture vial, and lysis was performed for 30 minutes at 42 °C. The obtained lysate was stored at −80 °C until further RNA extraction. For each patient, several tumour slides were laser-dissected using this procedure (seven to ten slides per patient ac-cording to size and amount of stromal fields within the tumour tissue).
RNA extraction and amplification
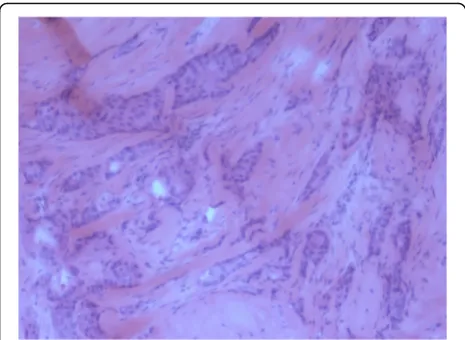
RNA isolation was performed using the Arcturus PicoPure RNA extraction kit (PicoPureTMFrozen RNA Isolation Kit, catalogue number KIT0202/KIT0204; Arcturus, Mountain View, CA, USA) according to the manufacturer’s protocol. Briefly, lysates from the same tumour were combined, and after addition of 50μl of ethanol 70%, the pooled samples were passed onto pre-conditioned RNA extraction col-umns. After centrifugation and washing, DNase was applied onto the column to eliminate residual DNA (RNase-Free DNase Set, catalogue number 79254; QIAGEN, Hilden, Germany). After a washing step, the purified RNA was eluted from the column using 11 μl of elution buffer. Samples were subsequently tested for RNA quality (RNA Quality Indicator) on the Experion™ system (Bio-Rad Laboratories, Hercules, CA, USA) using high-sensitivity RNA chips, and concentrations were measured using the NanoDrop 2000 spectrophotometer (Thermo Scientific, Wilmington, DE, USA). The quality of the RNA varied between samples, which is a known limitation of the LSM procedure [45] (see Additional file 1). Prior to microarray analysis, RNA was pre-amplified using the Ovation PicoSL WTA System V2 (catalogue number 3312-24; NuGEN, Leek, The Netherlands). The Ribo-SPIA (single-primer isothermal amplification) technology implemented in this procedure is ideal for amplification of partially degraded and compromised RNA samples, contributes minimal coverage bias, and is highly reproducible [46]. The procedure is widely used in LCM projects and does not introduce significant bias into relative gene expression values [47, 48]. A clean-up step using the MinElute Reaction Cleanup Kit (catalogue number 28204; QIAGEN) was also incorporated into the amplification procedure. After NuGEN pre-amplification of the RNA samples, quan-titative reverse transcription-polymerase chain reaction as-sessment of common housekeeping genes showed that the Fig. 1Haematoxylin and eosin-stain of selected tumour block for
[image:3.595.57.290.87.257.2]amplification procedure had resulted in highly concentrated complementary DNA fragments with sufficient size to be recognised by the primers (data not shown).
Gene expression analysis
Gene expression was analysed using Human Genome U133Plus2 microarray chips (Affymetrix, Santa Clara, CA, USA) at the J.C. Heuson Breast Cancer Translational Research Laboratory (Jules Bordet Institute, Brussels, Belgium) according to the manufacturer’s instructions. Standard quality assessments were conducted on the resulting files, and all samples passed quality assurance for further analysis. Expression values were computed using the frozen robust multi-array analysis (fRMA) normalisation method (‘frma’package in Bioconductor) [49]. When multiple probe sets mapped to the same official gene symbol, we computed their average value. The expression data are available from the Gene Ex-pression Omnibus (GEO) repository under accession number [GEO:GSE90521].
Statistical analysis
Differential expression analysis
To identify the genes that were differentially expressed in the two age categories (<45 years versus ≥80 years), we computed for each probe set the mean expression value in both age groups and calculated the fold change of these means (i.e., the ratio of the average expression of this particular gene in young and old patients). We used a Wilcoxon test. Genes with fold change greater than 1.5 or less than −1.5 were considered differentially expressed.
In silico validation
To validate the obtained differential gene expression, gene expression data sets from other projects in which researchers investigated laser-dissected stromal samples obtained from patients with breast cancer were retrieved. The data sets were available in the National Center for Biotechnology Information (NCBI) GEO database under accession numbers [GEO:GSE5847] [9], [GEO:GSE4823] [7] and [GEO:GSE14548] [8].
Gene set enrichment analysis
Gene set enrichment analysis (GSEA) was conducted using our local reimplementation of the GSEA algorithm developed at the Broad Institute [50]. Briefly, genes were ranked according to their fold change in young versus old patients, and an enrichment score (ES) ranging from−1 to 1 was computed. This score reflects to what extent the genes constituting a given reference class are enriched among the top up- or down-regulated genes of the differen-tial expression analysis. Low (negative) ES values corres-pond to an enrichment of the reference class among genes that are up-regulated in old patients, whereas high (positive) ES values correspond to an enrichment of the reference class among genes that are up-regulated in young patients. The false discovery rate-adjusted p values associated with each ES value reflect the prob-ability that an ES at least as high or as low could be obtained merely by chance. Adjusted p values <0.05 were considered significant.
Results
Patient demographics
For the purpose of the present study, 17 female patients (9 young patients <45 years old at diagnosis and 8 old Fig. 2Laser capture microdissection of cancer associated stroma.a–cMicrodissection procedure.dYield of stromal pieces after repeated
[image:4.595.58.538.86.280.2]patients aged≥80 years at diagnosis) with available fresh frozen breast cancer resection specimens and with suffi-cient stroma to allow laser microdissection were selected. Extreme age categories were chosen to maximise the probability of detecting significant age-related differences. All patients underwent surgery for early breast cancer at the Multidisciplinary Breast Center (University Hospitals Leuven, Belgium) between 2000 and 2011. All patients had invasive ductal carcinomas >1.5 cm and were negative for ER, PR and HER2. Additional patient and tumour characteristics are summarised in Table 1. The choice of triple-negative breast cancers was made to exclude cancer-related confounding factors as much as possible.
Differential gene expression analysis
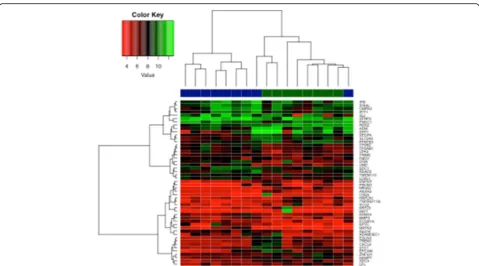
A differential gene expression analysis using a 1.5-fold up- or down-regulation as the cut-off revealed 120 genes that were up-regulated in older subjects’stromal samples and 107 genes that were down-regulated in older sub-jects’stromal samples compared with younger subjects (Table 2). Heat maps constructed using the 25 top up-and down-regulated genes are shown in Fig. 3.
Data validation
We used publicly available data sets ([GEO:GSE5847] [9], 34 samples; [GEO:GSE4823] [7], 33 samples; [GEO:GSE14548] [8], 9 samples) to validate our find-ings because of the limited size of our study group. We found a significant overlap for ten genes, of which five
showed higher expression in older patients (p< 0.01) and five showed lower expression in older patients (p< 0.01). Venn diagrams depicting the overlapping genes are shown in Fig. 4; gene details are listed in Table 3.
Gene set enrichment analysis
Next, we performed GSEA to measure the expression of pre-defined gene sets related to specific biological pro-cesses. The resulting ES, which ranges from−1 to 1, reflects the enrichment in genes of a given reference class among the top up- or down-regulated genes from the individual gene ranking. Plots are shown in Figs. 5 and 6. The genes that were included in each GSEA, with respective literature references, are listed in Table 4.
Senescence genes
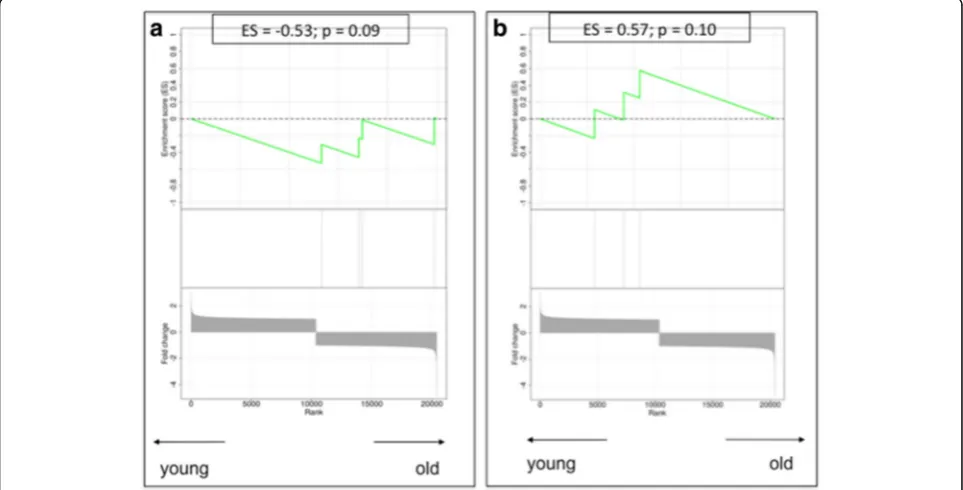
In the individual gene expression analysis, no significant difference was found for genes known to be associated with senescence, such as CDKN1A, CDKN2A,TP53, GLB1 or the retinoblastoma (RB) genes. Nevertheless, the enrich-ment analysis for this gene set resulted in an ES of−0.53, suggesting enrichment of senescence genes in the stroma of older patients, although statistical significance was not reached (p= 0.09) (Fig. 5a). The lack of significance might be due to the small sample size of the reference classes.
DNA damage response
[image:5.595.58.541.471.723.2]None of the three most important components of the DNA damage response, namely ATM, NBN (NBS1) and CHK2, were differentially expressed between young and
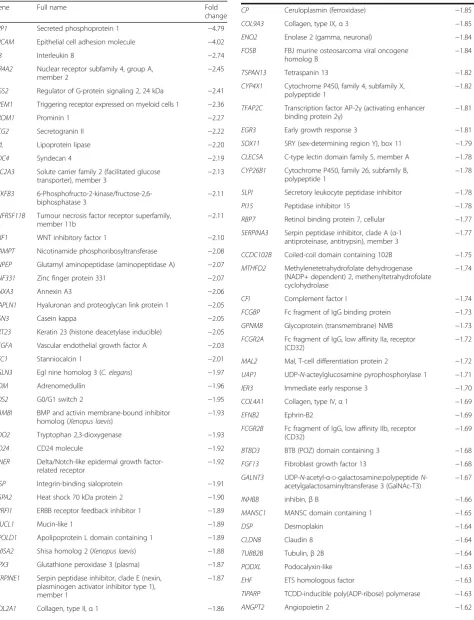
Table 1Patient and tumour characteristics
Patient Age at diagnosis (years) ER PR HER2 Tumour type Tumour grade Maximum tumour size (cm) pT stage pN stage
6 27 Neg Neg Neg Ductal 3 2.3 2 0
5 30 Neg Neg Neg Ductal 3 2.5 2 0
7 32 Neg Neg Neg Ductal 3 2.2 2 0
1 33 Neg Neg Neg Ductal 3 2.8 2 0
3 39 Neg Neg Neg Ductal 3 3.0 2 0
2 43 Neg Neg Neg Ductal 3 3.0 2 2a
4 44 Neg Neg Neg Ductal 3 2.8 2 0
8 44 Neg Neg Neg Ductal 3 3.5 2 0
9 44 Neg Neg Neg Ductal 3 3.0 2 0
12 80 Neg Neg Neg Ductal 3 4.0 2 0
16 82 Neg Neg Neg Ductal 3 3.5 2 0
17 82 Neg Neg Neg Ductal 3 1.5 1c 0
13 82 Neg Neg Neg Ductal 2 3.0 2 3a
15 83 Neg Neg Neg Ductal 3 3.8 2 1a
10 83 Neg Neg Neg Ductal 3 3.2 2 0
11 86 Neg Neg Neg Ductal 3 3.0 2 0
14 87 Neg Neg Neg Ductal 3 2.0 1c 0
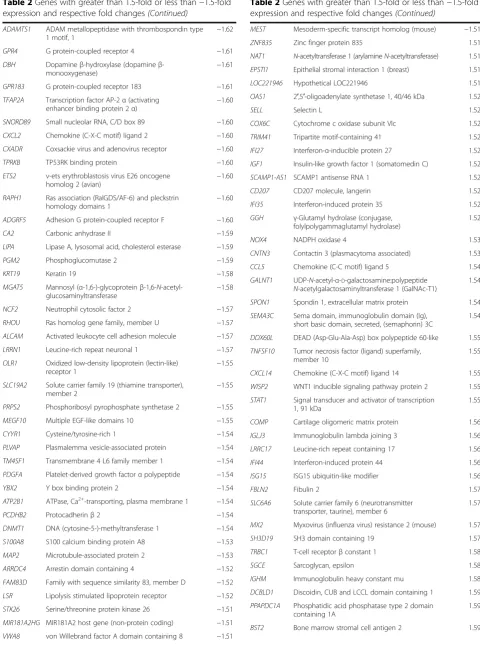
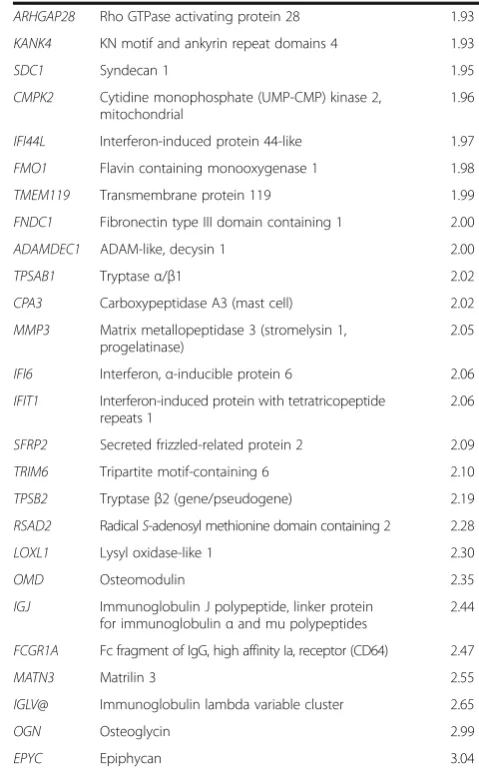
Table 2Genes with greater than 1.5-fold or less than−1.5-fold expression and respective fold changes
Gene Full name Fold
change
SPP1 Secreted phosphoprotein 1 −4.79
EPCAM Epithelial cell adhesion molecule −4.02
IL8 Interleukin 8 −2.74
NR4A2 Nuclear receptor subfamily 4, group A,
member 2 −
2.45
RGS2 Regulator of G-protein signaling 2, 24 kDa −2.41
TREM1 Triggering receptor expressed on myeloid cells 1 −2.36
PROM1 Prominin 1 −2.27
SCG2 Secretogranin II −2.22
LPL Lipoprotein lipase −2.20
SDC4 Syndecan 4 −2.19
SLC2A3 Solute carrier family 2 (facilitated glucose transporter), member 3
−2.13
PFKFB3 6-Phosphofructo-2-kinase/fructose-2,6-biphosphatase 3
−2.11
TNFRSF11B Tumour necrosis factor receptor superfamily, member 11b
−2.11
WIF1 WNT inhibitory factor 1 −2.10
NAMPT Nicotinamide phosphoribosyltransferase −2.08
ENPEP Glutamyl aminopeptidase (aminopeptidase A) −2.07
ZNF331 Zinc finger protein 331 −2.07
ANXA3 Annexin A3 −2.06
HAPLN1 Hyaluronan and proteoglycan link protein 1 −2.05
CSN3 Casein kappa −2.05
KRT23 Keratin 23 (histone deacetylase inducible) −2.05
VEGFA Vascular endothelial growth factor A −2.03
STC1 Stanniocalcin 1 −2.01
EGLN3 Egl nine homolog 3 (C. elegans) −1.97
ADM Adrenomedullin −1.96
G0S2 G0/G1 switch 2 −1.95
BAMBI BMP and activin membrane-bound inhibitor
homolog (Xenopus laevis) −
1.93
TDO2 Tryptophan 2,3-dioxygenase −1.93
CD24 CD24 molecule −1.92
DNER Delta/Notch-like epidermal growth factor-related receptor
−1.92
IBSP Integrin-binding sialoprotein −1.91
HSPA2 Heat shock 70 kDa protein 2 −1.90
ERRFI1 ERBB receptor feedback inhibitor 1 −1.89
MUCL1 Mucin-like 1 −1.89
APOLD1 Apolipoprotein L domain containing 1 −1.89
SHISA2 Shisa homolog 2 (Xenopus laevis) −1.88
GPX3 Glutathione peroxidase 3 (plasma) −1.87
SERPINE1 Serpin peptidase inhibitor, clade E (nexin, plasminogen activator inhibitor type 1), member 1
−1.87
COL2A1 Collagen, type II,α1 −1.86
Table 2Genes with greater than 1.5-fold or less than−1.5-fold expression and respective fold changes(Continued)
CP Ceruloplasmin (ferroxidase) −1.85
COL9A3 Collagen, type IX,α3 −1.85
ENO2 Enolase 2 (gamma, neuronal) −1.84
FOSB FBJ murine osteosarcoma viral oncogene homolog B
−1.84
TSPAN13 Tetraspanin 13 −1.82
CYP4X1 Cytochrome P450, family 4, subfamily X,
polypeptide 1 −
1.82
TFAP2C Transcription factor AP-2γ(activating enhancer
binding protein 2γ) −
1.81
EGR3 Early growth response 3 −1.81
SOX11 SRY (sex-determining region Y), box 11 −1.79
CLEC5A C-type lectin domain family 5, member A −1.78
CYP26B1 Cytochrome P450, family 26, subfamily B, polypeptide 1
−1.78
SLPI Secretory leukocyte peptidase inhibitor −1.78
PI15 Peptidase inhibitor 15 −1.78
RBP7 Retinol binding protein 7, cellular −1.77
SERPINA3 Serpin peptidase inhibitor, clade A (α-1 antiproteinase, antitrypsin), member 3
−1.77
CCDC102B Coiled-coil domain containing 102B −1.75
MTHFD2 Methylenetetrahydrofolate dehydrogenase
(NADP+ dependent) 2, methenyltetrahydrofolate cyclohydrolase
−1.74
CFI Complement factor I −1.74
FCGBP Fc fragment of IgG binding protein −1.73
GPNMB Glycoprotein (transmembrane) NMB −1.73
FCGR2A Fc fragment of IgG, low affinity IIa, receptor
(CD32) −
1.72
MAL2 Mal, T-cell differentiation protein 2 −1.72
UAP1 UDP-N-acteylglucosamine pyrophosphorylase 1 −1.71
IER3 Immediate early response 3 −1.70
COL4A1 Collagen, type IV,α1 −1.69
EFNB2 Ephrin-B2 −1.69
FCGR2B Fc fragment of IgG, low affinity IIb, receptor (CD32)
−1.69
BTBD3 BTB (POZ) domain containing 3 −1.68
FGF13 Fibroblast growth factor 13 −1.68
GALNT3 UDP-N-acetyl-α-D-galactosamine:polypeptideN -acetylgalactosaminyltransferase 3 (GalNAc-T3) −
1.67
INHBB inhibin,βB −1.66
MANSC1 MANSC domain containing 1 −1.65
DSP Desmoplakin −1.64
CLDN8 Claudin 8 −1.64
TUBB2B Tubulin,β2B −1.64
PODXL Podocalyxin-like −1.63
EHF ETS homologous factor −1.63
TIPARP TCDD-inducible poly(ADP-ribose) polymerase −1.63
Table 2Genes with greater than 1.5-fold or less than−1.5-fold expression and respective fold changes(Continued)
ADAMTS1 ADAM metallopeptidase with thrombospondin type
1 motif, 1 −
1.62
GPR4 G protein-coupled receptor 4 −1.61
DBH Dopamineβ-hydroxylase (dopamineβ
-monooxygenase) −
1.61
GPR183 G protein-coupled receptor 183 −1.61
TFAP2A Transcription factor AP-2α(activating enhancer binding protein 2α)
−1.60
SNORD89 Small nucleolar RNA, C/D box 89 −1.60
CXCL2 Chemokine (C-X-C motif) ligand 2 −1.60
CXADR Coxsackie virus and adenovirus receptor −1.60
TPRKB TP53RK binding protein −1.60
ETS2 v-ets erythroblastosis virus E26 oncogene homolog 2 (avian)
−1.60
RAPH1 Ras association (RalGDS/AF-6) and pleckstrin homology domains 1
−1.60
ADGRF5 Adhesion G protein-coupled receptor F −1.60
CA2 Carbonic anhydrase II −1.59
LIPA Lipase A, lysosomal acid, cholesterol esterase −1.59
PGM2 Phosphoglucomutase 2 −1.59
KRT19 Keratin 19 −1.58
MGAT5 Mannosyl (α-1,6-)-glycoproteinβ-1,6-N -acetyl-glucosaminyltransferase
−1.58
NCF2 Neutrophil cytosolic factor 2 −1.57
RHOU Ras homolog gene family, member U −1.57
ALCAM Activated leukocyte cell adhesion molecule −1.57
LRRN1 Leucine-rich repeat neuronal 1 −1.57
OLR1 Oxidized low-density lipoprotein (lectin-like) receptor 1
−1.55
SLC19A2 Solute carrier family 19 (thiamine transporter), member 2
−1.55
PRPS2 Phosphoribosyl pyrophosphate synthetase 2 −1.55
MEGF10 Multiple EGF-like domains 10 −1.55
CYYR1 Cysteine/tyrosine-rich 1 −1.54
PLVAP Plasmalemma vesicle-associated protein −1.54
TM4SF1 Transmembrane 4 L6 family member 1 −1.54
PDGFA Platelet-derived growth factorαpolypeptide −1.54
YBX2 Y box binding protein 2 −1.54
ATP2B1 ATPase, Ca2+-transporting, plasma membrane 1 −1.54
PCDHB2 Protocadherinβ2 −1.54
DNMT1 DNA (cytosine-5-)-methyltransferase 1 −1.54
S100A8 S100 calcium binding protein A8 −1.53
MAP2 Microtubule-associated protein 2 −1.53
ARRDC4 Arrestin domain containing 4 −1.52
FAM83D Family with sequence similarity 83, member D −1.52
LSR Lipolysis stimulated lipoprotein receptor −1.52
STK26 Serine/threonine protein kinase 26 −1.51
MIR181A2HG MIR181A2 host gene (non-protein coding) −1.51
VWA8 von Willebrand factor A domain containing 8 −1.51
Table 2Genes with greater than 1.5-fold or less than−1.5-fold expression and respective fold changes(Continued)
MEST Mesoderm-specific transcript homolog (mouse) −1.51
ZNF835 Zinc finger protein 835 1.51
NAT1 N-acetyltransferase 1 (arylamineN-acetyltransferase) 1.51
EPSTI1 Epithelial stromal interaction 1 (breast) 1.51
LOC221946 Hypothetical LOC221946 1.51
OAS1 2′,5′-oligoadenylate synthetase 1, 40/46 kDa 1.52
SELL Selectin L 1.52
COX6C Cytochrome c oxidase subunit VIc 1.52
TRIM41 Tripartite motif-containing 41 1.52
IFI27 Interferon-α-inducible protein 27 1.52
IGF1 Insulin-like growth factor 1 (somatomedin C) 1.52
SCAMP1-AS1 SCAMP1 antisense RNA 1 1.52
CD207 CD207 molecule, langerin 1.52
IFI35 Interferon-induced protein 35 1.52
GGH γ-Glutamyl hydrolase (conjugase, folylpolygammaglutamyl hydrolase)
1.52
NOX4 NADPH oxidase 4 1.53
CNTN3 Contactin 3 (plasmacytoma associated) 1.53
CCL5 Chemokine (C-C motif) ligand 5 1.54
GALNT1 UDP-N-acetyl-α-D-galactosamine:polypeptide
N-acetylgalactosaminyltransferase 1 (GalNAc-T1)
1.54
SPON1 Spondin 1, extracellular matrix protein 1.54
SEMA3C Sema domain, immunoglobulin domain (Ig),
short basic domain, secreted, (semaphorin) 3C
1.54
DDX60L DEAD (Asp-Glu-Ala-Asp) box polypeptide 60-like 1.55
TNFSF10 Tumor necrosis factor (ligand) superfamily, member 10
1.55
CXCL14 Chemokine (C-X-C motif) ligand 14 1.55
WISP2 WNT1 inducible signaling pathway protein 2 1.55
STAT1 Signal transducer and activator of transcription 1, 91 kDa
1.55
COMP Cartilage oligomeric matrix protein 1.56
IGLJ3 Immunoglobulin lambda joining 3 1.56
LRRC17 Leucine-rich repeat containing 17 1.56
IFI44 Interferon-induced protein 44 1.56
ISG15 ISG15 ubiquitin-like modifier 1.56
FBLN2 Fibulin 2 1.57
SLC6A6 Solute carrier family 6 (neurotransmitter transporter, taurine), member 6
1.57
MX2 Myxovirus (influenza virus) resistance 2 (mouse) 1.57
SH3D19 SH3 domain containing 19 1.57
TRBC1 T-cell receptorβconstant 1 1.58
SGCE Sarcoglycan, epsilon 1.58
IGHM Immunoglobulin heavy constant mu 1.58
DCBLD1 Discoidin, CUB and LCCL domain containing 1 1.59
PPAPDC1A Phosphatidic acid phosphatase type 2 domain containing 1A
1.59
old stromal tissues. Similar results were found when we applied GSEA to the DNA damage response gene set. The estimated gene score was 0.57, which did not reach statistical significance (p= 0.10) (Fig. 5b).
Senescence-associated secretory profile
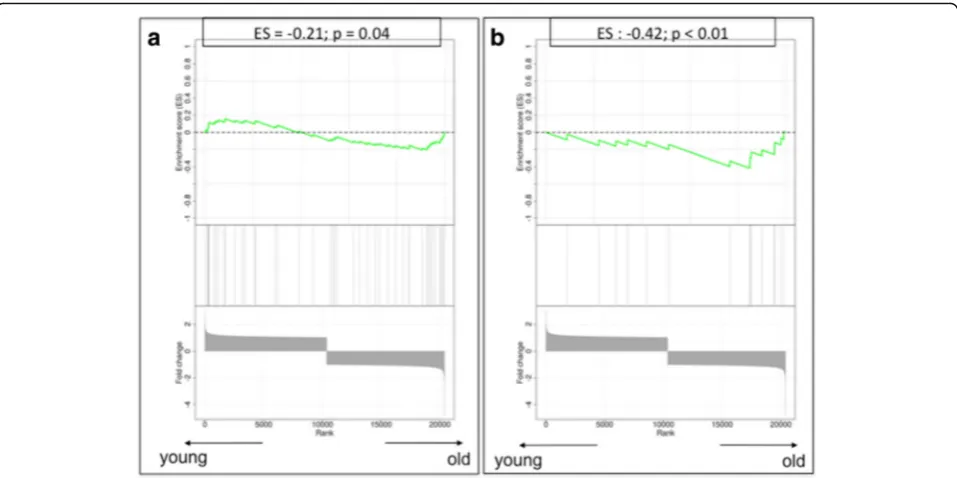
[image:8.595.55.541.88.738.2] [image:8.595.298.538.111.497.2]Several genes involved in the SASP showed a deregulated gene expression profile, suggesting an enrichment of SASP in the stroma of older patients, including CXCL2 (over-expressed in older stromal tissues; fold change 1.59), TNFRSF11B(over-expressed in older stromal tissues; fold change 2.11) andCCL8(down-regulated in older stromal tissues; fold change−1.61). Of interest, GSEA confirmed a significant enrichment in SASP-related genes within the stroma of older patient samples with an ES of−0.21 (p= 0.04) (Fig. 6a).
Table 2Genes with greater than 1.5-fold or less than−1.5-fold expression and respective fold changes(Continued)
MFAP2 Microfibrillar-associated protein 2 1.60
PDGFD Platelet-derived growth factor D 1.60
IGKC Immunoglobulin kappa constant 1.60
CST1 Cystatin SN 1.61
CCL8 Chemokine (C-C motif) ligand 8 1.61
RASGRF2 Ras protein-specific guanine nucleotide-releasing factor 2
1.61
MX1 Myxovirus (influenza virus) resistance 1, interferon-inducible protein p78 (mouse)
1.63
PDGFRL Platelet-derived growth factor receptor-like 1.63
ALDH1L2 Aldehyde dehydrogenase 1 family, member L2 1.63
FAM198B Family with sequence similarity 198, member B 1.63
MIR100HG Mir-100-let-7a-2 cluster host gene 1.64
GAPT GRB2-binding adaptor protein, transmembrane 1.65
SELM Selenoprotein M 1.65
DSCAM-AS1 DSCAM antisense RNA 1 1.66
STMN2 Stathmin-like 2 1.69
FBLN5 Fibulin 5 1.70
IFIT3 Interferon-induced protein with tetratricopeptide repeats 3
1.70
SFRP4 Secreted frizzled-related protein 4 1.71
ACKR4 Atypical chemokine receptor 4 1.71
CPNE2 Copine II 1.71
PSMB9 Proteasome (prosome, macropain) subunit,
βtype, 9 (large multifunctional peptidase 2)
1.72
ST6GAL2 ST6β-galactosamideα-2,6-sialyltranferase 2 1.72
NEXN Nexilin (F actin binding protein) 1.72
CD52 CD52 molecule 1.72
MFAP5 Microfibrillar associated protein 5 1.73
RARRES3 Retinoic acid receptor responder (tazarotene induced) 3
1.75
GXYLT2 Glucoside xylosyltransferase 2 1.75
HMCN1 Hemicentin 1 1.76
EFEMP1 EGF-containing fibulin-like extracellular matrix protein 1
1.78
IL21R Interleukin 21 receptor 1.78
C8orf4 Chromosome 8 open reading frame 4 1.78
LINC01503 Long intergenic non-protein coding RNA 1503 1.78
OLFML3 Olfactomedin-like 3 1.79
CILP Cartilage intermediate layer protein, nucleotide pyrophosphohydrolase
1.81
MVB12A Multivesicular body subunit 12A 1.82
SCUBE2 Signal peptide, CUB domain, EGF-like 2 1.83
WNT2 Wingless-type MMTV integration site family member 2
1.85
APOL3 Apolipoprotein L3 1.87
ADRA2A Alpha-2A adrenergic receptor 1.89
HIST1H3I Histone cluster 1, H3i 1.92
SLC46A3 Solute carrier family 46, member 3 1.92
Table 2Genes with greater than 1.5-fold or less than−1.5-fold expression and respective fold changes(Continued)
ARHGAP28 Rho GTPase activating protein 28 1.93
KANK4 KN motif and ankyrin repeat domains 4 1.93
SDC1 Syndecan 1 1.95
CMPK2 Cytidine monophosphate (UMP-CMP) kinase 2,
mitochondrial
1.96
IFI44L Interferon-induced protein 44-like 1.97
FMO1 Flavin containing monooxygenase 1 1.98
TMEM119 Transmembrane protein 119 1.99
FNDC1 Fibronectin type III domain containing 1 2.00
ADAMDEC1 ADAM-like, decysin 1 2.00
TPSAB1 Tryptaseα/β1 2.02
CPA3 Carboxypeptidase A3 (mast cell) 2.02
MMP3 Matrix metallopeptidase 3 (stromelysin 1, progelatinase)
2.05
IFI6 Interferon,α-inducible protein 6 2.06
IFIT1 Interferon-induced protein with tetratricopeptide repeats 1
2.06
SFRP2 Secreted frizzled-related protein 2 2.09
TRIM6 Tripartite motif-containing 6 2.10
TPSB2 Tryptaseβ2 (gene/pseudogene) 2.19
RSAD2 RadicalS-adenosyl methionine domain containing 2 2.28
LOXL1 Lysyl oxidase-like 1 2.30
OMD Osteomodulin 2.35
IGJ Immunoglobulin J polypeptide, linker protein for immunoglobulinαand mu polypeptides
2.44
FCGR1A Fc fragment of IgG, high affinity Ia, receptor (CD64) 2.47
MATN3 Matrilin 3 2.55
IGLV@ Immunoglobulin lambda variable cluster 2.65
OGN Osteoglycin 2.99
EPYC Epiphycan 3.04
The reverse Warburg effect: autophagy genes
None of the genes described to be involved in the AST showed a relevant difference in gene expression between young and old stroma at the individual gene level. However, when compiling them together in the GSEA, we found a highly significant enrichment of autophagy genes in the stroma of older patient samples (ES−0.42;p< 0.01) (Fig. 6b).
Discussion
The reason for the age-related increase in cancers has been debated for decades. Besides cumulative DNA
damage throughout life, the accumulation of senescent cells is assumed to create a tumour-promoting micro-environment through phenomena such as the SASP and the AST. So far, studies investigating the impact of stromal senescence on tumour development have been based on in vitro fibroblast cultures where senescence was artificially in-duced [23, 29]. As a consequence of this approach, an over-load of senescent or pre-senescent fibroblasts was present in these experiments. We do not know if this accurately re-flects the situation in spontaneous cancers. Accumulation of senescent cells with age has been studied mostly in fibro-blasts localised in the skin [14], but data on the frequency Fig. 3Heat maps constructed using the 25 top up-regulated and the 25 top down-regulated genes.Bluerepresents young patients, andgreen represents old patients
[image:9.595.58.538.85.351.2] [image:9.595.57.539.560.704.2]of senescent fibroblasts in the older breast are lacking. Moreover, controversy exists regarding whether findings on in vitro senescence can be extrapolated to the situation in vivo. We therefore aimed in this study to investigate the molecular footprint of the older breast cancer micro-environment in order to support in vivo con-firmation of key concepts such as ageing/senescence, DNA damage response, SASP and AST. Senescence in the surrounding stroma is expected to result in a pro-tumourigenic micro-environment with stimulation of prolif-eration, migration/invasion and de-differentiation. However,
this had never been shown in spontaneously occurring breast cancers. For this purpose, we selected two groups of patients with triple-negative breast cancer belonging to ex-treme age categories, isolated cancer-associated stromal fields via LCM and investigated their gene expression profiles.
[image:10.595.56.290.109.281.2]Differential gene expression analysis using a cut-off of a 1.5-fold change in expression revealed 120 up-regulated and 107 down-regulated genes in the stromal parts of older patients compared with the younger patients. Validation of these findings using publicly available stromal data revealed a set of ten differentially expressed genes between young and old stromal samples. The young stromal samples showed mainly up-regulation in genes such as RARRES3, SCUBE2, SFRP4, COMP and NANT1 that preclude migration and invasion by stabilising the cells in the extracellular matrix and stimulate differentiation [41, 51–60]. Significant up-regulation in the older stromal micro-environment was shown instead for genes that are in-volved in proliferation, de-differentiation and angiogenesis. Four genes, namelyANXA3,PROM1,FGF13andTUBB2B, seem to restrain differentiation and promote cell prolif-eration, invasiveness and metastasis [61–71]. The fifth up-regulated gene in the older stromal samples, WIF1, is a negative inhibitor of the Wnt (Wingless-type)/β-catenin signalling pathway. It is thought to inhibit proliferation and to induce differentiation and cellular senescence by up-regulation of tumour suppressor genes such asTP53or P21 [72, 73]. Although the proliferation-inhibiting and differentiation-inducing effects of this gene seem to be
Table 3Significant up- or down-regulated genes after validation in the external validation data set (seeFig. 4)
Gene Full name Fold
change
RARRES3 Retinoic acid receptor responder (tazarotene induced) 3
1.75
SFRP4 Secreted frizzled-related protein 4 1.71
SCUBE2 Signal peptide, CUB domain, EGF-like 2 1.83
NAT1 N-acetyltransferase 1 (arylamineN-acetyltransferase) 1.51
COMP Cartilage oligomeric matrix protein 1.56
ANXA3 Annexin A3 −2.06
PROM1 Prominin 1 −2.27
FGF13 Fibroblast growth factor 13 −1.68
TUBB2B Tubulin, beta 2B −1.64
WIF1 WNT inhibitory factor 1 −2.10
Negative values for fold change indicate up-regulation in old patient samples, and positive values indicate up-regulation in young patient samples
[image:10.595.57.539.457.702.2]in contradiction with the proliferation- and metastasis-promoting activity of the other four up-regulated genes in the older stromal samples, its senescence-inducing function may be an obvious explanation for the age-related stromal expression ofWIF1 in our study. Taken together, on the basis of our data, we found evidence of a more tumour-favourable micro-environment in the stromal samples from older patients than in those from younger patients.
As an additional analysis, we applied a candidate gene approach by assembling sets of genes on the basis of the literature. We specifically looked at the individual gene expression results for these genes, but we also compiled them using a gene set enrichment strategy that reflects the representation of these genes among the top up- or down-regulated genes in old and young stromal samples.
The molecular process of senescence is characterised by up-regulation of several senescence genes. The most documented ones are TP53, CDKN2A (P16), CDKN1A (P21) andRB[74–76]. These major senescence-inducing genes did not show significantly different expression values between young and old stroma in the individual gene analysis. Nevertheless, we observed in older patients an up-regulation ofPAI-1(SERPINE1), a matrix-remodelling en-zyme, which has also been described as a crucial regulator of ageing and senescence by acting downstream of TP53 and upstream of insulin-like growth factor binding protein 3 [77], and ofWIF1, described above as an inhibitor of the Wnt/β-catenin signalling pathway and an inducer of senes-cence, and it was also significantly increased in samples from old compared with young patients (Table 2).
These findings could be indicative of more widespread cellular senescence in our older stromal samples compared Fig. 6Gene set enrichment analysis plots.aThe senescence-associated secretory profile process.bThe autophagy-to-senescence transition or
[image:11.595.59.538.87.326.2]‘reverse Warburg effect’. Low values correspond to enrichment of the genes in older patients, and high values correspond to enrichment of the genes in younger patients.ESEnrichment score
Table 4Groups of candidate genes related to a specific pathophysiological process, built to perform gene set enrichment analysis, and their respective references
Gene group Involved genes References
Cellular senescence CDKN1A,CDKN2A,TP53,RB1,GLB1 [17–19,69–71]
DNA damage response ATM,NBN,CHEK2 [21,73]
Senescence-associated secretory profile IL1A,IL6,IL6R,IL6ST,IL8,CXCL1,CXCL2,CXCL3,CSF2,IL7,ICAM1,TNFRSF11B,HGF,IGFBP4,
CCL8,PLAUR,IGFBP2,CCL26,IL13,CCL20,ICAM3,PGF,TNFRSF1A,TNFRSF1B,CCL13,CCL16,
TNFRSF10C,CCL2,FAS,ANG,IGFBP6,IL1B,(CCL3),TIMP2,IL11,OSM,LEP,AXL,KITLG,FGF7,
IL15,FGF2,IGFBP1,MIF
[17,21,22,26]
Autophagy-to-senescence transition CAV1,CTSB,BNIP3,PRKAA1,PRKAA2,LAMP2,MAP1LC3B,ATG16L1,HIF1A,NFKB1,DRAM1,
TP73,MAPK8,E2F1,STK11
[image:11.595.57.543.625.733.2]with the young ones. Gene enrichment analysis based on five key senescence genes, including the ones mentioned above, showed a tendency towards a more prominent senescence trait in older stroma, but no significant ES was reached for this process in the older patient samples. Therefore, we cannot decisively conclude that samples from the older patient group show increased senescence.
The DNA damage response is a biological process that, upon severe DNA damage, triggers the switch to-wards a permanent growth arrest [78]. It was found that the molecular senescence programme can be induced only when this DNA damage response has been acti-vated for a sufficiently long time period [21]. We could not demonstrate any clear difference in the individual expression of three key players involved in the DNA damage response (ATM, NBN or CHEK2) [78], nor did we find significant enrichment for this set of genes in the older patient samples.
In our stromal gene expression study, only a few of the SASP components described by Coppé et al. as over-produced by senescent cell cultures [26] showed signifi-cant age-related differential expression: CXCL2 and osteoprotegerin (TNFRSF11B), a member of the tumour necrosis factor receptor superfamily, which both showed overexpression in the old patient samples, as well as CCL8, which showed down-regulation in the older versus the younger stromal samples. Of interest, when compiling all the components of the SASP together in the gene enrichment analysis, we indeed confirmed a significant enrichment in SASP genes among genes up-regulated in the older patient samples, confirming for the first time the presence of the SASP phenotype in human breast cancers in vivo.
Autophagy is assumed to precede or parallel the process of senescence [38], as described by the term autophagy-to-senescence transition(AST). Typical markers for AST are loss of caveolin 1 (CAV1) and up-regulation of BNIP3, BNIP3L, Beclin-1, Cathepsin B and ATG16L1. Our indi-vidual gene expression results did not show relevant up-regulation of single autophagy-related genes in the older stromal samples, but compilation of these genes into a GSEA showed highly significant enrichment for autoph-agy genes in the older stromal samples. Thus, in addition to the presence of SASP, we also confirmed the presence of AST in the older stromal cancer milieu.
In this study, regarding gene expression levels, we report, for the first time to our knowledge, the presence of SASP and AST in older stromal samples, supporting the previ-ously published in vitro and xenograft findings. This does not, however, solve the paradox between the stimulatory effect that these processes are supposed to have on proxim-ate malignant cells and the clinical finding that breast can-cer in older patients behaves in a rather more indolent instead of a more aggressive way [79]. Also, it remains
puzzling that we found evidence for SASP and AST in older stromal samples, which are senescence-related phenomena, whereas we did not find convincing evi-dence for increased senescence in these samples. The small sample size, together with the low number of genes defining the‘senescence’programme, could partly ex-plain the lack of significance for major senescence-related genes such asTP53,CDKN2AandpRB, both at the individ-ual level and in the GSEAs.
Besides the small sample size of the study, the broad age interval between the patient groups and the differ-ence in menopausal status between the groups introduce other potential biases, because not only the stroma but also infiltrating immune cells are believed to be altered by hormonal changes. Ideally, our findings would be further investigated in larger patient cohorts including other age categories, and validated by proteomic analysis of the stro-mal tissue. LCM is a demanding technique, however, limit-ing the number of patient samples that can be processed. We attempted to compensate for some of these limitations by including a validation strategy on publicly available gene expression data.
Conclusions
We report, for the first time to our knowledge, the involve-ment of key pathophysiological concepts of cancer and ageing, such as the SASP and the AST, in vivo in human cancer patients. These remarkable findings justify further research to fully elucidate the role of the ageing stroma in (breast) tumour development and progression. In the first place, this research should be extended in other subtypes of breast cancer and more age categories.
Additional file
Additional file 1: Table S1:RNA concentration and RNA Quality Indicator value before, and RNA concentration after, amplification. (DOCX 14 kb)
Abbreviations
AST:Autophagy-to-senescence transition; CAV1: Caveolin 1; ER: Oestrogen receptor; ES: Enrichment score; fRMA: Frozen robust multi-array analysis; GEO: Gene Expression Omnibus; GSEA: Gene set enrichment analysis; H&E: Haematoxylin and eosin; HER2: Human epidermal growth factor receptor 2; LCM: Laser capture microdissection; MMP3: Matrix metalloproteinase 3; NCBI: National Center for Biotechnology Information; PR: Progesterone receptor; RB: Retinoblastoma; SASP: Senescence-associated secretory profile; SPIA: Single-primer isothermal amplification
Acknowledgements
Not applicable.
Funding
HW is a recipient of the‘Fonds voor Wetenschappelijk Onderzoek– Vlaanderen (FWO).’The study was supported by a grant from the Belgian
Availability of data and materials
The data sets generated during the present study are available from the NCBI GEO database under accession number [GEO:GSE90521]. Validation data sets that were used are available from the NCBI GEO database under the accession numbers [GEO:GSE5847; GEO:GSE4823; GEO:GSE14548].
Authors’contributions
BB and DF contributed to the design of the study, performed the LCM and gene expression analysis procedures, and were the major authors of the manuscript. BB, DF, SH, CS and HW contributed to the design of the study, the interpretation of the study results and the writing of the manuscript. AS, PS, PN and DL contributed to the collection of the patient samples and to the writing of the manuscript. OG, KvdE and GF provided their technical expertise in LCM. GF contributed to the pathological interpretation of the patient samples and contributed to manuscript writing. SB and YB contributed to the statistical analysis and validation procedures as well as to manuscript writing. All authors read and approved the final manuscript.
Ethics approval and consent to participate
This study was approved by the ethics committee of the University Hospitals Leuven (Leuven, Belgium) in accordance with the International Conference on Harmonisation Harmonised Tripartite Guideline for Good Clinical Practice. Only patient tissue samples from our research biobank were used. All patients whose biological material is included in this biobank signed an informed consent form at the time of surgery, allowing the use of their tissue and medical data for scientific research.
Consent for publication
All patients signed an informed consent form at the time of surgery, allowing use of their tissue and medical data for scientific research, including scientific publication.
Competing interests
The authors declare that they have no competing interests.
Publisher’s Note
Springer Nature remains neutral with regard to jurisdictional claims in published maps and institutional affiliations.
Author details 1
Laboratory of Experimental Oncology (LEO), Department of Oncology, KU Leuven, Leuven, Belgium.2Department of General Medical Oncology, Leuven Cancer Institute, University Hospitals Leuven, Leuven, Belgium.3Breast Cancer Translational Research Laboratory, Institut Jules Bordet, Universite Libre de Bruxelles, Brussels, Belgium.4Department of Imaging and Pathology, Laboratory of Translational Cell & Tissue Research, KU Leuven, Herestraat 49, B-3000 Leuven, Belgium.5Department of Pathology, University Hospitals Leuven, Herestraat 49, B-3000 Leuven, Belgium.6Multidisciplinary Breast Center, University Hospitals Leuven, Leuven, Belgium.7Department of Oncology, Laboratory for Translational Genetics, Vesalius Research Center (VRC), Vlaams Instituut voor Biotechnologie (VIB) and KU Leuven, Leuven, Belgium.
Received: 20 December 2016 Accepted: 20 June 2017
References
1. Bergamaschi A, Tagliabue E, Sørlie T, Naume B, Triulzi T, Orlandi R, et al. Extracellular matrix signature identifies breast cancer subgroups with different clinical outcome. J Pathol. 2008;214:357–67.
2. Finak G, Bertos N, Pepin F, Sadekova S, Souleimanova M, Zhao H, et al. Stromal gene expression predicts clinical outcome in breast cancer. Nat Med. 2008;14:518–27.
3. Beck AH, Sangoi AR, Leung S, Marinelli RJ, Nielsen TO, van de Vijver MJ, et al. Systematic analysis of breast cancer morphology uncovers stromal features associated with survival. Sci Transl Med. 2011;3:108ra113.
4. Bianchini G, Qi Y, Alvarez RH, Iwamoto T, Coutant C, Ibrahim NK, et al. Molecular anatomy of breast cancer stroma and its prognostic value in estrogen receptor-positive and -negative cancers. J Clin Oncol. 2010;28: 4316–23. Published errata appear in J Clin Oncol. 2010;28:4868; and J Clin Oncol. 2012;30:679
5. Calon A, Lonardo E, Berenguer-Llergo A, Espinet E, Hernando-Momblona X, Iglesias M, et al. Stromal gene expression defines poor-prognosis subtypes in colorectal cancer. Nat Genet. 2015;47:320–9.
6. Casey T, Bond J, Tighe S, Hunter T, Lintault L, Patel O, et al. Molecular signatures suggest a major role for stromal cells in development of invasive breast cancer. Breast Cancer Res Treat. 2009;114:47–62.
7. Finak G, Sadekova S, Pepin F, Hallett M, Meterissian S, Halwani F, et al. Gene expression signatures of morphologically normal breast tissue identify basal-like tumors. Breast Cancer Res. 2006;8:R58.
8. Ma XJ, Dahiya S, Richardson E, Erlander M, Sgroi DC. Gene expression profiling of the tumor microenvironment during breast cancer progression. Breast Cancer Res. 2009;11:R7.
9. Boersma BJ, Reimers M, Yi M, Ludwig JA, Luke BT, Stephens RM, et al. A stromal gene signature associated with inflammatory breast cancer. Int J Cancer. 2008; 122:1324–32.
10. Vargas AC, McCart Reed AE, Waddell N, Lane A, Reid LE, Smart CE, et al. Gene expression profiling of tumour epithelial and stromal compartments during breast cancer progression. Breast Cancer Res Treat. 2012;135:153–65. 11. Kalluri R, Zeisberg M. Fibroblasts in cancer. Nat Rev Cancer. 2006;6:392–401. 12. Joyce JA, Pollard JW. Microenvironmental regulation of metastasis. Nat Rev
Cancer. 2009;9:239–52.
13. Haviv I, Polyak K, Qiu W, Hu M, Campbell I. Origin of carcinoma associated fibroblasts. Cell Cycle. 2009;8:589–95.
14. Jeyapalan JC, Ferreira M, Sedivy JM, Herbig U. Accumulation of senescent cells in mitotic tissue of aging primates. Mech Ageing Dev. 2007;128:36–44. 15. Wildiers H, Heeren P, Puts M, Topinkova E, Janssen-Heijnen ML, Extermann
M, et al. International Society of Geriatric Oncology consensus on geriatric assessment in older patients with cancer. J Clin Oncol. 2014;32:2595–603. 16. Decoster L, Van Puyvelde K, Mohile S, Wedding U, Basso U, Colloca G, et al.
Screening tools for multidimensional health problems warranting a geriatric assessment in older cancer patients: an update on SIOG recommendations. Ann Oncol. 2015;26:288–300.
17. Campisi J. d’Adda di Fagagna F. Cellular senescence: when bad things happen to good cells. Nat Rev Mol Cell Biol. 2007;8:729–40.
18. Ben-Porath I, Weinberg RA. When cells get stressed: an integrative view of cellular senescence. J Clin Invest. 2004;113:8–13.
19. Ben-Porath I, Weinberg RA. The signals and pathways activating cellular senescence. Int J Biochem Cell Biol. 2005;37:961–76.
20. Krtolica A, Campisi J. Cancer and aging: a model for the cancer promoting effects of the aging stroma. Int J Biochem Cell Biol. 2002;34:1401–14. 21. Rodier F, Coppé JP, Patil CK, Hoeijmakers WA, Muñoz DP, Raza SR, et al.
Persistent DNA damage signalling triggers senescence-associated inflammatory cytokine secretion. Nat Cell Biol. 2009;11:973–9. A published erratum appears in Nat Cell Biol. 2009;11:1272.
22. Orjalo AV, Bhaumik D, Gengler BK, Scott GK, Campisi J. Cell surface-bound IL-1αis an upstream regulator of the senescence-associated IL-6/IL-8 cytokine network. Proc Natl Acad Sci U S A. 2009;106:17031–6.
23. Parrinello S, Coppe JP, Krtolica A, Campisi J. Stromal-epithelial interactions in aging and cancer: senescent fibroblasts alter epithelial cell
differentiation. J Cell Sci. 2005;118:485–96.
24. Krtolica A, Parrinello S, Lockett S, Desprez PY, Campisi J. Senescent fibroblasts promote epithelial cell growth and tumorigenesis: a link between cancer and aging. Proc Natl Acad Sci U S A. 2001;98:12072–7.
25. Coppé JP, Desprez PY, Krtolica A, Campisi J. The senescence-associated secretory phenotype: the dark side of tumor suppression. Annu Rev Pathol. 2010;5:99–118.
26. Coppé JP, Patil CK, Rodier F, Sun Y, Muñoz DP, Goldstein J, et al. Senescence-associated secretory phenotypes reveal cell-nonautonomous functions of oncogenic RAS and the p53 tumor suppressor. PLoS Biol. 2008;6:2853–68. 27. Williams PD, Day T. Antagonistic pleiotropy, mortality source interactions,
and the evolutionary theory of senescence. Evolution. 2003;57:1478–88. 28. Rose M, Charlesworth B. A test of evolutionary theories of senescence.
Nature. 1980;287:141–2.
29. Liu D, Hornsby PJ. Senescent human fibroblasts increase the early growth of xenograft tumors via matrix metalloproteinase secretion. Cancer Res. 2007; 67:3117–26.
30. Begley LA, Kasina S, MacDonald J, Macoska JA. The inflammatory microenvironment of the aging prostate facilitates cellular proliferation and hypertrophy. Cytokine. 2008;43:194–9.
varying ages and their influence on tumour formation by prostate epithelial cells. Asian J Androl. 2011;13:732–41.
32. Bianchi-Frias D, Vakar-Lopez F, Coleman IM, Plymate SR, Reed MJ, Nelson PS. The effects of aging on the molecular and cellular composition of the prostate microenvironment. PLoS One. 2010;5:e12501.
33. Herbig U, Ferreira M, Condel L, Carey D, Sedivy JM. Cellular senescence in aging primates. Science. 2006;311:1257.
34. Dimri GP, Lee X, Basile G, Acosta M, Scott G, Roskelley C, et al. A biomarker that identifies senescent human cells in culture and in aging skin in vivo. Proc Natl Acad Sci U S A. 1995;92:9363–7.
35. Satyanarayana A, Wiemann SU, Buer J, Lauber J, Dittmar KE, Wüstefeld T, et al. Telomere shortening impairs organ regeneration by inhibiting cell cycle re-entry of a subpopulation of cells. EMBO J. 2003;22:4003–13.
36. Molofsky AV, Slutsky SG, Joseph NM, He S, Pardal R, Krishnamurthy J, et al. Increasingp16INK4aexpression decreases forebrain progenitors and neurogenesis during ageing. Nature. 2006;443:448–52.
37. Ressler S, Bartkova J, Niederegger H, Bartek J, Scharffetter-Kochanek K, Jansen-Dürr P, et al.p16INK4Ais a robust in vivo biomarker of cellular aging in human skin. Aging Cell. 2006;5:379–89.
38. Capparelli C, Guido C, Whitaker-Menezes D, Bonuccelli G, Balliet R, Pestell TG, et al. Autophagy and senescence in cancer-associated fibroblasts metabolically supports tumor growth and metastasis via glycolysis and ketone production. Cell Cycle. 2012;11:2285–302.
39. Salem AF, Whitaker-Menezes D, Lin Z, Martinez-Outschoorn UE, Tanowitz HB, Al-Zoubi MS, et al. Two-compartment tumor metabolism: autophagy in the tumor microenvironment and oxidative mitochondrial metabolism (OXPHOS) in cancer cells. Cell Cycle. 2012;11:2545–56.
40. Martinez-Outschoorn UE, Pavlides S, Howell A, Pestell RG, Tanowitz HB, Sotgia F, et al. Stromal-epithelial metabolic coupling in cancer: integrating autophagy and metabolism in the tumor microenvironment. Int J Biochem Cell Biol. 2011;43:1045–51.
41. Chiavarina B, Whitaker-Menezes D, Migneco G, Martinez-Outschoorn UE, Pavlides S, Howell A, et al. HIF1-αfunctions as a tumor promoter in cancer associated fibroblasts, and as a tumor suppressor in breast cancer cells: Autophagy drives compartment-specific oncogenesis. Cell Cycle. 2010;9:3534–51.
42. Martinez-Outschoorn UE, Whitaker-Menezes D, Pavlides S, Chiavarina B, Bonuccelli G, Casey T, et al. The autophagic tumor stroma model of cancer or“battery-operated tumor growth”: a simple solution to the autophagy paradox. Cell Cycle. 2010;9:4297–306.
43. Benz CC. Impact of aging on the biology of breast cancer. Crit Rev Oncol Hematol. 2008;66:65–74.
44. Wildiers H, Kunkler I, Biganzoli L, Fracheboud J, Vlastos G, Bernard-Marty C, et al. Management of breast cancer in elderly individuals: recommendations of the International Society of Geriatric Oncology. Lancet Oncol. 2007;8:1101–15. 45. Fend F, Raffeld M. Laser capture microdissection in pathology. J Clin Pathol.
2000;53:666–72.
46. Morse AM, Carballo V, Baldwin DA, Taylor CG, McIntyre LM. Comparison between NuGEN’s WT-Ovation Pico and one-direct amplification systems. J Biomol Tech. 2010;21:141–7.
47. Singh R, Maganti RJ, Jabba SV, Wang M, Deng G, Heath JD, et al. Microarray-based comparison of three amplification methods for nanogram amounts of total RNA. Am J Physiol Cell Physiol. 2005;288:C1179–89.
48. Vermeulen J, Derveaux S, Lefever S, De Smet E, De Preter K, Yigit N, et al. RNA pre-amplification enables large-scale RT-qPCR gene-expression studies on limiting sample amounts. BMC Res Notes. 2009;2:235.
49. McCall MN, Bolstad BM, Irizarry RA. Frozen robust multiarray analysis (fRMA). Biostatistics. 2010;11:242–53.
50. Subramanian A, Tamayo P, Mootha VK, Mukherjee S, Ebert BL, Gillette MA, et al. Gene set enrichment analysis: a knowledge-based approach for interpreting genome-wide expression profiles. Proc Natl Acad Sci U S A. 2005;102:15545–50. 51. Scharadin TM, Eckert RL. TIG3: an important regulator of keratinocyte
proliferation and survival. J Invest Dermatol. 2014;134:1811–6. 52. Morales M, Arenas EJ, Urosevic J, Guiu M, Fernández E, Planet E, et al.
RARRES3suppresses breast cancer lung metastasis by regulating adhesion and differentiation. EMBO Mol Med. 2014;6:865–81.
53. Lin YC, Lee YC, Li LH, Cheng CJ, Yang RB. Tumor suppressorSCUBE2inhibits breast-cancer cell migration and invasion through the reversal of epithelial-mesenchymal transition. J Cell Sci. 2014;127:85–100.
54. Lin YC, Chen CC, Cheng CJ, et al. Domain and functional analysis of a novel breast tumor suppressor protein,SCUBE2. J Biol Chem. 2011;286: 27039–47.
55. Johansson I, Nilsson C, Berglund P, Lauss M, Ringnér M, Olsson H, et al. Gene expression profiling of primary male breast cancers reveals two unique subgroups and identifiesN-acetyltransferase-1 (NAT1) as a novel prognostic biomarker. Breast Cancer Res. 2012;14:R31.
56. Hsu TH, Chu CC, Jiang SY, Hung MW, Ni WC, Lin HE, et al. Expression of the class II tumor suppressor geneRIG1is directly regulated by p53 tumor suppressor in cancer cell lines. FEBS Lett. 2012;586:1287–93.
57. Guo P, Shi ZL, Liu A, Lin T, Bi FG, Shi MM, et al. Cartilage oligomeric matrix protein gene multilayers inhibit osteogenic differentiation and promote chondrogenic differentiation of mesenchymal stem cells. Int J Mol Sci. 2014;15:20117–33. 58. Guo P, Shi ZL, Liu A, Lin T, Bi F, Shi M, et al. Effects of cartilage oligomeric
matrix protein on bone morphogenetic protein-2-induced differentiation of mesenchymal stem cells. Orthop Surg. 2014;6:280–7.
59. Ford CE, Jary E, Ma SS, Nixdorf S, Heinzelmann-Schwarz VA, Ward RL. The Wnt gatekeeper SFRP4 modulates EMT, cell migration and downstream Wnt signalling in serous ovarian cancer cells. PLoS One. 2013;8:e54362. 60. Endo Y, Yamashita H, Takahashi S, Sato S, Yoshimoto N, Asano T, et al.
Immunohistochemical determination of the miR-1290 target arylamineN -acetyltransferase 1 (NAT1) as a prognostic biomarker in breast cancer. BMC Cancer. 2014;14:990.
61. Zhang L, Li H, Ge C, Li M, Zhao FY, Hou HL, et al. Inhibitory effects of transcription factor Ikaros on the expression of liver cancer stem cell marker CD133 in hepatocellular carcinoma. Oncotarget. 2014;5:10621–35. 62. Zhai JM, Sun SJ, Wang W, Zeng C. Expression of annexin A3 in gastric
cancer and its correlation with proliferation and apoptosis. Asian Pac J Cancer Prev. 2014;15:3001–4.
63. Zeng C, Ke Z, Song Y, Yao Y, Hu X, Zhang M, et al. Annexin A3 is associated with a poor prognosis in breast cancer and participates in the modulation of apoptosis in vitro by affecting the Bcl-2/Bax balance. Exp Mol Pathol. 2013;95:23–31. 64. Yu SY, Li Y, Fan LQ, Zhao Q, Tan BB, Liu Y. Impact of Annexin A3 expression
in gastric cancer cells. Neoplasma. 2014;61:257–64.
65. Xia P, Song CL, Liu JF, et al. Prognostic value of circulating CD133+cells in patients with gastric cancer. Cell Prolif. 2015;48:311–7.
66. Okada-Ban M, Thiery JP, Jouanneau J. Fibroblast growth factor-2. Int J Biochem Cell Biol. 2000;32:263–7.
67. Jiang S, Pei L, Yang ZL, Liu G. Prognostic value of the stem cell markers EpCAM and CD133 expression of gallbladder adenocarcinoma. Hepatogastroenterology. 2014;61:574–9.
68. Facchiano A, Russo K, Facchiano AM, De Marchis F, Facchiano F, Ribatti D, et al. Identification of a novel domain of fibroblast growth factor 2 controlling its angiogenic properties. J Biol Chem. 2003;278:8751–60. 69. Cucchiarelli V, Hiser L, Smith H, Frankfurter A, Spano A, Correia JJ, et al.β
-Tubulin isotype classes II and V expression patterns in nonsmall cell lung carcinomas. Cell Motil Cytoskeleton. 2008;65:675–85.
70. Bernard-Marty C, Treilleux I, Dumontet C, Cardoso F, Fellous A, Gancberg D, et al. Microtubule-associated parameters as predictive markers of docetaxel activity in advanced breast cancer patients: results of a pilot study. Clin Breast Cancer. 2002;3:341–5.
71. Sabet MN, Rakhshan A, Erfani E, Madjd Z. Co-expression of putative cancer stem cell markers, CD133 and Nestin, in skin tumors. Asian Pac J Cancer Prev. 2014;15:8161–9.
72. Ramachandran I, Ganapathy V, Gillies E, Fonseca I, Sureban SM, Houchen CW, et al. Wnt inhibitory factor 1 suppresses cancer stemness and induces cellular senescence. Cell Death Dis. 2014;5:e1246.
73. Schlüter H, Stark HJ, Sinha D, Boukamp P, Kaur P. WIF1 is expressed by stem cells of the human interfollicular epidermis and acts to suppress
keratinocyte proliferation. J Invest Dermatol. 2013;133:1669–73. 74. Meek DW. Regulation of the p53 response and its relationship to cancer.
Biochem J. 2015;469:325–46.
75. Sharpless NE, Sherr CJ. Forging a signature of in vivo senescence. Nat Rev Cancer. 2015;15:397–408.
76. Pallis AG, Hatse S, Brouwers B, Pawelec G, Falandry C, Wedding U, et al. Evaluating the physiological reserves of older patients with cancer: the value of potential biomarkers of aging? J Geriatr Oncol. 2014;5:204–18. 77. Eren M, Boe AE, Klyachko EA, Vaughan DE. Role of plasminogen activator
inhibitor-1 in senescence and aging. Semin Thromb Hemost. 2014;40:645–51. 78. Fumagalli M. d’Adda di Fagagna F. SASPense and DDRama in cancer and
ageing. Nat Cell Biol. 2009;11:921–3.