Model predicts AIS data reception in the majority of Scottish coastal waters.
Abstract
Mark James1$, Tania Mendo1$*, Esther L. Jones23, Kyla Orr4, Ali McKnight5, John Thompson1
1. Scottish Oceans Institute, University of St. Andrews. East Sands, Fife UK, KY16 LB
2. School of Applied Sciences, University of South Wales, Cemetery Road, Glyntaff, Pontypridd, CF37 4BD
3. Centre for Research into Environmental and Ecological Modelling, School of Mathematics and Statistics, University of St Andrews, The Observatory, Buchanan Gardens, St Andrews, Fife, UK, KY16 9LZ
4. Marine Ecological Consulting, Corkil, Plockton, UK, IV52 8TU
5. Agroecosystems Ltd, Keeper’s House, Gaick, Kingussie Inverness-shire UK PH21 1NZ
*Corresponding author
$These authors contributed equally to this work
1 1 AIS data to inform small scale fisheries management and marine spatial planning
2
3 Abstract 4
5 Automatic Identification Systems (AIS) are collision avoidance devices used on-board both 6 commercial and leisure craft. These systems report the position, track and speed of the vessel 7 through Very High Frequency radio transmissions which are accessible to any suitable receiver. 8 This paper explores the potential to use AIS data to inform small scale fisheries management 9 and marine spatial planning. First, the propagation and reception of the line of sight AIS 10 transmissions was modelled around the coast of Scotland to identify areas where the use of AIS 11 may be compromised. Using open source Geographic Information System and relational 12 database software, computationally efficient methods of processing and analysing AIS data 13 were explored. Three months of AIS data derived from 274 Scottish small scale fishing vessels 14 were used to provide spatio-temporal analyses of trip duration and distance travelled, location 15 of fishing activities, and vessel dependency on fishing grounds. The coverage, opportunities 16 and challenges of using AIS are discussed together with broader applications and future 17 developments.
18
19 Keywords: monitoring, inshore fisheries, trips, PostgreSQL, trajectories 20
21 1. Introduction 22
23 Marine spatial planning is a process that improves decision making through the allocation of 24 uses to the marine environment to achieve ecological, economic, and social objectives. Fishing 25 activities are reliant on the marine environment, have considerable socio-economic importance 26 and contribute to food security [1, 2]. Increasing competition for space use in the marine 27 environment [3] drives the need to map fishing activities to inform marine planning and meet 28 policy commitments. In Europe, these commitments include the development of Marine 29 Protected Areas (MPAs) and MPA networks [4], which can displace fishing activities [5], the 30 installation of marine renewable energy devices which can exclude certain types of fishing gear 31 [6], expansion of aquaculture, and marine related leisure activities. Assessing the spatio-32 temporal distribution of fishing activities can inform managers of fisheries interactions with 33 the environment [7] and this information is needed to achieve Good Environmental Status 34 (GES) under the Marine Strategy Framework Directive [4].
35
36 Fishers have been traditionally reluctant to share information on where they fish, but a 37 combination of regulation, and market demands will require fishers to demonstrate that they 38 are fishing stocks within safe biological limits and in areas where they are permitted to do so 39 (e.g. an increasing number of retailers are adapting their buying policies to exclude non-40 sustainable products [8]). Conflicts between competing users of marine space are increasing 41 [3]. Balancing the trade-offs between these activities requires an objective evidence base of 42 spatio-temporal use, environmental, social and economic impact. Both resource users and those 43 that regulate their activities will require these data as historic and contemporary records to 44 support continued use and assess competing claims.
45
46 Small scale inshore fishing vessels (12 m and under) (SSF) represent over 80% of the total fleet 47 in almost all European Union Member States [9]. In many cases, SSF data that are currently 48 available are insufficient to determine fishing effort and the status of targeted stocks. SSF are 49 important in terms of their contribution to local economies, food security, trade and their 50 contribution to resilience of small scale business and social cohesion in Europe’s coastal 51 communities [9]. Therefore, analysis of spatio-temporal activities of SSF needs to be 52 incorporated into marine spatial planning considerations (as is the case with Scotmap in 53 Scotland [10] and in the Shetland Islands with their Marine Spatial Plan [11]), the EU’s Data 54 Collection Framework (DCF) and strategic policy development.
55
3 69 range limitations, AIS transmissions can be received by other ships equipped with AIS or any 70 suitable ground based or Low Earth Orbit (LEO) satellite receiver, making AIS data more 71 accessible and less expensive to transmit than VMS data which is usually based on point to 72 point satellite communication between the vessel and the ground centres [18]. In addition, AIS 73 data is of higher spatial resolution than conventional VMS fitted to vessels over 12m and of 74 comparable resolution to inshore VMS [20]. Inshore Vessel Monitoring System (iVMS) are 75 now being deployed in some ≤12m inshore fishing vessels [e.g. 21]. These units provide a 76 much more robust overall package with respect to security of units and data, accessibility to 77 managers, and availability of integrating plug-ons for catch reporting than can be gained from 78 AIS alone. However, unlike AIS, iVMS track data is not publicly available.
79
80 As AIS was originally conceived as a vessel safety system for collision avoidance rather than 81 data acquisition, data collection and processing differs from VMS and requires additional 82 considerations. Recent studies have highlighted the potential use of AIS as a tool for marine 83 spatial planners and outlined methodologies for processing AIS data [17, 18, 22, 23]. As SSF 84 generally operate closer to shore, the feasibility of utilising such systems for data collection 85 needs to be evaluated because the coverage of AIS receivers is not homogeneous and complex 86 coastal topography may impair line of sight detection of AIS targets. The challenges of storing, 87 applying quality control filters, querying and mapping large volumes of positional data that are 88 likely to be produced by the large number of SSF vessels in Europe have thus far not been 89 adequately addressed. There is a need to develop procedures to manage and integrate vessel 90 movement data sets and link these data with relevant effort metrics to inform fisheries 91 management.
92
103 vessels (~18% of the ≤12 m fleet) were voluntarily equipped with Class B AIS in June/July 104 2015. AIS Class B transceivers are lower cost alternatives to Class A and their transmission or 105 ping rate is usually every 30 seconds whilst the vessel is in transit, but this can be reduced to 3 106 minutes when anchored or moored and 6 minutes when static [19]. Three distinct areas were 107 then selected as case studies to evaluate the potential applications of AIS data in the context of 108 SSF.
109
110 2. Methods
111
112 2.1 Assessment of coverage 113
114 The VHF transmissions utilised by AIS operate on line of sight and therefore any obstruction 115 between the transmitter and receiver may result in transmission being impaired or blocked. The 116 purpose of this study was to assess the utility of using terrestrial AIS receivers which are either 117 land based Base Stations or attached to fixed assets at sea (Aids to Navigation – AtoNs). The 118 range of VHF transmission is determined by a combination of factors: distance between the 119 transmitter and receiver (provided there is clear line of sight), transmitter/transmission power, 120 aerial height and quality, receiver sensitivity, and atmospheric conditions. Assessment of AIS 121 coverage around Scotland was estimated following methods described in [25]. In summary, 122 using the CloudRF online radio frequency planning software (https://cloudrf.com), the Base 123 Station and AtoNs data [26], together with the AIS system specifications data were uploaded 124 to the CloudRF online system and a Longley Rice Irregular Terrain Model (ITM) [27] was 125 used to predict their respective range of reception. The model used high resolution 30m Shuttle 126 Radar Topography Mission (SRTM) data that include ground elevation and although this does 127 not take into account buildings or other artificial structures this is not generally a concern for 128 the coastal areas of Scotland, where population densities and built structures are sparse. 129
130 2.2 AIS data 131
5 137 vessels fitted with AIS units were distributed around the Scottish coast as follows: 47% 138 operated from the East coast (30 home ports), 22% from the West coast (30 home ports), 16% 139 from the Outer Hebrides (19 home ports), 14% from Shetland (10 home ports) and 2% from 140 the North Coast (4 home ports) [28]. The majority of vessels fitted with AIS units operated 141 static gear (84%), followed by mobile gear (14%) and a few operated both mobile and static 142 gear (2%). The static gear vessels predominantly fished using creels to target European lobster
143 (Homarus gammarus), brown crab (Cancer pagurus), velvet crab (Necora puber) and Norway
144 lobster (Nephrops norvegicus) (175 vessels). However, an additional 56 'static gear vessels' 145 also fished using lines and/or nets, either exclusively or in combination with creels. Of the 146 mobile gear vessels, 31 were bottom trawlers that exclusively targeted Norway lobsters, 4 were 147 scallop dredgers, 4 utilised a combination of dredges and bottom trawls, and 4 Norway lobster 148 trawlers also deployed static gear [28]. Fishers gave consent for their data to be used in 149 anonymised form for the purposes of this research. Received AIS transmissions from the SSF 150 vessels fitted with this system together with all other vessels designated under their Maritime 151 Mobile Service Identity (MMSI) number as being fishing vessels was harvested by UltraMap 152 Ltd (http://www.ultra-map.org/) between August 2015 and October 2015. The resulting dataset 153 comprised more than 37 million rows of information, including unique id; time stamp; 154 longitude; latitude; MMSI; vessel name; speed over ground; course over ground; true heading; 155 navigational status; draught, and destination. For the purposes of this study, however, only data 156 from the SSF vessels fitted with this system were analysed.
157
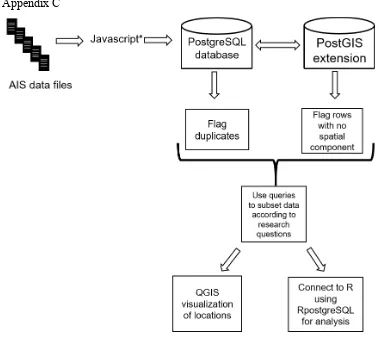
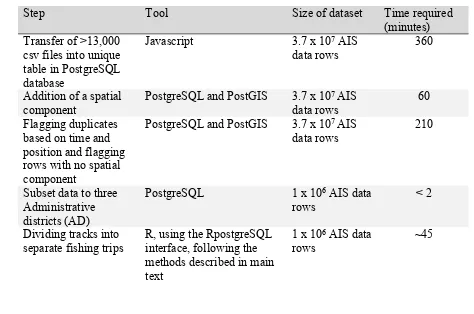
158 A Javascript was used to automatically transfer data from csv files (~4,320 per month) to a 159 unique table. A spatial component was then added and duplicates were flagged based on time 160 and position using PostgreSQL with PostGIS on a desktop computer (Intel® Core™ i7-5820K 161 @3.30GHz with 32Gb RAM x64-bit Windows 10 Pro OS). Further analysis was conducted in 162 R [29] using the library RPostgreSQL [30], an interface to the PostgreSQL database system 163 (see flow diagram in Appendix C, Fig. C1). A table related by vessel MMSI was also created 164 containing ancillary vessel information including: type of fishing method used; main target 165 species; name of skipper; name of vessel; coastal region; administrative district; home port; 166 and the date of install of the AIS system.
167
171 Districts were selected to represent geographically distinct regions with varied topography, 172 high landings of brown crab and European lobster and high fisher participation rates: 173 Anstruther (Fife) (56°13'14.5"N 2°41'54.5"W), east Scotland recorded the highest landings of 174 European lobster in 2014 [31]; Stornoway (58°12'33.8"N 6°23'30.5"W) encompassing several 175 islands of the Outer Hebrides, and Lerwick (60°09'13.5"N 1°08'31.0"W) representing the 176 archipelago comprising the Shetland Islands both recorded high landings of brown crabs [31]. 177 A subset of 82 vessels (Fife=21; Outer Hebrides=41; Shetland=20) generated 1.2 million AIS 178 records from August 2015 – October 2015. As participation in this study was voluntary, the 179 number of vessels taking part was not representative of the total number of vessels in each AD. 180 The main species targeted by these vessels were European lobster, brown crab, velvet crab, and 181 Norway lobster.
182
183 2.3 Potential applications for fisheries management and marine spatial planning 184
185 2.3.1 Trip duration and distance travelled
186
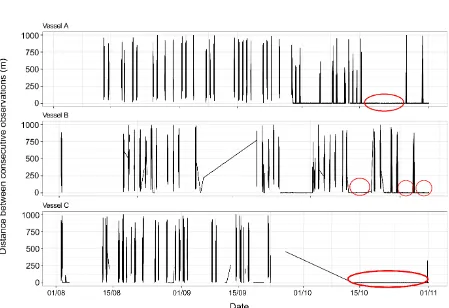
187 Data were pre-processed and a series of criteria were applied to vessel tracks to delimit each 188 fishing trip. The temporally ordered sequence of spatio-temporal AIS position records was 189 analysed using the adeHabitatLT package [32]. To ensure “continuity” in the use of AIS 190 units, only vessels for which total tracking duration (time elapsed between the first and last 191 AIS location transmitted during the study period) was greater than 30 days were retained. 192 Duplicate locations can arise in the data through multiple receivers (with different time 193 delays) logging the same location [23]. Therefore, when successive locations with distances 194 of 0 metres between them and a time difference of less than 5 seconds for the same vessel 195 (recognised by MMSI number) were identified, only the first chronological location was 196 retained. A histogram displaying the distribution of distances travelled (metres) between 197 successive locations in each trip revealed that some vessels presented an unusually high 198 proportion of very small distances moved between records. Closer examination of these 199 vessels (e.g. Appendix A, Fig. A1) revealed that the AIS units on board had been transmitting 200 uninterrupted for several weeks at a time and that the distances moved during those periods 201 of no activity (visualisation of these data in QGIS showed that the vessels were located 202 within fishing ports) were predominantly less than 5 metres. Therefore this value (movement 203 less than 5 m between consecutive records) was used as a cut-off point and observations 204 below this threshold were deleted.
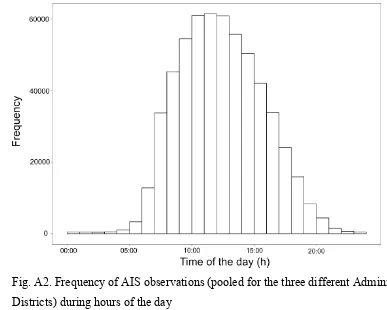
7 205
206 Vessels were almost exclusively fishing during daylight hours (only 0.5% of all the AIS 207 records were transmitted between 21:30 and 05:30 hours - Appendix A, Fig. A2), therefore, 208 for each particular date for each vessel, the time gap between observations was visually 209 assessed. 99.99% of the time gaps between consecutive observations in a particular day were 210 less than 3 hours long, therefore a time interval of more than three hours without the receipt 211 of an AIS record was deemed indicative of a vessel switching off the AIS unit at the end of a 212 fishing trip. This value was also chosen based on the rationale that a fishing trip in which 213 there was a gap of 3 hours without information would result in underestimation of total 214 distance travelled. Speed values were calculated by dividing distance by time for two 215 consecutive locations. Unrealistic speeds greater than 40 knots were excluded. It was 216 assumed that a minimum of 12 locations were needed to describe a fishing trip: 3 steaming 217 from port, 6 to characterise a creel deployment pattern, and 3 when steaming back to port. 218 Therefore, only tracks with 12 or more locations were retained.
219
220 Trips in which the total distance travelled was less than 300 m were removed (a conservative 221 estimate of the average minimum distance required to transit in and out of a fishing port). 222 More than 90% of the trips started and ended less than 500 metres away from the coast, 223 therefore, to reduce underestimation of trip duration and distance travelled, only tracks where 224 both the start and end points were less than 500 metres from the coast were retained. This 225 criterion was modified to 1000 metres for Anstruther, where vessels typically tended to shut 226 down their engines, and thus power off their AIS units, while waiting for the tide to turn to 227 allow access to the harbour. It is important to note that many 12m and under fishing vessels 228 are equipped with batteries that have limited capacity or are in poor condition. As a
229 consequence most AIS units were fitted to vessels in such a manner as to ensure that they 230 only received power when the engine was running, thereby minimising the risk of depleting 231 the batteries charge.
232
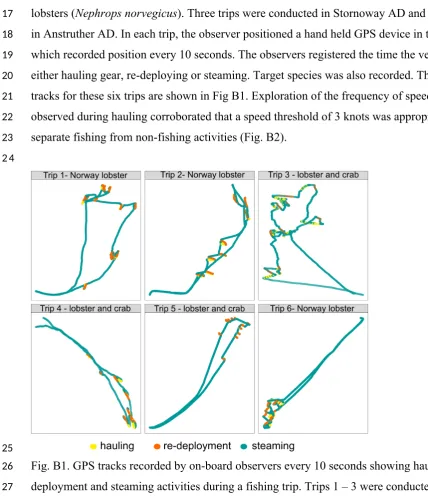
239 there was a start and end location in close proximity to the coast. Intermediate locations 240 within each track concentrated close to each other usually forming a “looping pattern” (see 241 Fig. 1c), were indicative of a vessel drifting during creel recovery. This was supported by 242 observer’s data, where for 6 fishing trips in 6 different vessels, time of steaming, hauling of 243 gear and gear re-deployment was recorded. Observer’s used a handheld GPS unit (Garmin 244 Etrex 20x) set at polling intervals of 10 seconds (Appendix B, Fig B1).
245
246 2.3.2 Location of fishing activities
247
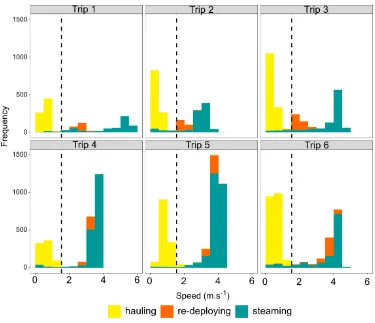
248 To identify fishing activities within the data, observations where speed over ground (SOG) 249 ranged from > 0.0 – 3.0 knots were retained. This threshold was defined through inspection of 250 observer’s data (Appendix B, Fig B2 and through consultation with fishermen). After visual 251 inspection, spatial buffer zones of 100 metres were set around landing ports to avoid 252 incorporating locations with low speeds as a result of transiting harbour areas. This 253 conservative threshold was based on observations of vessels deploying gear at distances <300m 254 from port (Mendo, pers. obs). Tracks were then divided when speeds between consecutive 255 observations were > 3 knots, as this was indicative of a vessel switching from fishing to other 256 activities. The maximum spatial gap permitted between two consecutive AIS records was 1000 257 metres and the maximum temporal gap between consecutive AIS locations was set to 15 258 minutes.
259
9 272 fishing during the month. Fishing activity levels were calculated by aggregating all density 273 surfaces by AD during each month.
274
275 2.3.3. Vessel dependency on fishing grounds
276
277 To identify which grid cells were used by multiple vessels, the number of vessels fishing in 278 each grid cell (1000 metres x 1000 metres) was calculated by month for each AD. The resulting 279 map was not scaled by fishing activity levels but rather identified the importance of areas where 280 multiple vessels spent time fishing.
281
282 3. Results
283
284 3.1 AIS coverage and data management 285
286 The AIS reception model suggests that the majority (~85%) of Scottish Territorial waters are 287 covered (Fig. 1). Discrete areas such as within sea lochs, west of Skye, outer Moray Firth, Firth 288 of Forth, and north-west coast of the mainland show poor predicted reception (Fig. 1), which 289 may require more detailed investigation. In areas with low predicted reception, scarcity of AIS 290 records resulted in failure to identify individual fishing trips (Fig. 2a). However, in areas where 291 the predicted reception was high, individual fishing trips could be identified for each vessel 292 (Fig. 2b).
293
294 ######Fig. 1 here 295
296 ######Fig. 2 here 297
306 Fife, the frequency of AIS records ranged from 5 – 7 minutes even when vessels were clearly 307 in transit.
308
309 3.2 Potential applications for fisheries management and marine spatial planning 310
311 Mean trip duration showed regional differences (Fig. 3a), vessels in the Outer Hebrides 312 generally conducted longer trips (7.49 h [6.98 – 8.01 CI]) compared to vessels in Fife and 313 Shetland (5.1 h [4.22 – 5.98 CI] and 5.44 h [4.71 – 6.17 CI], respectively, ANOVA F=16.129, 314 df=2,74, p<0.001). Mean distance travelled per trip for each vessel again showed regional 315 variation (Fig. 3b, ANOVA F=5.11; df=2,74; p<0.01). The mean distance travelled for vessels 316 in the Outer Hebrides was greater (36.8 km [32.06 – 51.57 CI]) than the distance travelled by 317 vessels in Fife (24.9 km [17.92 – 31.91 CI]). There was no significant difference between 318 distance travelled in Fife and in Shetland (28.2 km [23.09 – 33.43 CI]).
319
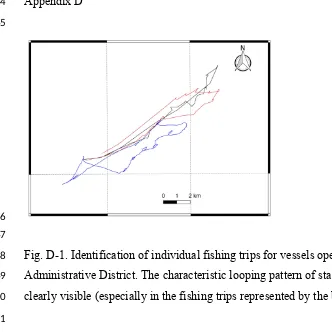
320 The set of criteria used to identify fishing trips showed low error rates (Outer Hebrides = 9.4%, 321 Shetland = 10.4%, Fife = 10.5%). The main reasons for error in identification of trips were 322 either poor AIS coverage (which made it difficult to identify the characteristic looping pattern 323 of static gear recovery) or two or more fishing trips being incorrectly identified as one. This 324 occurred on 32 occasions from 1037 trips (Outer Hebrides), 9 out of 519 trips (Shetland), and 325 18 from 429 trips, (Fife) where the gaps between successive trips was less than 3 hours. Due 326 to the greater gap between consecutive AIS records in Fife, it proved more challenging to 327 identify individual fishing trips (see Fig. D1 in Appendix D).
328
329 ######Fig. 3 here 330
331 3.2.1 Fishing activity
332
11 340 activities concentrated in the same areas from August to October (Fig. 4 d-f). In the Outer 341 Hebrides, while fishing activities occurred on both the western and eastern side of the islands 342 during August and September, in October, activities concentrated more on the Eastern side 343 (Fig. 4 g-i).
344
345 ######Fig. 4 here 346
347 3.2.2 Vessel dependency on fishing grounds
348
349 Within the fishing grounds identified above and irrespective of fishing effort, some areas were 350 used by a greater number of fishing vessels than others. This is the case in Fife where a greater 351 number of vessels are dependent on nearshore areas with only a small proportion travelling to 352 areas further offshore (Fig. 5 a-c). In Shetland, the number of vessels using fishing grounds 353 decreased as the season progressed (Fig. 5 d-f). In the Outer Hebrides, there was a southward 354 shift of vessels towards more central areas as well as clear movement from western to Eastern 355 areas (Fig. 5 g-i). Shetland and the Outer Hebrides showed a more patchy distribution of fishing 356 vessels compared to Fife.
357
358 ######Fig. 5 here 359
360 4. Discussion 361
362 This study demonstrates that AIS data can provide a valid tool to inform fisheries management 363 and marine spatial planning within the context of SSF, focusing on Scottish ≤12 m static gear 364 vessels. The collated AIS data allowed us to determine the location of, extent, and time 365 expended in fishing activities, and map these at a fine spatial scale. Duration of fishing trips 366 and distance travelled, and an index of vessel dependency to particular fishing areas were also 367 estimated at spatial scales more suited to SSF management than those currently used. However, 368 our results also flag several issues that should be addressed in order for the methodology to be 369 widely applicable for statutory fisheries management and marine planning purposes.
370
371 4.1 AIS data: coverage, opportunities and challenges
373 The Longley Rice Irregular Terrain (LRIT) model provides a method for predicting the likely 374 coverage of AIS reception by ground stations around Scotland. Further dedicated high 375 resolution field verification is required to validate its utility, particularly in very near shore 376 environments where local topography may impair VHF reception. Differences between 377 predicted areas and recorded areas of AIS reception from vessels were evident in this study 378 (e.g. Figure 1b). The base stations used were those officially licenced AIS transceivers 379 registered with Ofcom (the UK regulator), therefore, the predicted range of reception is highly 380 conservative as it does not take into account the numerous AIS receivers that provide AIS data 381 but are not required to be licenced. Ofcom (the UK regulator) only requires AIS transceivers 382 to be licenced and to provide technical information including the location of these devices [26]. 383 Companies that harvest AIS data commercially acquire these data from various sources, 384 including receivers for which no licence is required and there is little or no information upon 385 which to model their reception range. The use of LRIT to plan and optimise the location and 386 coverage of AIS receivers is worthy of further consideration if AIS is to be used for statutory 387 or monitoring purposes.
388
389 Given the volumes of data likely to be generated by the large number of SSF vessels, it is 390 important to consider the computational demands for dealing with these data. This study 391 utilises freely available open source software such as POSTgresSQL, R, and QGIS together to 392 process large volumes of AIS data on a single computer, which demonstrates the utility and 393 cost effectiveness of these platforms. Storing of data and the application of quality control 394 filters were efficiently conducted. The growing global community developing open source 395 solutions [e.g. 32, 35] underpins the potential for spatial data to be analysed in both cost 396 effective and in computationally efficient ways which could revolutionise the monitoring and 397 management of SSF worldwide.
398
13 407 and provenance of these data needs to be of a standard that will bear scientific and legal 408 scrutiny.
409
410 4.2 AIS Data Utility in the context of SSF
411
412 Individual fishing trips could be identified by applying a set of filtering criteria to the AIS data. 413 In this study, criteria were necessary to discern fishing trips from non-fishing movements 414 between ports or periods during which the vessel was transmitting its location but was in port. 415 Consideration had to be given to tailoring the criteria to the specific fishery and allow for some 416 regional variations depending on operational characteristics of the fleet (e.g. distance to port at 417 the end of the trip). Region-specific approaches may be required to correctly identify fishing 418 trips as shown for other fisheries using VMS, such as the commercial fishing vessels targeting 419 walleye pollock (Gadus chalcogrammus) in the Eastern Bering Sea [36]. Although error rates 420 in identifying fishing trips were low, methods could be refined. For example, while the majority 421 of skippers reported predominantly using creels, about 10% of the vessels examined in the 422 three AD reported occasionally switching to line and nets [28]. It would be useful to develop 423 spatial methods to differentiate between tracks where different gears are being deployed. 424 Moreover, linking fisher’s logbook data to AIS information would improve the characterisation 425 of a fishing trip in terms of gear used in that particular trip. Distinguishing between different 426 states or behaviours observed during a fishing trip such as steaming to fishing grounds, actively 427 fishing, manoeuvring to retrieve snagged gear for example, would prove useful to identify the 428 spatio temporal reference points needed to infer commercial fishing activity [37, 38] and should 429 be further explored for different fishing gears in the context of SSF.
430
431 Trip duration and distance travelled were calculated to provide information on differences in 432 SSF fleet activity, which could be useful for regional management measures. Over time, this 433 information can highlight fishing patterns that may be a function of changes in species targeted 434 and the abundance and location of target species [39]. Estimates of distance travelled could be 435 used to estimate fuel costs and when combined with vessel characteristics such as size, engine 436 capacity and value of catch, for example, estimates of profitability and fleet-scale economic 437 viability could be assessed [40, 41].
438
441 fishing activity than vessels in Fife and Shetland. This may be associated with longer fishing 442 trips (both in duration and in distance covered) and associated higher fuel expenses. The spatial 443 scales and temporal resolution of these fisheries data would depend on the questions addressed, 444 and these would have to be discussed with the fishermen involved in order to maintain working 445 relationships [42].
446
447 A metric of dependency on fishing location was developed using the MMSI number, which is 448 a unique number that identifies a vessel. The level of dependency varied among regions, and 449 revealed that in Fife, the number of vessels dependent on a particular fishing area was greater 450 than in Shetland, despite the similar number of participating vessels from the two districts. 451 This metric could aid managers in deciding when and where measures such as an exclusion 452 zone during for example, the installation of marine devices such as wind turbines, or localised 453 fishing restrictions would affect the least number of fishermen in each area. For many vessels, 454 the number and location of fishing positions are quite limited. Several factors might be 455 influencing these results such as vessel size, engine power or lack of facilities to process their 456 catch which limit the distance they can travel in a given time and the range of weather 457 conditions in which they can operate [43]. In combination, these factors could be used to 458 predict potential displacement of fishing activities. Understanding these drivers would inform 459 on the impacts of economic or legislative change on the fishing sector [44, 45] and allow 460 regulators, legislators and the industry itself to act pre-emptively to buffer these effects, 461 increasing resilience of SSF.
462
463 4.3 Broader applications and future developments
464
15 475 retrospective reporting if switched to silent mode during fishing activity. In the absence of 476 binding and enforceable regulation, it is unlikely that fishers will universally adopt and 477 consistently use AIS. As AIS is principally designed as a collision avoidance system, it could 478 be argued that using it for monitoring fishing activity and by extension compliance and 479 enforcement of regulations, may undermine its use for safety purposes. Notwithstanding these 480 caveats AIS is no more vulnerable than other methods of tracking fishing vessel activity and 481 probably represents a low cost, accessible and an increasingly widely available data source. 482
483 The underlying driver for using AIS data to track vessel activity is that they are publicly 484 available, can be acquired at relatively low cost, and can be analysed robustly using low-485 powered, open source computational analysis. Topographic and operational limits on the 486 reception of AIS data can be overcome using store and forward capability utilising GSM and 487 LEO satellite reception for example. In the future, the decreasing cost of these forms of data 488 acquisition coupled with increasing deployment of the launch of ~60 low-cost micro- and 489 nanosatellites planned in coming years [46] and the potential for in-port Wi-Fi data upload, 490 suggests that a variety of relatively low-cost options for monitoring SSF will be feasible. Using 491 available and developing technologies to capture and combine highly resolved fishing vessel 492 tracks with operational and catch data is increasingly feasible. A suite of statistical methods 493 [47] and the use of machine learning and data-mining techniques [48] are also developing apace 494 and offer the potential to automatically interrogate and interpret AIS data to provide more 495 comprehensive and up to date information to inform fisheries management and marine 496 planning.
497
509 designed. Numerous systems and protocols for recording and uploading catch data manually 510 already exist. The rapid expansion, ease of access and widespread use of open source software 511 and low-cost electronics suggests that data collection from SSF will become increasingly 512 automated. Policy makers, regulators and those involved in undertaking small scale fisheries 513 need to react swiftly to understand both the opportunities and challenges of adopting these 514 technologies and processes. Agreed data standards, interoperability and security of data will be 515 of particular importance. The rapid development of low cost and easily deployed technology 516 and processes is likely to have global reach in SSF and for the first time, may open up the 517 potential to monitor previously unregulated commercial and recreational fisheries.
518
519 Acknowledgements 520
521 This study was funded by the 2014/15 European Fisheries Fund ‘Evidence Gathering in 522 Support of Sustainable Scottish Inshore Fisheries’ (Grant Number: MI-NC-3-0093). Mark 523 James, Tania Mendo, and John Thompson were supported by the MASTS pooling initiative 524 (The Marine Alliance for Science and Technology for Scotland). Their support is gratefully 525 acknowledged. MASTS is funded by the Scottish Funding Council (grant reference
526 HR09011) and contributing institutions. The research would not have been possible without 527 the support of the 274 fishing vessel skippers who provided access to their vessels and data. 528 Alex Farrant of CloudRF provided advice and helped to model the AIS radio frequency 529 propagation. Jim Furness of Omni Marine Ltd., led the fitting of AIS units and provided 530 invaluable technical advice. Thanks to Jim Watson and Nick Lake for helpful discussions and 531 to the two anonymous reviewers, for their constructive comments which helped us improve 532 the manuscript.
17 534 References
535 [1] FAO, The State of World Fisheries and Aquaculture. 2014, Food and Agriculture Organisation of 536 the United Nations, Rome, 2014, p. 180.
537 [2] HLPE, Sustainable fisheries and aquaculture for food security and nutrition: A report by the high 538 level panel of experts on food security and nutrition of the Committee on World Food Security, 539 Rome, 2014, p. 119.
540 [3] C. Ehler, F. Douvere, Visions for a sea change. Report of the first international workshop on 541 marine spatial planning. Intergovernmental oceanographic commission and man and the biosphere 542 programme. IOC manual and guides, UNESCO, Paris, 2007, p. 83.
543 [4] European Commision, Directive 2008/56/ of the European Parliament and of the Council of 17 544 June 2008 establishing a framework for community action in the field of marine environmental policy 545 (Marine Strategy Framework Directive), in: O.J.o.t.E. Union (Ed.) L164, 2008, pp. 19-40.
546 [5] I. Chollett, S.J. Box, P.J. Mumby, Quantifying the squeezing or stretching of fisheries as they 547 adapt to displacement by marine reserves, Conservation Biology 30(1) (2016) 166-175. doi: 548 10.1111/cobi.12573
549 [6] M.S. Campbell, K.M. Stehfest, S.C. Votier, J.M. Hall-Spencer, Mapping fisheries for marine 550 spatial planning: Gear-specific vessel monitoring system (VMS), marine conservation and offshore 551 renewable energy, Marine Policy 45 (2014) 293-300. doi: 10.1016/j.marpol.2013.09.015
552 [7] J.G. Hiddink, S. Jennings, M.J. Kaiser, Assessing and predicting the relative ecological impacts of 553 disturbance on habitats with different sensitivities, J. Appl. Ecol. 44(2) (2007) 405-413. doi:
554 10.1111/j.1365-2664.2007.01274.x
555 [8] UNEP, Certification and sustainable fisheries, United Nations Environment Programme Division 556 of Technology, Industry and Economics, Geveva, Switzerland, 2009, p. 116.
557 [9] G. Macfadyen, P. Salz, R. Cappell, Characteristics of small-scale coastal fisheries in Europe, 558 European Parliament, Directorate-General for Internal Policies of the Union Brussels, 2011, p. 162. 559 [10] A. Kafas, A. McLay, M. Chimienti, B.E. Scott, I. Davies, M. Gubbins, ScotMap: Participatory 560 mapping of inshore fishing activity to inform marine spatial planning in Scotland, Marine Policy 79 561 (2017) 8-18. doi: 10.1016/j.marpol.2017.01.009
562 [11] NAFC Marine Centre, Shetland Islands' Marine Spatial Plan fourth edition, NAFC Marine 563 Centre, 2014, p. 202.
564 [12] D.C. Dunn, K. Stewart, R.H. Bjorkland, M. Haughton, S. Singh-Renton, R. Lewison, L. Thorne, 565 P.N. Halpin, A regional analysis of coastal and domestic fishing effort in the wider Caribbean, 566 Fisheries Research 102(1-2) (2010) 60-68. doi: 10.1016/j.fishres.2009.10.010
567 [13] P. Breen, K. Vanstaen, R.W.E. Clark, Mapping inshore fishing activity using aerial, land, and 568 vessel-based sighting information, Ices Journal of Marine Science 72(2) (2015) 467-479. doi: 569 10.1093/icesjms/fsu115
570 [14] N.A. Gribble, J.W.A. Robertson, Fishing effort in the far northern section cross shelf closure area 571 of the Great Barrier Reef Marine Park: the effectiveness of area-closures, Journal of Environmental 572 Management 52(1) (1998) 53-67. doi: 10.1006/jema.1997.0160
573 [15] S. Kavadas, I. Maina, D. Damalas, I. Dokos, M. Pantazi, V. Vassiloppoulou, Multi-Criteria 574 Decision Analysis as a tool to extract fishing footprints and estimate fishing pressure: application to 575 small scale coastal fisheries and implications for management in the context of the Maritime Spatial 576 Planning Directive, 2015 16(2) (2015) 294-304. doi: 10.12681/mms.1087
577 [16] European Commision, Council Regulation (EC) No. 1224/2009 of 20 November 2009 578 establishing a Community control system for ensuring compliance with the rules of the Common 579 Fisheries Policy., Official Journal of the European Union, 2009, pp. 1-50.
580 [17] R.L. Shelmerdine, Teasing out the detail: How our understanding of marine AIS data can better 581 inform industries, developments, and planning, Marine Policy 54 (2015) 17-25. doi:
582 10.1016/j.marpol.2014.12.010
583 [18] F. Natale, M. Gibin, A. Alessandrini, M. Vespe, A. Paulrud, Mapping Fishing Effort through AIS 584 Data, Plos One 10(6) (2015) 16. doi: 10.1371/journal.pone.0130746
588 [20] R.L. Shelmerdine, B. Leslie, A multidisciplinary approach to collection and use of VMS data 589 from an inshore scallop fishery. NAFC Marine Centre. Report of Fishing Industry Science Alliance 590 (FISA) project 04/12, Scottish Marine and Freshwater Science 6(13) (2015) 1-27. doi:
591 [21] O. Tully, Atlas of commercial fisheries for shellfish around Ireland, Marine Institute, 2017, 592 p. 58.
593 [22] T. Russo, L. D’Andrea, A. Parisi, M. Martinelli, A. Belardinelli, F. Boccoli, I. Cignini, M. 594 Tordoni, S. Cataudella, Assessing the fishing footprint using data integrated from different tracking 595 devices: Issues and opportunities, Ecological Indicators 69(Supplement C) (2016) 818-827. doi: 596 https://doi.org/10.1016/j.ecolind.2016.04.043
597 [23] F. Mazzarella, M. Vespe, D. Damalas, G. Osio, Discovering vessel activities at sea using AIS 598 data: Mapping of fishing footprints, International Conference on Information Fusion (FUSION), 599 Salamanca, Spain, 2014, pp. 1-7.
600 [24] MMO, Details of registered and licensed vessels over 10 metres and 10 metres and under, 2016. 601 https://www.gov.uk/government/collections/uk-vessel-lists. (Accessed 10/05/2016).
602 [25] M.A. James, J. Thompson, Radio Frequency Propagation Mapping in Relation to the Use of 603 Automatic Identification Systems (AIS) and Global System for Mobile communications (GSM) 604 around the Scottish Coast. A report prepared for Marine Scotland, University of St. Andrews, 2015, p. 605 33.
606 [26] Ofcom, Ofcom Spectrum Information System / Ofcom spectrum management (WTR), 2016. 607 http://spectruminfo.ofcom.org.uk/spectrumInfo/licences. (Accessed 12/07/2015).
608 [27] J.S. Seybold, Introduction to RF propagation, John Wiley & Sons, Inc., New Jersey, United 609 States of America, 2005.
610 [28] M.A. James, J.B. Thompson, A. McKnight, K. Orr, Gathering in Support of Sustainable Scottish 611 Inshore Fisheries: Establishing the Location of Offshore Fishing Activities within Scottish Inshore 612 Areas Using Appropriate Technology. , MASTS, 2015, p. 34.
613 [29] R Development Core Team. R: A language and environment for statistical computing. R 614 Foundation for Statistical Computing, Vienna, Austria, 2016.
615 [30] J. Conway, D. Eddelbuettel, T. Nishiyama, S.K. Prayaga, N. Tiffin, RPostgreSQL: R Interface to 616 the 'PostgreSQL' Database System. R package version 0.6-2, (2017). doi:
617 [31] Marine Scotland Science. Fish and Shellfish Stocks. 2016 Edition The Scottish Government, 618 Scotland, 2016, p. 54.
619 [32] C. Calenge, The package "adehabitat" for the R software: A tool for the analysis of space and 620 habitat use by animals, Ecological Modelling 197(3-4) (2006) 516-519. doi:
621 10.1016/j.ecolmodel.2006.03.017
622 [33] T. Duong, ks: Kernel Smoothing. R package version 1.10.6., 2017.
623 [34] G.M. Blundell, J.A.K. Maier, E.M. Debevec, Linear home ranges: effects of smoothing, sample 624 size, and autocorrelation on kernel estimates, Ecological Monographs 71(3) (2001) 469-489. doi: 625 10.1890/0012-9615(2001)071[0469:LHREOS]2.0.CO;2
626 [35] F. Urbano, F. Cagnacci, Spatial Database for GPS Wildlife Tracking Data: A Practical Guide to 627 Creating a Data Management System with PostgreSQL/PostGIS and R, Springer International 628 Publishing2014.
629 [36] J.T. Watson, A.C. Haynie, Using Vessel Monitoring System data to identify and characterize 630 trips made by fishing vessels in the United States North Pacific, Plos One 11(10) (2016) 1-20. doi: 631 10.1371/journal.pone.0165173
632 [37] D. Peel, N.M. Good, A hidden Markov model approach for determining vessel activity from 633 vessel monitoring system data, Canadian Journal of Fisheries and Aquatic Sciences 68(7) (2011) 634 1252-1264. doi: 10.1139/f2011-055
635 [38] C. Charles, D. Gillis, E. Wade, Using hidden Markov models to infer vessel activities in the snow 636 crab (Chionoecetes opilio) fixed gear fishery and their application to catch standardization, Canadian 637 Journal of Fisheries and Aquatic Sciences 71(12) (2014) 1817-1829. doi: 10.1139/cjfas-2013-0572 638 [39] S. Bertrand, J.M. Burgos, F. Gerlotto, J. Atiquipa, Lévy trajectories of Peruvian purse-seiners as 639 an indicator of the spatial distribution of anchovy ( Engraulis ringens ), ICES Journal of Marine 640 Science 62(3) (2005) 477-482. doi: 10.1016/j.icesjms.2004.12.002
19 641 [40] T. Russo, A. Parisi, G. Garofalo, M. Gristina, S. Cataudella, F. Fiorentino, SMART: A spatially 642 explicit bio-economic model for assessing and managing demersal fisheries, with an application to 643 Italian trawlers in the Strait of Sicily, Plos One 9(1) (2014) 18. doi: 10.1371/journal.pone.0086222 644 [41] G. Tserpes, N. Nikolioudakis, C. Maravelias, N. Carvalho, G. Merino, Viability and management 645 targets of Mediterranean demersal fisheries: The case of the Aegean Sea, Plos One 11(12) (2016) 15. 646 doi: 10.1371/journal.pone.0168694
647 [42] R.L. Shelmerdine, R.J. Shucksmith, B. Mouat, Fisheries management in the context of shared 648 seas. A study commissioned by Fisheries Innovation Scotland (FIS), 2017, p. 58.
649 [43] K. Metcalfe, T. Collins, K.E. Abernethy, R. Boumba, J.-C. Dengui, R. Miyalou, R.J. Parnell, 650 K.E. Plummer, D.J.F. Russell, G.K. Safou, D. Tilley, R.A. Turner, H. VanLeeuwe, M.J. Witt, B.J. 651 Godley, Addressing uncertainty in marine resource management; combining community engagement 652 and tracking technology to characterize human behavior, Conservation Letters (2016) 460–469. doi: 653 10.1111/conl.12293
654 [44] Y. Vermard, P. Marchal, S. Mahevas, O. Thebaud, A dynamic model of the Bay of Biscay 655 pelagic fleet simulating fishing trip choice: the response to the closure of the European anchovy 656 (Engraulis encrasicolus) fishery in 2005, Canadian Journal of Fisheries and Aquatic Sciences 65(11) 657 (2008) 2444-2453. doi: 10.1139/f08-147
658 [45] J.E. Wilen, M.D. Smith, D. Lockwood, L.W. Botsford, Avoiding surprises: Incorporating 659 fisherman behavior into management models, Bulletin of Marine Science 70(2) (2002) 553-575. doi: 660 [46] D.J. McCauley, P. Woods, B. Sullivan, B. Bergman, C. Jablonicky, A. Roan, M. Hirshfield, K. 661 Boerder, B. Worm, Ending hide and seek at sea, Science 351(6278) (2016) 1148-1150. doi:
662 10.1126/science.aad5686
663 [47] Y. Vermard, E. Rivot, S. Mahevas, P. Marchal, D. Gascuel, Identifying fishing trip behaviour 664 and estimating fishing effort from VMS data using Bayesian Hidden Markov Models, Ecological 665 Modelling 221(15) (2010) 1757-1769. doi: 10.1016/j.ecolmodel.2010.04.005
666 [48] E.N. de Souza, K. Boerder, S. Matwin, B. Worm, Improving Fishing Pattern Detection from 667 Satellite AIS Using Data Mining and Machine Learning, Plos One 11(7) (2016) 20. doi:
A B
D
E
T
rip du
ration (
hours)
2
4
6
8
b
b
a
Distance trav
elled
(km
)
20
40
60
80
b
ab
Time fishing (hours)
d) e) f)
f) f)
h)
Number of vessels /grid cell
0 1 2 3
4
d) e) f
during August, September and October 2015.
Region Month Average fishing
activity (hours) per vessel (CI)
Total fishing activity (hours)
Number of vessels
Fife 8 21.11 (14.25 – 28.20) 399.6 19
Fife 9 27.31 (20.12 – 34.50) 487.5 18
Fife 10 18.67 (11.81 – 25.52) 317.4 17
Shetland 8 29.86 (16.39 – 43.32) 507.6 17
Shetland 9 30.23 (17.38 – 43.09) 544.2 18
Shetland 10 22.22 (10.71 – 33.73) 400.0 18
Outer Hebrides 8 35.60 (28.16 – 43.05) 1175.0 33
Outer Hebrides 9 40.15 (32.02 – 48.28) 1445.6 36
[image:28.595.88.517.127.380.2]2
3 Fig. A1. Distance moved between two consecutive transmissions by vessels (i.e. A, B, and C)
4 from August to October 2015. Red circles indicate example of periods of no activity, when
5 AIS units were left turned on recording location in ports.
[image:29.595.73.522.93.401.2]9 Fig. A2. Frequency of AIS observations (pooled for the three different Administrative
10 Districts) during hours of the day
[image:30.595.60.447.69.379.2]14
15 Observers conducted six trips on board of six different small scale fishing vessels using creels
16 and pots and targeting lobsters (Homarus gammarus) and crabs (Cancer pagurus) or Norway
17 lobsters (Nephrops norvegicus). Three trips were conducted in Stornoway AD and three trips
18 in Anstruther AD. In each trip, the observer positioned a hand held GPS device in the cabin,
19 which recorded position every 10 seconds. The observers registered the time the vessel spent
20 either hauling gear, re-deploying or steaming. Target species was also recorded. The GPS
21 tracks for these six trips are shown in Fig B1. Exploration of the frequency of speeds
22 observed during hauling corroborated that a speed threshold of 3 knots was appropriate to
23 separate fishing from non-fishing activities (Fig. B2).
24
25
26 Fig. B1. GPS tracks recorded by on-board observers every 10 seconds showing hauling,
re-27 deployment and steaming activities during a fishing trip. Trips 1 – 3 were conducted in
[image:31.595.41.470.149.646.2]30 Fig. B2.Frequency distribution for speeds recorded during hauling, re-deployment of gear
31 (creels and pots), and steaming to fishing grounds. Vertical dashed lines represents the 3 knot
[image:32.595.71.446.67.390.2]34 35
36 Fig. C1. General flow diagram of steps conducted to populate database and pre-processing of
37 AIS data.
[image:33.595.70.449.76.436.2]40 populate database and pre-processing of AIS data.
41
Step Tool Size of dataset Time required
(minutes) Transfer of >13,000
[image:34.595.54.528.128.442.2]csv files into unique table in PostgreSQL database
Javascript 3.7 x 10⁷ AIS
data rows
360
Addition of a spatial component
PostgreSQL and PostGIS 3.7 x 10⁷ AIS
data rows
60
Flagging duplicates based on time and position and flagging rows with no spatial component
PostgreSQL and PostGIS 3.7 x 10⁷ AIS
data rows
210
Subset data to three Administrative districts (AD)
PostgreSQL 1 x 10⁶ AIS data
rows < 2
Dividing tracks into separate fishing trips
R, using the RpostgreSQL interface, following the methods described in main text
1 x 10⁶ AIS data
rows
~45
45
46 47
48 Fig. D-1. Identification of individual fishing trips for vessels operating in Anstruther
49 Administrative District. The characteristic looping pattern of static gear recovery is not
50 clearly visible (especially in the fishing trips represented by the black and the red lines).
[image:35.595.48.380.78.410.2]Fig. 1. Modelled AIS reception around Scotland. Registered AIS Base Stations and AtoNs (black points), modelled reception range of Base Stations and AtoNs (dark blue areas), modelled maximum range of AIS Class B vessel transmissions (light blue areas), Territorial Sea limit (12 NM, black line). A signal should be able to be received at 2m Above Sea Level in the blue areas 99% of the time. A: Fife, B: Outer Hebrides, C: Shetland, D: west of Skye, E: Moray Firth, F: Firth of Forth, G: north-west coast
Fig. 2a) Comparison between all AIS locations in Outer Hebrides (pink) and those retained after identification of fishing trips (overlaid grey points); b) Individual fishing trips showing a looping pattern characteristic of static gear recovery. Coastline and coordinates not shown to maintain vessel anonymity.
Fig. 3. Boxplot of a) mean trip duration (hours) and b) mean distance travelled per fishing trip by AD. Interquartile range (boxes), median (bold lines), 95% CI (bars), outliers (points). , significant differences between AD (small letters). Different letters above the bars indicate significant differences between regions.
Fig. 4. Maps of average fishing activities per vessel (hours per grid cell 1000 m x 1000 m) for each month (August, September and October) in (a-c) Fife, (d-f) Shetland, and (g-h) the Outer Hebrides. Same scale used across regions for visualization purposes.