EN
Error! Unknown document property name.COMMISSION OF THE EUROPEAN COMMUNITIES
Brussels, 28.1.2009 SEC(2009) 76
COMMISSION STAFF WORKING DOCUMENT
Second Consumer Markets Scoreboard
PART 2
COMMISSION STAFF WORKING DOCUMENT Second Consumer Markets Scoreboard
PART 2
14 January 2009
2. Integration of the retail internal market ... 1
2.1 — Cross-border business to consumer trade... 1
2.2 — Complaints, redress and enforcement cross-border ... 8
2. INTEGRATION OF THE RETAIL INTERNAL MARKET
The completion of the internal market is an essential part of meeting Europe’s economic challenges and delivering tangible benefits for EU citizens. The Consumer Policy Strategy 2007-2013 calls for further integration of retail markets. A well-functioning internal market should offer consumers a wider choice of products, the best possible prices, and a consistently high level of consumer protection. A more integrated retail internal market could be an effective response to the current economic slowdown.
2.1 Cross-border business to consumer trade
The level of cross-border trade is one measure of the degree of integration of the retail side of the internal market. It reflects the extent to which retailers are prepared to advertise and make cross-border offers and the extent to which consumers are prepared to make purchases. The level of cross-border retail trade is an outcome of several aspects of consumer policy: legislation designed to simplify cross-border sales for businesses and to guarantee consumer rights; cross-border enforcement measures, administrative burdens for cross-border operations, and cross-border information and advice.
Despite the increase in the number of consumers travelling abroad and the wider use of the internet, the majority of EU consumers still tend to buy goods and services in their own country. Cross-border purchases can be made either by consumers making purchases when abroad or through distance sales channels (e.g. internet, phone, post).
Levels of cross-border transactions
The proportion of consumers and retailers carrying out cross-border transactions has not increased since 2006. Recent surveys1 show that 25% of all EU-27 consumers have made a cross-border purchase in the last year. The corresponding figure in 2006 was 26% in the EU-25, thus the level of cross-border shopping has remained more or less stable. In 2002, 13% of consumers in the EU-15 had made a cross-border purchase. A similar percentage of retailers2 currently sell across borders. Three-quarters of retailers from the EU-27 sell only to consumers in their own country (see Figure 64). Eight percent sell goods to consumers in one or two other EU countries, 6% sell to three to five other EU countries, while 7% sell to six or more countries. Thus one in five enterprises is selling cross-border to at least one other EU country. These figures are significantly lower than in 2006 when 30% of retailers said they were selling cross-border to at least one other EU country.
1
EB 298 — Consumer protection in the internal market, 2008. 2
Figure 64: Cross-border sales to final consumers
9 7
9 6
12 8
67 75
4 4
0% 20% 40% 60% 80% 100% 2006
2008
t o 6 or more ot her EU count ries t o 3-5 ot her EU count ries
t o 1-2 ot her EU-count ries
only t o consumers in my count ry
don't know / no answer
Sources: EB 224 and EB 186
Q: To how many EU countries do you currently make cross-border sales to final consumers?
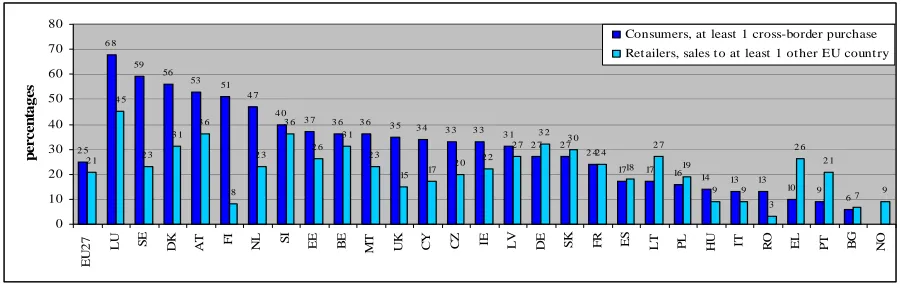
The prevalence of cross-border activity continues to vary significantly across the EU. As demonstrated in Figure 65, shopping cross-border is most common in Luxembourg, Sweden, Denmark, Austria and Finland, with 68% to 51% of consumers doing so. The new Member States have low levels of cross-border purchases (Bulgaria 6%, Romania 13%), as do Portugal, Greece and Italy. Selling cross-border3 is most common in Luxembourg, where 45% of retailers do so. It is lowest in Bulgaria and Romania, where respectively 7% and 3% of retailers sell abroad. In most countries where many consumers shop cross-border, many retailers also sell cross-border, and vice versa. Finland is the notable exception here: over 50% of Finnish consumers have made at least one cross-border purchase, while only 8% of its retailers sell to at least one other EU country. However, Austria and Denmark have high levels of cross-border sales as well as high levels of cross-border purchases. In Bulgaria, Romania and Italy, both cross-border sales and purchases are low.
Figure 65: Cross-border sales and purchases
2 5 6 8
59 56
53 51
4 7 4 0
3 7 3 6 3 6 3 5 3 4 3 3 3 3 3 1
2 7 2 7 2 4
17 17 16
14 13 13
10 9
6 2 1
4 5
2 3 3 1
3 6
8 2 3
3 6
2 6 3 1
2 3
15 17
2 0 2 2 2 7
3 2 3 0
2 4 18
2 7 19
9 9
3 2 6
2 1
7 9
0 10 20 30 40 50 60 70 80
EU
2
7
LU SE DK AT FI NL SI EE BE MT UK CY CZ IE LV DE SK FR ES LT PL HU IT RO EL PT BG NO
p
erc
en
ta
g
e
s
Consumers, at least 1 cross-border purchase
Ret ailers, sales t o at least 1 ot her EU count ry
Sources: EB 298 and Flash EB 224
Q: Please tell me if you have purchased any goods or services in the last 12 months, in (our country) of elsewhere? – To how many EU countries do you currently make cross-border sales to final consumers?
3
[image:4.595.72.531.539.683.2]The fact that most retailers only sell to consumers in their own country, and that only 7% sell to six or more European countries is also reflected by the fact that 8% of consumers who have shopped cross-border at some point had difficulties when they tried to buy goods or services in another EU country because they did not live in that country. On average, retailers sell cross-border to only 1.3 EU countries, which suggests that overall, consumers are limited as to the products they can buy cross-border.
Advertising
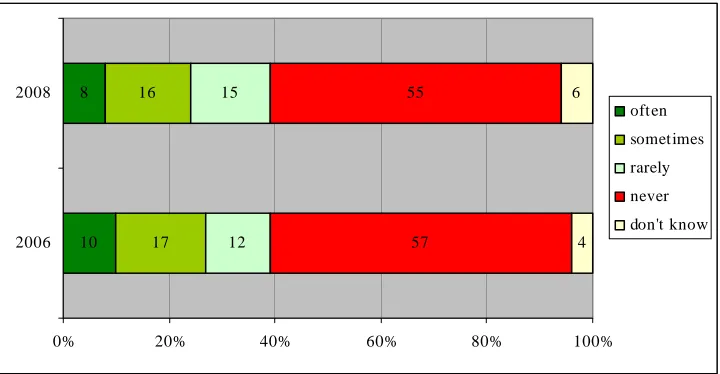
Figure 66 demonstrates that the majority of consumers in the EU-27 have never come across advertisements or offers from sellers or providers located in other EU countries. This is the case for 55% of respondents. Thirty-one percent say they have come across such advertising sometimes or rarely, whereas just 8% have come across it often. These figures are more or less unchanged compared with 2006, when 57% of consumers said they never came across cross-border advertising, and compared with 2002, when 55% said they had not seen or heard cross-border advertising in the last 12 months.
[image:5.595.76.436.434.621.2]Unsurprisingly, there is a strong correlation (0.84) between the percentage of individuals that has recently come across advertising from sellers located in other EU countries, and the percentage of individuals that has shopped cross-border in the last twelve months. Cross-border advertising is clearly designed to have an effect on the number of consumers shopping cross-border, and this seems to be the case. That awareness of cross-border advertising is higher in consumers that already shop cross-border may also play a part in this high correlation.
Figure 66: Consumers coming across cross-border advertising
10 8
17 16
12 15
57 55
4 6
0% 20% 40% 60% 80% 100%
2006 2008
often
sometimes
rarely
never
don't know
Sources: EB 298 and EB 252
Q: In the last 12 months, have you come across advertisements or offers from sellers/providers located in other EU countries?
there has been a small drop in the proportion of retailers actively marketing their products cross-border since 2006.
Figure 67: Retailers advertising to other EU countries
69 72
5 5
7 6
3 3
9 7
7 7
0% 20% 40% 60% 80% 100%
2006 2008
None
to 1 other EU country
to 2 to 3 other EU countries
to 4 to 5 other EU countries
to more than 6 other EU countries don't know / no answer
Source: EB 224 and EB 186
Q: Besides [country], to how many EU countries do you actively market/advertise to final consumers?
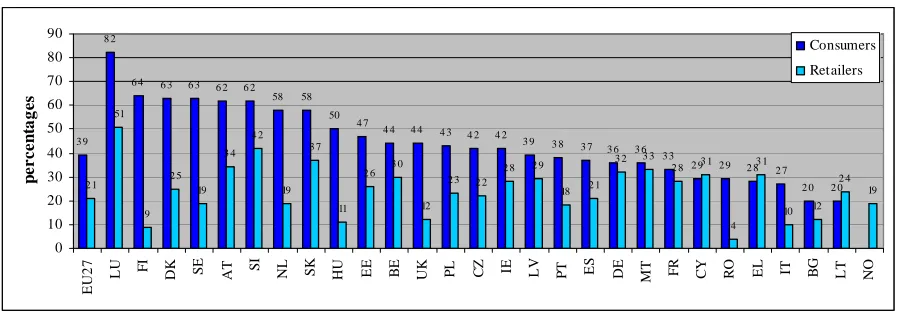
[image:6.595.73.522.531.687.2]Figure 68 shows the prevalence of cross-border advertising across the EU. In Luxembourg, 82% of people have come across cross-border advertising. In Lithuania and Bulgaria, just 20% have done so. Advertising cross-border also differs considerable between Member States: 51% of retailers in Luxembourg advertise cross-border against 4% in Romania. The overall EU figures on cross-border advertising reflect the situation across most EU countries, in that in most of the Member States consumers are more likely to have come across cross-border advertising, than for retailers to be advertising in other EU countries. The only exceptions are Greece and Lithuania.
Figure 68: Cross-border advertising
3 9 8 2
6 4 6 3 6 3 6 2 6 2
58 58
50 4 7
4 4 4 4 4 3 4 2 4 2
3 9 3 8 3 7 3 6 3 6
3 3
2 9 2 9 2 8 2 7
2 0 2 0
2 1 51
9 2 5
19 3 4
4 2
19 3 7
11
2 6 3 0
12
2 3 2 2
2 8 2 9
18 2 1
3 2 3 3
2 8 3 1
4 3 1
10 12
2 4 19
0 10 20 30 40 50 60 70 80 90
EU
2
7
LU FI DK SE AT SI NL SK HU EE BE UK PL CZ IE LV PT ES DE MT FR CY RO EL IT BG LT NO
p
ercen
ta
g
e
s
Consumers
Retailers
Sources: EB 298 and EB 224
The use of distance selling channels
The internet is the most common form of distance shopping: a third of EU consumers (33%) have made a domestic or cross-border purchase via the internet in the past year. This represents an increase of 6% as compared to 2006. The same increase is not observed for other distance sales channels (post, phone, sales representatives) of which the use has remained more or less unchanged since 2006, and which are used less frequently by consumers compared to the internet (between 28% for purchases by post and 9% from a sales representative).
The corresponding figures for retailers reflect these results in that the internet is the most common distance selling medium. Fifty-one percent of retailers said that they sold goods via the internet. Post was the second most popular medium among sellers (30%), and sales through representatives are used by more retailers than telesales (21% vs 17%). Despite e-commerce being such a popular sales channel, there has been a fall since 2006 (among those surveyed) in the proportion of retailers using e-commerce. In 2006, 57% of retailers in the EU-25 sold products via the internet. Thus while the proportion of consumers shopping online has increased, the proportion of retailers selling online has declined.
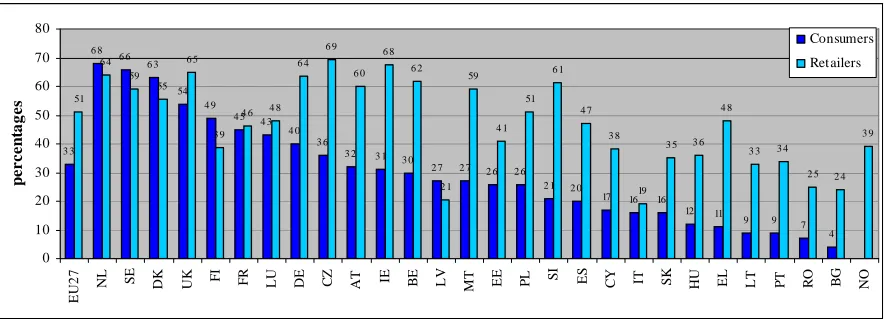
[image:7.595.79.521.516.678.2]There is significant variation in these figures across Member States, which is displayed in Figure 69. Dutch, Swedish and Danish consumers are the most active in buying online, with 68%, 66% and 63% respectively having done so in the last 12 months. In these countries a high proportion of retailers also sell online: 64% in the Netherlands, 58% in Sweden and 55% in Denmark. Bulgarian, Romanian, Portuguese and Lithuanian consumers are the least likely to have shopped online in the last 12 months, and are also amongst the countries with the lowest proportion of retailers using the internet as a retail channel. However, across the EU, the two factors are not strongly correlated, at 0.46, indicating that where retailers are active in internet trade, the same is not necessarily the case for consumers, and vice versa. For example, in Ireland, 68% of retailers sell online, but just 32% of consumers have bought a product online in the last 12 months.
Figure 69: Use of internet for retail
3 3 6 8
6 6 6 3
54 4 9
4 5 4 3
4 0 3 6
3 2 3 1 3 0
2 7 2 7 2 6 2 6
2 1 2 0
17 16 16
12 11
9 9 7
4 51
6 4 59
55 6 5
3 9
4 6 4 8
6 4 6 9
6 0 6 8
6 2
2 1 59
4 1 51
6 1
4 7
3 8
19
3 5 3 6
4 8
3 3 3 4
2 5 2 4
3 9
0 10 20 30 40 50 60 70 80
EU
2
7
NL SE DK UK FI FR LU DE CZ AT IE BE LV MT EE PL SI ES CY IT SK HU EL LT PT RO BG NO
p
e
rcen
ta
g
e
s
Consumers
Ret ailers
Sources: EB 298 and EB 224
However, although internet use increased between 2006 and 2008, consumers tend to distinguish between sellers/providers located in their own country and those located in other countries. Across the EU, 30% of respondents said they purchased goods or services via the internet from sellers/providers in their own country but only 7% made an internet purchase from sellers/providers in other countries. Figure 70 shows that the reluctance to buy from other EU countries is perceptible in all EU Member States with the exception of the three smallest Member States, Luxemburg, Cyprus and Malta. On the other hand, Figure 71 shows that more consumers made cross-border internet purchases in 2008 than in 2006. This applies to all Member States with the exception of the Czech Republic, Hungary, Italy, Poland and Portugal were the figures remained unchanged.
Figure 70: Domestic and cross-order internet purchases
7 3 8
2 3 2 3
19
17 16 16
14 13 13
12
9 8
7 6
5 5 5 4 3 3
2 2 2 1 1 1
3 0 11 56 3 2 5 6 1 2 0 6 2 4 2 2 3 4 52 4 2 14 2 2 3 9 6 2 4 17 12 3 4 7 2 5 7 15 4 11 6 0 10 20 30 40 50 60 70 EU 2 7
LU DK MT AT SE IE NL FI BE CY UK FR ES EE DE EL LV SI IT CZ LT PL PT SK BG HU RO
p
ercen
ta
g
es
Yes, from a seller/provider locat ed in another EU country
Yes from a seller/provider in our country
Source: EB 298
Q: Have you purchased any goods or services in the last 12 months via the internet?
Figure 71: Cross-border internet purchases 2006 and 2008
7 3 8
2 3 2 3
19 17
16 16
14
13 13 12
9 8
7 6 6
5 5
4
3 3
2 2 2 1 1 1
6 2 8 19 11 18 14 12 15 13 12 4 7 7
4 4 4 4
1
3 4 3
1 2 2 1 1
0 5 10 15 20 25 30 35 40 E U 27/ 2 5
LU DK MT AT SE IE NL FI BE CY UK FR ES EE DE SI EL LV IT CZ LT PL PT SK BG HU RO
p e r cen ta g e s 2008 2006
Sources: EB 298 and EB 252
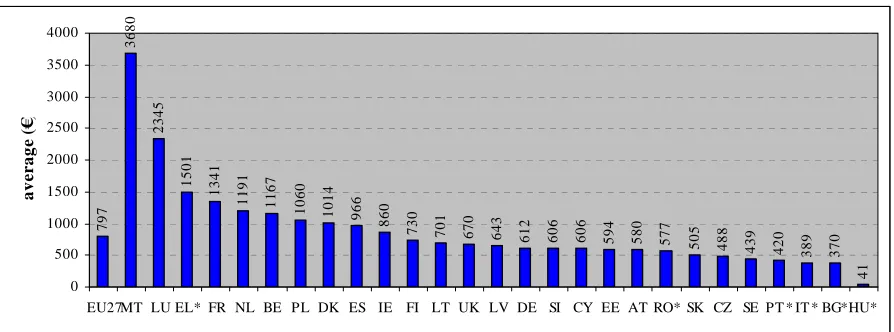
[image:8.595.79.523.507.695.2]Value of purchases
[image:9.595.75.522.215.381.2]In 2008, the European cross-border shopper spent an average of €797 per year on these purchases, against €544 on average in 2006. At country level this ranges from €3679.5 in Malta to €41 in Hungary (though the figure here is only indicative as the base is too small for reliable analysis). Fifty-one percent of consumers who made at least one cross-border purchase spent between €51 and €500 on goods and services offered by sellers and providers located in other EU countries.
Figure 72: Average value of cross-border purchases
797
3680
23
45
1501
1
341
1
191
1167 1060
1014 966 860
73
0
701 670 643 61
2
60
6
60
6
59
4
58
0
57
7
505 488 43
9
42
0
389 370
41
0 500 1000 1500 2000 2500 3000 3500 4000
EU27MT LU EL* FR NL BE PL DK ES IE FI LT UK LV DE SI CY EE AT RO* SK CZ SE PT * IT * BG*HU*
ave
r
a
ge
(
€
)
Source: EB 298 – * bases are too small for reliable analysis
Q: In the last 12 months, approximately what was the total value of the goods or services you said you have purchased from sellers/providers located in other European countries?
Figure 73: Share of cross-border revenue by sales channel
17
14 13
10 16
14 12
9
0 10 20 30 40 50 60
int ernet sales sales made by
represent at ives
mail order or t elephone sales
ret ail sales in shops
p
e
r
cen
ta
g
e
s
2008
2006
Source EB 224 and EB 186
Q: Of the total value of your retail sales in shops / e-commerce/internet sales / mail order sales or telephone sales / sales made by your representatives visiting consumers in their homes, can you estimate the percentage to consumers living in other EU countries?
While consumers appear to be spending more money cross-border, this is not reflected in the share of revenue from cross-border sales in any of the sales channels shown, suggesting that the increase in spending cross-border may be due to an overall increase in spending by the minority who shop cross-border.
2.2 Complaints, redress and enforcement cross-border
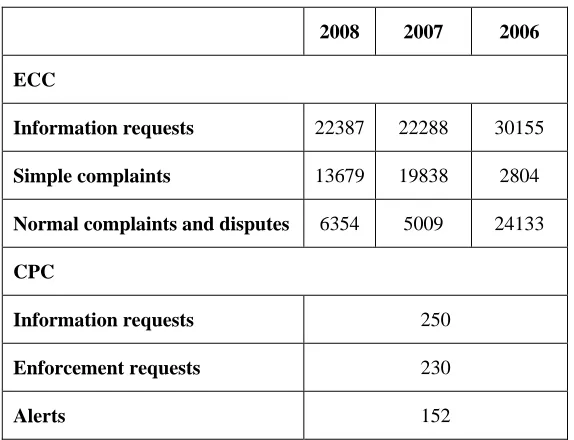
Table 4: ECC and CPC cross-border complaints and information requests
2008 2007 2006
ECC
Information requests 22387 22288 30155
Simple complaints 13679 19838 2804
Normal complaints and disputes 6354 5009 24133
CPC
Information requests 250
Enforcement requests 230
Alerts 152
Notes: ECC 2008 figures are counted up to 1.10.2008 — CPC figures cover cases since early 2007, the start of the system up to 1/10/2008
Sources: ECC-network & Consumer Protection Cooperation System
- ECC information request means any query by a consumer regarding a national or cross-border consumer issue not related to a complaint. This includes requests for brochures.
- ECC complaint means a statement of dissatisfaction by a consumer concerning a concrete cross-border transaction with a seller or supplier. ‘Simple complaints’ are requests for brief information whereas ‘normal complaints’ typically need more input and follow-up. ‘Simple complaints’ which have subsequently been transformed to ‘normal complaints’ are counted only as ‘normal complaints’ to avoid double counting.
- ECC dispute means a referral to an out-of-court scheme (alternative dispute resolution).
- CPC information requests refer to exchanges of information for the purpose of establishing whether an intra-Community infringement has occurred or whether there is reasonable suspicion it may occur.
- CPC enforcement requests are issued when all necessary enforcement measures have to be taken to bring about the cessation or prohibition of the intra-Community infringement without delay.
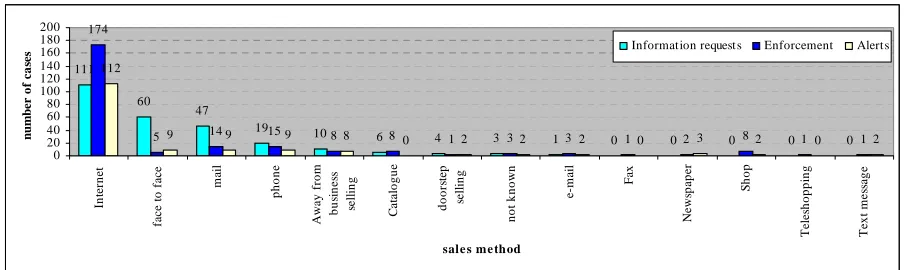
Figures 74 and 75 show ECC cross-border complaints and CPC cross-border cases by sales method. E-commerce is the sales method accounting for by far the most of the cross-border cases. ECC figures for 2007 show that half of the cross-border complaints and disputes were due to purchases made over the internet. The CPC figures make the case even more strongly: three-quarters of the CPC enforcement requests and three-quarters of the CPC alerts were caused by e-commerce.
Figure 74: ECC normal complaints and disputes by sales method - 2007
2489
1508
482
288
109 51 50 32
0 500 1000 1500 2000 2500 3000
E-commerce On the premises Distance selling
(not e-commerce)
Other Doorstep selling Market/trade
[image:12.595.71.525.401.536.2]fair Internet auctions Auctions sales method n u mb er o f ca se s Source: ECC-network
Figure 75: CPC information, enforcement and alerts cases by sales method
111
60 47
19 10
6 4 3 1 0 0 0 0 0
174
5 9 149 159 88 8 0 12 32 3 2 10 23 82 10 12
112 0 20 40 60 80 100 120 140 160 180 200 In te rn e t fa c e t o fa ce ma il pho ne A w a y f rom bus in e ss se ll in g C a ta logue do or st ep se ll in g not k now n e-m ai l Fa x Ne ws p a p e r Sh o p T el es hoppi ng T ext m e ss a ge
sale s me thod
n u m b er o f ca se
s Information request s Enforcement Alerts
Source: Consumer Protection Cooperation System
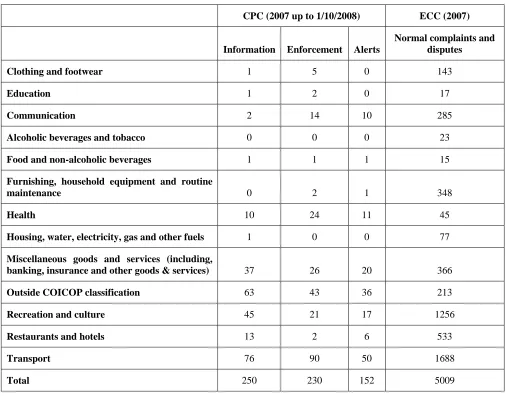
Table 5: CPC and ECC cross-border cases by market
CPC (2007 up to 1/10/2008) ECC (2007)
Information Enforcement Alerts
Normal complaints and disputes
Clothing and footwear 1 5 0 143
Education 1 2 0 17
Communication 2 14 10 285
Alcoholic beverages and tobacco 0 0 0 23
Food and non-alcoholic beverages 1 1 1 15
Furnishing, household equipment and routine
maintenance 0 2 1 348
Health 10 24 11 45
Housing, water, electricity, gas and other fuels 1 0 0 77
Miscellaneous goods and services (including,
banking, insurance and other goods & services) 37 26 20 366
Outside COICOP classification 63 43 36 213
Recreation and culture 45 21 17 1256
Restaurants and hotels 13 2 6 533
Transport 76 90 50 1688
Total 250 230 152 5009
Source: ECC-network and CPCS
[image:13.595.73.524.595.725.2]Figure 76 shows that the problems at the origin of normal ECC complaints and disputes are most likely to relate to the actual product/ service itself or delivery: 33% was due to a problem with the actual product/ service, 28% to delivery, 12% to price and payments, and 10% to contract terms.
Figure 76: ECC normal complaints and disputes by nature of complaint – 2007
1661
579 505
261 243 171
101 66 22 1400 0 200 400 600 800 1000 1200 1400 1600 1800 P roduc t/ S er v ic e D e liv e ry Pr ic e & P a y m en t C o n tra ct t e rm s Re d re ss S e llin g T e c h ni que s/ U n fa ir C o mme rc ia l P ract ices Ot h er s De ce it Ad m in . F o rm alitie s E thi c a l A spe ct s
nature of complaint
2.3 Consumers’ and retailers’ attitudes towards cross-border trade
Confidence in cross-border trade
In the EU-27, confidence in shopping cross-border varies depending on the sales channel used (see Figure 77), though for each channel, at least a third of consumers feel equally confident buying from sellers at home and abroad, or indeed more confident shopping from sellers located in another EU country. Consumers are least confident buying cross-border when shopping by phone or by post — 46% say they would feel more confident doing so in their own country. They are most confident shopping cross-border when on trips — 43% would feel equally or more confident shopping abroad.
[image:14.595.72.436.361.545.2]Consumer confidence in shopping cross-border has increased since 2006. For example, in 2006, 45% of consumers said that they were less confident buying from a seller in another country than their own when shopping via the internet, compared with 37% in 2008. Fifty-four percent felt more confident making purchases from sellers in their own country by phone or post, 50% when buying from sales representatives and 44% on trips. So while only 25% of consumers are currently shopping cross-border, a significant proportion feels that they would be equally confident shopping at home and abroad.
Figure 77: Consumers’ confidence in making cross-border purchases
43 40 35 34
36 37 46 45
21 23
19 21
0% 20% 40% 60% 80% 100%
purchasing goods or services whilst on holiday, a shopping or business trip
purchasing goods or services via the internet purchasing goods or services by phone or post purchasing goods or services from a sales representative at your home or work
equally confident or more confident in another EU country than in our own country more confident in our country than in another EU country
don't know
Source: EB 298
Q: For each of the following would you be more confident making purchases from sellers/providers located in another EU country, in (our country) or equally confident in both?
Figure 78: Consumers considering it worthwhile to buy goods in other EU Member States
4 11
14 17 17 19 19 25
52 57 50 40 39 39 35
28
19 16 20 25 26 26 28
32
25 16 16 18 18 16 18
15
0% 20% 40% 60% 80% 100%
Fruit and vegetables Meat Non-alcoholic beverages ICT - equipment Entertainment and leisure goods Clothing and footwear Electrical household equipment New motor vehicles
Agree Disagree
Neutral Don't know
Source: IPSOS Consumer Satisfaction Survey 2008
Q: Agreement with statement: It is worthwhile to buy (insert good) form another EU-country.
A prerequisite for consumers to be able to purchase a good cross-border is that it is reasonably easy to compare the price of the goods on offer in other countries. As can be seen from Figure 79 this varies according to the goods purchased. Interestingly, relatively complex goods — such as new motor vehicles and ICT equipment — are doing reasonably well. Non-alcoholic beverages are thought to be by far the easiest to compare cross-border, presumably due to the relatively standardised nature of such goods. The market is relatively brand-heavy and it is therefore easy to compare a can of a specific brand cross-border.
Figure 79: Ease to compare prices cross-border
53 30 26 23 23 22 18 16
9 25 34 37 36 39 47 48
34 33 28 26 27 27 23 22
14 11 13 14 14 13 13 14
0% 20% 40% 60% 80% 100%
Non-alcoholic beverages New motor vehicles ICT - equipment Electrical household equipment Entertainment and leisure goods Clothing and Footwear Fruit and vegetables Meat
Agree Disagree
Neutral Don't know
Source: IPSOS Consumer Satisfaction Survey 2008
[image:15.595.75.435.480.668.2]Perceived barriers to cross-border trade
[image:16.595.74.523.285.554.2]A minority of consumers feel that there are increased risks involved when shopping cross-border as opposed to at home. Consumers’ biggest worries in shopping cross-cross-border are that they will have difficulties resolving complaints, and that they will have problems returning products in the cooling-off4 period. A third of consumers think that this problem is more likely when shopping cross-border than in their own country. However, as Figure 80 shows, the majority of consumers think that these problems are equally likely in their own country as in another EU country or more likely in their own country. Almost two-thirds of consumers think that encountering sellers and providers who do not respect consumer laws is equally likely at home and abroad or more likely at home. These results are encouraging, as they indicate that most consumers do not feel that there is a higher risk involved in shopping abroad compared with domestically.
Figure 80: Consumers’ perceptions of problems when shopping cross-border
66 65 61 55 55
24 23 28 33 33
10 12 11 12 12
0% 20% 40% 60% 80% 100%
you could fall victim to scams or frauds when purchasing goods or services you could encounter sellers / providers who do not
respect consumer laws
you could experience delivrey problems with goods and services
you could experience problems when returning a product you bought at a distance within the
cooling off period
you could experience difficulties when resolving problems such as complaints, returns of faulty
products, etc
equally likely in both or more likely in our country than in another EU country more likely in another EU country than in our country
don't know
Source: EB 298
Q: For each of the following situations, would you say that they are more likely to happen in another EU country than in (our country), more likely to happen in (our country) than in another EU country or equally likely in both?
Figure 81 demonstrates retailers’ views on these issues. Sixty or more percent of retailers who are not selling cross-border regard costs associated with varying fiscal regulations, compliance with varying national consumer laws, cross-border delivery, the increased risk of fraud and the greater difficulty in ensuring an efficient after-sales service as important barriers in cross-border transactions. The biggest concern relates to the higher risk of fraud and non-payment in cross-border sales. Sixty-eight percent of retailers not selling cross-border see this as an important obstacle.
4
However, the views of retailers who are selling cross-border suggest that many consumers and non-cross-border retailers may be overly concerned. Of the former, just 55% think of fraud as an important barrier, compared with 68% of the latter. Similarly, other barriers are regarded as important by 54% or fewer of cross-border retailers. Despite the noticeable disparity between the views of cross-border and non-cross-border retailers, many retailers who are selling cross-border continue to regard these barriers as important. Amongst these too, fraud and non-payment is the biggest concern, with 55% of cross-border retailers considering this factor to be important. This suggests that while selling cross-border in many cases does not prove to be as problematic as anticipated, for the majority the expected problems do indeed play a role and may actually deter sellers.
Figure 81: Retailers’ perceptions of barriers to trading cross-border
68 66 66 64
61 60
50
55 54 50
49 47 43
32
0 10 20 30 40 50 60 70 80
higher risk of fraud and non-payment in cross-border
sales
addit ional cost s of compliance wit h different
fiscal regulat ions
ext ra cost s of compliance wit h
different nat ional laws
regulat ing consumer t ransact ions
great er difficult y in
resolving complaint s and conflict s
cross-border
ext ra cost s arising from cross-border delivery
great er difficult y in ensuring an efficient aft
er-sales service
cost s arising from language
differences
p
e
r
cen
ta
g
e
s
not t rading cross-border t rading cross-border
Source: EB 224
Q: Please tell me how important you think these obstacles are to cross-border sales.
Language appears to be a key barrier to increasing the level of cross-border sales and purchases. Figure 82 shows that 59% of retailers say they are able to use more than one language with consumers, while 33% of consumers say they are willing to purchase goods and services in another EU language. Thus many consumers may be prevented from gaining access to the wider choice and lower prices that cross-border shopping potentially offers. By the same token, retailers will have access to a smaller group of potential buyers.
In most EU-27 Member States, fewer than 50% of consumers are willing to make purchases in a foreign language. The exceptions are Luxembourg (81%), Malta (60%), the Netherlands (69%), Sweden (65%), Slovenia (55%) and Denmark (60%). Among EU-27 retailers, over
Figure 82: Consumers and retailers prepared to use another EU language in goods and services transactions
3 3 8 1
6 9 6 5
6 0 6 0
55
4 8 4 6
4 3 4 3
3 9 3 8 3 7 3 6 3 6 3 6
3 4 3 3 3 1
2 9 2 9 2 8 2 8 2 7 2 7
2 3 2 0 59
8 8 79
70
55 8 7
6 9
9 0 9 3
6 9 59
8 1
6 4 79
6 5
75 79
53 74
59 6 2
2 0 59
3 0
71 74
59 6 2
8 2
0 10 20 30 40 50 60 70 80 90 100
EU
2
7
LU NL SE DK MT SI FI EE BE CY AT FR LV CZ EL SK BG DE RO PT UK ES IE LT PL IT HU NO
p
ercen
ta
g
e
s
consumers ret ailers
Sources: EB 298 and EB 224
Q: Thinking generally about purchasing goods and services from sellers/providers located elsewhere in the European Union, which we refer to as cross-border shopping, please tell me to what extent you agree with each of the following questions. You are prepared to purchase goods and services in another EU language. – In how many languages are you currently prepared to carry out transactions with consumers? At least one foreign language.
Harmonisation of laws across the EU
[image:18.595.73.418.509.678.2]Figure 83 demonstrates the impact that the harmonisation of laws regulating transactions with consumers across the EU could have on cross-border activity. Currently, 75% of retailers are not trading cross-border. However, just 41% would not be interested in selling cross-border even if regulations were harmonised. Sixteen percent would be interested in selling to more than ten EU countries, compared with the 3% who are currently doing so. In other words, harmonised regulation has the potential to significantly increase cross-border activity.
Figure 83: Harmonised regulations boosting cross-border activity
3 16
7 12
6
16
4
5
75 41
4 11
0% 20% 40% 60% 80% 100% current cross-border
sales interest in
cross-border sales if regulations were
harmonised
more than 10 EU countries
4-10 EU count ries
2-3 EU count ries
1EU country
not trading cross-border
don't know / no answer
Source: EB 224
Forty-six percent of retailers say that harmonisation would increase the proportion of their cross-border sales and retailers’ views on this issue have become more positive since 2002. In 2002, as in 2008, 46% of retailers said that harmonisation would increase their proportion of cross-border sales. However, 16% now say that cross-border sales would increase a lot, compared with just 9% in 2002.
Figure 84: Harmonised regulations boosting cross-border activity (2)
30%
16% 41%
3%10% increase a litt le
increase a lot
no change
decrease a lit tle / lot
don't know / no answer
Source: EB 224
Q: If the provisions of the laws regulating transactions with consumers were the same throughout the 27 Member States of the EU do you think that the level of your cross-border sales would …
Information on cross-border issues
Figure 85 demonstrates that in the EU, retailers are better informed than consumers about where to get information on cross-border issues. Thirty-three percent of retailers say they know where they can find out about regulations on consumer protection in other EU countries. Twenty-one percent of consumers say they know where to get information and advice about cross-border shopping. This pattern is particularly pronounced in Latvia, where 58% of retailers but just 22% of consumers know where to get information on cross-border shopping/selling issues. By contrast in Luxembourg, Malta, Cyprus and Sweden, more consumers know where to find this information than retailers. Overall, in the majority of Member States, between 50% and 25% of retailers and consumers know where to get information on cross-border trade. In Luxembourg, the best-informed about cross-border sales and purchases overall, fewer than 50% of both retailers and consumers know where to get this information.
Figure 85: Knowledge of where to get information on cross-border transactions
2 1 4 9
4 2
3 9 3 8
3 5 3 4
3 0 3 0
2 8
2 6 2 6 2 5 2 5
2 4 2 4 2 3 2 2
2 1 2 1 2 0 2 0 2 0
18 17
16 12
9 3 2
3 6 3 3
4 5
3 0 3 5
16 4 7
3 3 3 0
2 3 50
3 8 4 1 3 8 4 1
4 4 57
3 2 3 5
2 3
19 19
2 8 4 5
3 4 4 6
2 8
16
0 10 20 30 40 50 60
EU
2
7
LU MT SI CY DK SE EL FI EE NL AT DE LT BE IE CZ LV PT UK FR IT RO ES SK PL BG HU NO
p
e
r
cen
ta
g
e
s
consumers retailers
Sources: EB 298 and EB 224
Q: Thinking generally about purchasing goods or services from sellers/providers located elsewhere in the European Union, please tell me to what extent you agree or disagree with each of the following statements: You know where to get information and advice about cross-border shopping —You know where you can find relevant information about regulations on consumer protection in other EU countries.
Future cross-border shopping
EU consumers’ willingness to shop cross-border is limited. Fifty-seven percent of consumers say that they are not interested in making a cross-border purchase in the next twelve months (see Figure 86). However, a certain proportion of consumers who currently do not shop cross-border seem likely to do so in the near future. Figure 86 indicates that 33% are considering making a cross-border purchase in the next twelve months, which is significantly higher than the 25% that have done so in the last twelve months.
Figure 86: Consumers’ intentions regarding cross-border purchases
3 9 3
18 9
15 2 0
18 57
10 11
0% 20% 40% 60% 80% 100%
You are not interested in making cross-border purchases in the EU in
the next 12 months In the next 12 months you intend to
make cross-border purchases worth more than those you made in the last
12 months totally agree
tend to agree
tend to disagree
totally disagree
don't know
Source: EB 298
[image:20.595.78.438.484.676.2]Twelve percent of Europeans intend to make, in the next twelve months, cross-border purchases worth more than those they made in the past year. The stable situation at EU level masks some differences between the Member States. Significantly more Maltese and Cypriots now say that they intend to spend more on cross-border purchases in the coming year than they did in the last year. A strong reverse trend is observed in Finland and Hungary.
Table 87: Perceived value of future cross-border purchases
12 2 4
18 2 4
16 2 7
18 16
2 3
12 14
2 1
17 18
10 13
11 15
6 9
19
9 11
5 15 13
12
7 13
8 2 0
13 14
2 1
12 14
2 1
18 19
11 15
13 17
9 13
2 4
14 16
13 2 5
0 5 10 15 20 25 30
EU
2
7
MT CY SI EL LU LV EE SE CZ NL AT IE BE PL ES PT UK DE LT DK FR IT HU FI
p
e
rce
n
ta
g
es
2008 2006
Source: EB 298 and EB 252
Q: In the next 12 months you intend to make cross-border purchases worth more than those you made in the past 12 months.
Increased access to the internet may be one way of increasing future cross-border transactions. Thirty-one percent of consumers say they are not interested in cross-border shopping because they do not have access to the internet (see Figure 88). Meanwhile, 64% of consumers say that they are less interested in cross-border shopping because they prefer to shop in person, so in order to increase interest in cross-border shopping steps must be taken to make this more appealing to consumers.
Figure 88: Reasons for not shopping cross-border
4 1 2 1
2 3 10
15 18
16 46
5 5
0% 20% 40% 60% 80% 100% You are less int erest ed in cross-border
shopping because you prefer t o shop (only) in person and not by post , phone
or t hrough t he int ernet You are not int erest ed in cross-border shopping because you do not have access
t o t he int ernet t ot ally agree t end t o agree t end t o disagree
t ot ally disagree
don't know
Source: EB 298
[image:21.595.74.438.537.706.2]