Electronic Structure and Charge Transfer in
the TiO
2
Rutile (110)/Graphene Composite
Using Hybrid DFT Calculations
Peter Gillespie
∗and Natalia Martsinovich
∗Department of Chemistry, University of Sheeld, Brook Hill, Sheeld, UK, S3 7HF
Abstract
Composite systems of TiO2 with nanocarbon materials, such as graphene, graphene oxide and carbon nanotubes, have proven to be ecient photocatalyst materials. How-ever, detailed understanding of their electronic structure and the mechanisms of the charge transfer processes is still lacking. Here, we use hybrid density functional theory calculations to analyse the electronic properties of the ideal rutile (110)-graphene in-terface, in order to understand experimentally observed trends in photoinduced charge transfer. We show that the potential energy surface of pristine graphene physisorbed above rutile (110) is relatively at, enabling many possible positions of graphene above the rutile (110) surface. We verify that tensile and compressive strain has negligible eect on the electronic properties of graphene at low levels of strain. By analysing the band structure of this composite material and the composition of the valence and conduction band edges, we show that both the highest occupied states and the lowest unoccupied states of this composite are dominated by graphene, and that there is also a signicant contribution of Ti orbitals to the two lowest unoccupied bands. We sug-gest that a transition from graphene-dominated occupied bands to mixed graphene and TiO2-based unoccupied bands is responsible for the experimentally observed photoin-duced charge transfer from graphene to TiO2 under visible light irradiation; however, the most stable state for an excess (e.g. photoexcited) electron is localised on the carbon orbitals, which make up the lowest-energy conduction band. This separation of photogenerated electrons and holes makes TiO2-graphene an ecient photocatalyst material.
Introduction
Heterogeneous photocatalysis is a subject area which has seen continuous progress over the years16since the rst proof-of-concept experiment by Fujishima and Honda.7 The potential
split-reducing) the use of limited chemical fuel sources such as oil and natural gas. Furthermore, the ability for these functional materials to clean air and water borne pollutants from indus-trial sources should not be overlooked as these present a further environmental concern.2,812
Titanium dioxide (TiO2) has been a popular material for heterogeneous photocatalysts in many forms due to its low cost, favourable band positions for water splitting, chemical stability, and versatility towards dierent forms of modication.1,1316It is abundantly clear,
however, that single-component photocatalysts are insucient for solar energy applications, as metal oxides generally suer from poor photocatalytic performance under solar irradi-ation emanating from a wide band gap (3.03.2 eV for TiO2) and high charge carrier recombination rates.16,14,15
Combination of TiO2 with another semiconducting material in a heterojunction arrange-ment has been a long-studied concept in both photovoltaics and photocatalysis,3,15,17,18 and
has been quite successful as a means of tackling both the charge recombination problem (through interfacial charge carrier separation) and, by using a narrow-gap semiconductor, enabled extending photon absorption into the visible region. A popular approach from pre-vious decades has been to combine TiO2 with cadmium sulphide (CdS) quantum dots.1,15
Anchoring CdS to the surface of TiO2 has been shown to increase photocatalytic activity notably and longevity to some extent, however issues with photocorrosion in particular pose a problem for potential industrial applications.6,14,19
More recently, studies have been focussed on carbon-nanostructure/TiO2 composite ma-terials,16,17,20,21 starting with carbon nanotubes (NTs)2227 following their isolation in the
early 1990s.28 Following a novel synthesis technique by Williams et al,29 there has been
a surge in interest in composites of TiO2 with graphene.13,30,31 Originally it was proposed
that the large surface areas and electrical conductivities of these carbon nanostructures should help eciently separate generated charge carriers, thus enhancing photocatalytic e-ciency.16,20 Numerous experimental studies22,24,30,3237 have demonstrated that the addition
the material into the visible region.
Such studies provide evidence for strong electronic interaction between the two systems, however, despite attempts to study the mechanism31,38,39 the nature of this charge
trans-fer across the interface is still not fully understood. In particular, the early experiments demonstrated that photoinduced electrons are transferred from TiO2 to graphene,29 so that
graphene is expected to behave as an electron shuttle.40 Shortly thereafter, photocurrent
measurements together with theoretical calculations showed that enhanced light absorption originates from charge-transfer excitation from graphene to TiO2, in the direction opposite to what previously observed.41 Moreover, several experimental studies showed that charge
transfer in both directions is possible (see the overview in Table 1), in particular, dependence of charge transfer direction on the excitation wavelength was demonstrated: from TiO2 to graphene when excited by UV light, and from graphene to TiO2 when excited by visible light.38,39
Computational studies of TiO2-nanocarbon interfaces have made signicant steps in un-derstanding the nature of charge transfer. Notably, it has been demonstrated that there is strong electronic overlap and large interfacial binding energy across the physisorbed TiO2 rutile (110)-graphene interface.41 Ground-state charge transfer from graphene to TiO
2
has been demonstrated, as well as photoinduced charge transfer from graphene to TiO2.41
Time-dependent density functional theory (TD-DFT) and non-adiabatic molecular dynamics (NAMD) studies by Long and Prezhdo,43 in addition to transient UV/Vis absorption
spec-troscopy measurements by Manga et al,42 have shown that transfer of photoexcited electron
from graphene to TiO2 is ecient and is faster than the average excited state lifetime for graphene with measured electron transfer timescales of 200250 femtoseconds.42 These
Table 1: Overview of several experimental and computational investigations of photoinduced charge transfer in TiO2-graphene systems
Research Article System Studied Methodology Observed Directionof Charge Transfer Experimental
Manga et al. 200942 TiO
2/Graphene Oxide
Femtosecond transient UV absorption
spectroscopy Graphene to TiO2
Liang et al. 201239 TiO
2/Graphene
UV-Visible photoluminescence
quenching Both directions possible Pastrana-Martínez et
al. 201238 Graphene OxideTiO2/Reduced photocatalysis kineticsUV-Visible
Graphene to TiO2 (Visible Light); TiO2to
Graphene (UV Light) Xu and Yang 201331 ZnO/Reduced
Graphene Oxide photocatalysis kineticsVisible-region Graphene to ZnO Theoretical
Du et al. 201141 Rutile (110)/Graphene
LDA + U, electron/hole density
plots, simulation of optical absorption
Graphene to Rutile
Long et al. 201243 Rutile (110)/Graphene
PBE + U, time-dependent DFT,
non-adiabatic molecular dynamics
Graphene to Rutile
Li et al. 201344 Anatase
(101)/Graphene
PBE + U, electron density dierence,
density of states Graphene to Anatase
Masuda et al. 201445 Anatase
(001)/Graphene
PBE + U, Bader charge analysis,
electron density plots Graphene to Anatase
These key studies were followed by a number of further studies of the interfaces of graphene with rutile46 and anatase44,45,4750 polymorphs of TiO
2 and other oxides, such
as CeO251 and SrTiO
3,52 as well as several studies of small TiO2 clusters on graphene5358
and graphene-like akes on TiO2 surfaces,59,60 and larger TiO
2/graphene/dye
heterostruc-tures.61 Notably, several of these works conrm the role of graphene as photosensitiser,
leading to photoinduced charge transfer from graphene to TiO2,44,50 similar to the rst
com-putational studies41,43and in agreement with experiments.31,38,62However, no computational
Studying the interface itself is, from a purely computational perspective, very challeng-ing. First, the crystal structures of TiO2 and graphene dier in size and shape. To generate the composite unit cell (UC), each component system needs to be extended such that the resulting composite supercells are commensurate. The resulting composite unit cells are typically very large (in the range of 100-300 atoms) and computationally demanding to sim-ulate and require eciently-scaling parallel software. Second, known shortcomings with pure DFT functionals are the underestimation of semiconductor band gaps63 and the tendency to
inaccurately delocalise the electron density.64To better represent the electronic properties of
TiO2, hybrid DFT/Hartree-Fock(HF) functionals can be used in the simulations, but with large systems such as those represented here the computational cost (typically depending on the number of basis functionsnasn4) is high. Finally, the system also contains semi-metallic graphene, which can make hybrid DFT simulations more susceptible to problems with nu-merical stability and requires careful selection of convergence parameters in the calculations (see the Computational Methodology section).
The complexity and the high computational expense of studying this interface practically limit the choice of the methods available for use. In particular, for this system it has been common for studies to employ pure DFT with a Hubbard `U' correction,65which can correctly
reproduce the band gaps and band positions of TiO2, but where the choice of the parameter U can be quite ambiguous (values ranging from 4.0 to 5.5 eV41,43,45,46,56,60and even as high as
9.0 eV44,48 have been used in studies of TiO
2-graphene interfaces). Hybrid functionals would
be a more reliable choice,6668 which allow consistent comparison of TiO
2-based systems.
However, to the best of our knowledge, only one group recently used hybrid DFT functionals to study a TiO2 anatase (101)/graphene interface.50,69 Even higher accuracy in describing
the electronic structure of this system could, in principle, be achieved using many-body perturbation theory (such as the GW approximation used e.g. for bulk TiO2 in Ref.63), but
such calculations would be prohibitively expensive.
inter-face using high-accuracy hybrid DFT calculations, in particular focussing on the electronic structure and the nature of electron transfer in this system. To do this, we choose a range-separated screened-exchange HSE06 functional,70,71which gives accurate values of band gaps
and defect states in TiO2 and other transition metal oxides.66,72 To mitigate the diculty
of optimisation of large composite cells, we use a two-step procedure and perform opti-misation using very ecient CP2K software73 at the Γ k-point, followed by high-accuracy
calculations of the electronic structure at a dense k-point grid using CRYSTAL14 software.74
The manuscript is organised as follows. After outlining the computational methods used, we discuss the construction of the composite rutile (110)-graphene cell. Then, we explore the eect of strain (arising from lattice mismatch) on the electronic properties of graphene. After that, we explore the structure and interaction of the rutile (110)-graphene interface, followed by the analysis of the electronic structure of this interface. Finally, these properties are summarised and the charge transfer capabilities are discussed in the context of this work and the wider literature.
Computational Methodology
Computational Methods
All geometry optimisations and binding energy analyses were carried out using the QUICK-STEP program,73 within the CP2K sofware package. All pure DFT calculations used the
PBE75 exchange-correlation functional, with empirical Grimme D276 dispersion correction
included. The calculations utilised Goedecker-Teter-Hutter pseudopotentials77 and
double-zeta basis sets with diuse and polarisation functions, which have been optimised for use in CP2K.78 The vacuum space between graphene and the bottom of the periodic image of
the TiO2 slab was 19.5 Å. All atom positions were fully relaxed, similar to the previous studies of TiO27982 and TiO
2/graphene interfaces.4547 An alternative would be to x the
e.g. in Ref.,83 to avoid changes in the electronic structure due to xed undercoordinated
atoms. Basis set superposition error (BSSE) in calculations of binding energies was cor-rected using the counterpoise method.84 For all hybrid DFT calculations the HSE0670,71
range-separated exchange-correlation functional was used, in addition to the Auxiliary Den-sity Matrix Method (ADMM),85featured in the CP2K software package. In such calculations
Hartree-Fock exchange is computed with a much smaller auxiliary basis set, while the pri-mary basis set (carried over from PBE-level calculations in this instance) is used in the non-HF exchange part of the functional. The auxiliary basis set cpFIT3 (contracted, 3 gaus-sian exponents per valence orbital, includes polarisation d-functions) was used for carbon and oxygen, while FIT11 (4 s, 3 p, and 3 d shells and 1 f shell in total) was used for tita-nium. An example of the input le with the settings used in this study is provided in the Supporting Information (SI).
The optimised coordinates obtained in CP2K HSE06 calculations were then used as input for calculations with a ne k-point grid using the CRYSTAL14 software package.74
All density of states, band structure, and graphene strain test calculations were carried out using CRYSTAL14. For calculations of properties of the rutile (110)/graphene interface a Monkhorst-Pack k-point mesh of12×12×1was used. For the graphene strain tests a denser k-point mesh of16×16×1was used. Band structures of graphene were calculated with 1800 points along the path, and band structures of the TiO2/graphene composite with 300 points along the path. The DFT functional used for graphene strain tests was PBE (in line with the recent computational studies of graphene8689), and the hybrid DFT functional used for
TiO2-graphene calculations was HSE06. Empirical Grimme D2 dispersion corrections were added in all CRYSTAL14 calculations. All these calculations used all-electron triple-zeta basis sets with polarisation functions from the work of M. Peintinger et al.90 The height of
from each band energy.
Unit Cell Construction
To construct the unit cell of the rutile (110)/graphene composite, the lowest common mul-tiples of the cell parameters of rutile (110) compared to graphene need to be found. The rutile (110) unit cell has a rectangular shape (see Figure 1), with cell parametersA= 6.529 Å andB = 2.995 Å (obtained from our CP2K PBE calculations of bulk rutile, see SI Secion S1 for details). Graphene was represented with an orthorhombic unit cell for ease of tting with rutile (110) (see Figure 1), with the lattice parameters dened from the experimental value of the graphene carbon-carbon bond length (1.42 Å).
Graphene Cell (Orthorhombic) A = 4.254 Å
B = 2.46 Å
Rutile (110) Surface A = 6.529 Å B = 2.995 Å
Rutile (110)/Graphene System Construction
3x6 Replicated Unit Cell
2x5 Replicated Unit Cell Composite
Unit Cell
Resulting applied strain to graphene: ΔA = 2.27%
ΔB = 1.44% A = 13.058 Å B = 14.975 Å
[image:9.612.134.460.352.560.2]Armchair Line Zig-Zag Line
Figure 1: Construction of the composite rutile (110)/graphene unit cell used in this research
It was found that the best compromise of system size with commensurability was to t a
3×6(armchair× zigzag) supercell of graphene with a2×5supercell of rutile (110), where
was used a previous DFT+U study of the rutile (110)-graphene interface.41 This smallest
commensurate unit cell, if used with a thin 6 atomic layer rutile (110) slab (two unit-cell layers), has a total of 192 atoms (40 TiO2 units and 72 carbon atoms); the 9 atomic layer (three unit-cell layers) rutile (110) slab results in a 252-atom cell; both were used in this work.
An alternative UC of the composite was also considered, where the zigzag line of graphene runs parallel to the A cell vector of rutile (110). Here the smallest identied commensurate unit cell (commensurate dened here as having mismatch under 5%) comprised of an8×5 supercell of graphene with a 3 × 7 supercell of rutile (110), this resulted in an applied compressive strain of -1.43% and -0.47% to the armchair and zigzag graphene directions, respectively. This composite UC, containing a total of 412 atoms with a 6 atomic layer slab of rutile (110), was constructed to investigate the eect of orientation of graphene relative to rutile (110) on the physical properties of the interface. The structure (interfacial C-O distances) and interfacial interaction energies (described in the next section) were very similar to the smaller cell described above and in Figure 1, therefore this larger cell was not investigated further.
Larger composite unit cells with smaller lattice mismatch can be constructed (see SI Section S1: Tables S1-S6 and Figure S1 for details), but their cell sizes become too large for practical use, and improvements in quality are expected to be minimal.
Results and Discussion
Eects of Lattice Strain on Graphene
The fact that the two crystal systems are non-commensurate leads to lattice mismatch and applied compressive or tensile strain at the interface. This issue is encountered e.g. in epitaxial lms and interfaces,91,92which often have strong chemical bonding at the interfaces,
construct nite-size cells.93 Due to the greater geometric exibility of graphene relative to
rutile, the nal lattice parameters are chosen to t the rutile (110) component, forcing graphene to be deformed. This may change the electronic properties of graphene in such interfaces, compared to isolated graphene. Thus far, computational studies of the TiO2 -graphene interfaces have not explored the structural and electronic eects that this applied strain may have on the graphene component of the system.
The eect of strain was, however, explored in fundamental studies of pristine graphene. While some studies indicated that an applied tensile deformation of 1% to the graphene lattice was sucient to introduce a band gap,86,94 further investigations8789,9597 instead
showed that the observed band gap opening in graphene was due to the migration of the Dirac point (where the band structure of graphene moves from insulating to metallic) from its original position at the high symmetry k-point `K', as a direct consequence of the change in lattice symmetry. It was found that the applied deformation required to introduce a band gap in graphene is at least 26.5% for uniaxial tensile strain (only in the zigzag direction);95,96
the gap can also be opened by anisotropic biaxial strain combining tension (11% in the zigzag direction) and compression (-20% in the armchair direction).89Notably, these levels of strain
are quite close to the predicted98,99 and measured100 failure strain of graphene, 20−25%.
While these levels of strain are much higher than those encountered in our composite cell, we will set out to explore the eect of low levels of strain on the electronic properties of graphene.
In this work lattice deformation was applied to the orthorhombic graphene cell in the zigzag and armchair directions, up to±6% strain in steps of 1% relative to the fully optimised cell. In addition, much larger strain values of up to ±30% (i.e. up to the predicted strains for gap opening95,96 and for graphene's mechanical failure98100) in steps of 5% were also
Figure 2: Eect of strain on the physical properties of graphene. Top row: change in the calculated band gap; middle row: total energy relative to the fully optimised orthorhombic graphene, bottom row: shift of the Fermi level compared to the unstrained graphene. Left column: strain is applied along the armchair direction: right column: strain is applied along the zigzag direction.
the SI).
[image:12.612.74.540.69.401.2]15 10 5 0 5 E ne rg y/ e V
S Y Γ X S Efermi
(a) Optimised Graphene
15 10 5 0 5 E ne rg y/ e V
S Y Γ X S Efermi
(b) 6% ZigZag strain
15 10 5 0 5 E ne rg y/ e V
S Y Γ X S Efermi
[image:13.612.84.535.74.182.2](c) 6% Armchair Strain
Figure 3: Band structures of orthorhombic graphene cells: optimised (a), 6% zigzag tensile strain (b), and 6% armchair tensile strain (c). Occupied bands are represented in blue, unoccupied bands are in red, and the dashed line represents the Fermi level. Slight changes in the band shapes and a migration of the Dirac point along the Γ-X line can be seen.
directions. Only at the highest tested level of strain, 30% stretching in the zigzag direction, the Dirac point disappears and a band gap can be observed, which agrees with literature observations.89,95,96
As an additional test of accuracy of our graphene electronic structure, the Fermi velocity
vF was calculated for the unstrained and +6% stretched (armchair and zigzag direction)
graphene: the vF values were 1.54×10⁶ m s−1, 1.57×10⁶ m s−1 and 1.30×10⁶ m s−1, respectively. These values are in good agreement with the experimentally measured range
(1.15−2.49)×106 m s−1 (where the variation depends on the substrate where graphene was
deposited)101 and with theoretical values: (0.85−0.9)×106 m s−1 (LDA calculations)101,102 and(1.0−1.25)×106 m s−1(GW calculations);102 the trend in our values ofvF is also in good agreement with recent calculations103 which reported a slight increase and a decrease upon
stretching in the armchair and zigzag direction, respectively. These results give additional conrmation that our modelling of graphene band structure is reliable.
eV) for the rst ±6% of applied strain, but becomes larger for hypothetical large applied strain (Figure 2 and Table S7). Any shift in band energies will therefore have a direct impact on where the valence band of graphene lies in relation to rutile (110), and at large strains it may aect the predicted transfer of charge across the interface.
In conclusion, we have demonstrated that the small applied strain on the graphene com-ponent in our composite system will not disrupt the semimetallic properties of graphene in the system, nor will it have a signicant eect on its band positions.
Binding Properties of the TiO
2/Graphene Interface
To investigate the physical properties of the TiO2/graphene composite system, the interlayer spacing, and interface interaction energies and binding energies were calculated using CP2K with the PBE + D method. For this work the interlayer spacing is determined as the vertical (z-axis) distance, in Ångströms, between the uppermost atomic layer of two-coordinated oxygen atoms of rutile (110) and the graphene layer. The interface interaction energy is dened as:
Eint=Etot−Eru−opt−Egr−opt+EBSSE (1)
whereEint is the interaction energy,Etot is the computed total energy of the system,Eru−opt is the total energy of the optimised rutile (110) slab, Egr−opt is the total energy of the optimised graphene sheet, and EBSSE is the basis set superposition error correction. The interaction energy can be decomposed into the deformation energy Edef (the energy change when deforming the TiO2 and graphene components upon formation of the composite struc-ture) and the binding energy Ebind (the energy gain due to the binding of these deformed components, or, the interaction energy excluding the change due to deformation) dened as:
Edef = (Eru−def −Eru−opt) + (Egr−def−Egr−opt) (3)
where Eru−def and Egr−def are, respectively, the energies of the rutile (110) and graphene components in the geometry of the composite system. Interaction and binding energies and interlayer spacing for our system and a few reference systems are provided in Table S8. The interaction energies calculated in this work (−0.019to −0.023 eV per carbon atom and
−1.35to−1.67eV per cell) are very similar to the literature values for the same rutile
(110)-graphene interface obtained using a dierent method (LDA+U).41 These weak interaction
energies indicate physisorption. Dispersion is the principal mechanism of the interaction, e.g. in the system with the 9-layer TiO2 slab, dispersion contributes−3.13eV to the binding energy of −3.24 eV. The alternative orientation of graphene above rutile, where the zigzag line of graphene is parallel to the A cell vector of rutile (110), results in very similar energies per carbon atom, conrming that interaction energies are very weakly dependent on the interfacial orientation, as expected for physisorption. Therefore the selected orientation of graphene above TiO2 is representative of the properties of the many possible random orientations which may occur in experimental TiO2/graphene composites.
Comparing our interface interaction energies (scaled per carbon atom) to the literature values for the anatase (101)-graphene interface (−0.032 to−0.050 eV per carbon atom),44,50 the rutile (110)-based system is less strongly bound, probably because fewer atoms in the rutile (110) surface are close enough to graphene (only 2-coordinated surface oxygens). Com-paring the rutile (110)/graphene composite to graphite, the composite's interaction energies per carbon atom are half as small as computational and experimental values for the inter-layer binding in graphite and multiinter-layer graphene104,105 this can be expected, since the
TiO2-graphene interface does not oer π-stacking such as found in graphite.
to deformation of 0.68 and 0.83 eV/cell for the 3 and 2-layer composite systems respectively. The deformation of rutile (110) costs 0.22 and 0.89 eV in the 6- and 9-atomic-layer TiO2 slabs, respectively.
The dierence between the 6-layer and 9-layer TiO2 systems is related to the well-known oscillation of physical properties in and even-layer rutile (110) slabs: for example, odd-layer rutile (110) slabs are found to have higher surface energies than even-odd-layer slabs.7982
The results of this work are in agreement with this pattern: since the 9-layer slab has a larger surface energy, it displays a larger energy gain due to the formation of the interface with graphene, especially obvious in the binding energies which do not include deformation.
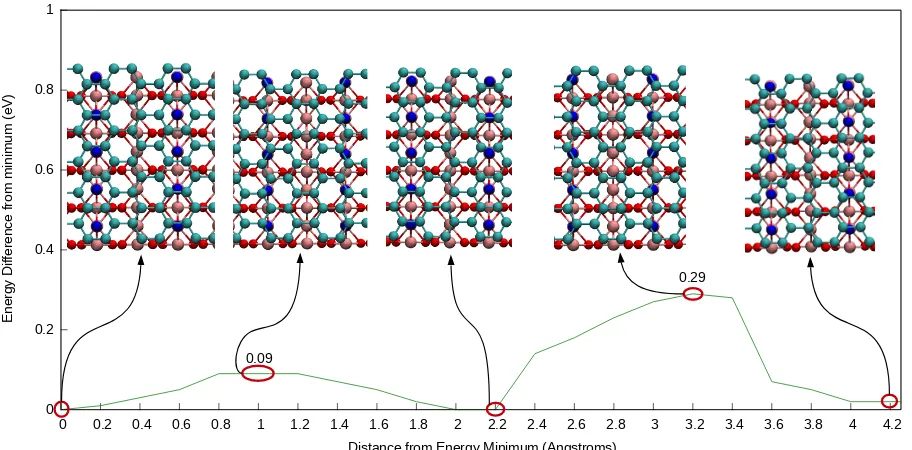
0 0.2 0.4 0.6 0.8 1
0 0.2 0.4 0.6 0.8 1 1.2 1.4 1.6 1.8 2 2.2 2.4 2.6 2.8 3 3.2 3.4 3.6 3.8 4 4.2
E ne rg y D iff er en ce fr om m in im um ( eV )
Distance from Energy Minimum (Angstroms) 0.09
[image:16.612.76.532.294.519.2]0.29
Figure 4: One-dimensional potential energy surface (PES) plot of the rutile (110)/graphene composite. Insets show the alignment of graphene carbon atoms (teal) with the surface 2-coordinated oxygen atoms (blue) at several positions (maxima and minima) of the PES.
(graphene moving along the row of 2-coordinated oxygens of TiO2), while the displacement along the A direction showed noticeable changes in energy. It can be seen in Figure 4 that the total energy increases as the carbon atoms in the graphene layer approach the 2-coordinated oxygen atoms in the rutile (110) surface layer, and is the most favourable when CC bonds in the graphene layer rest over the top of these surface oxygen atoms (see insets in Figure 4). The energies vary by up to only 0.29 eV/cell. This very small variation suggests that there is no strongly preferred position of graphene above rutile (110). Diusion along the B direction is essentially barrierless (0.03 eV) at room temperature. In the A direction, it is also easy to overcome the small barrier of 0.09 eV; the highest barrier of 0.29 eV results in the rate of approximately one movement every 10 ns (estimated using the Arrhenius equation with the prefactor of 1013 s−1). Therefore, a variety of graphene/TiO
2 positions and orientations
are likely to exist in experimental systems. Note, however, that this conclusion is true only for defect-free graphene; once oxygen functional groups are introduced to create graphene oxide, diusion is likely to be impeded.
In conclusion, we have demonstrated that the interface between rutile (110) and graphene forms through a physisorption interaction, slightly weaker than the strength of interaction in multilayer graphene. The potential energy surface for this system is largely at in shape, however, there exists a weak preference for aligning the surface 2-coordinated oxygen atoms with the mid-point of the carboncarbon bonds in the graphene layer above.
Electronic Properties of the Rutile (110)/Graphene Interface
Methods section).
D
en
si
ty
Ef
VBMTiO2 CBMTiO2
12 11 10 9 8 7 6 5 4 3 2
D
en
si
ty
[image:18.612.133.467.110.380.2]Energy/ eV
Figure 5: PDoS spectra of the 9 atomic layer rutile (110) slab (bottom) and its composite with graphene (top). The projections shown are: carbon (red), surface site 5-coordinated titanium (dark blue), surface site 6-coordinated titanium (cyan), subsurface titanium positions: below surface Ti5c (green); below surface Ti6C (purple), 2-coordinated oxygen (orange). The total DoS is shown in black. The dashed lines represent the valence and conduction bands of the isolated rutile (110) slab and the Fermi-level of the composite.
The band gaps of isolated TiO2 slabs are found to be 3.9 eV in the 6-layer system and 2.8 eV in the 9-layer system (band edges are shown with dashed lines in Figure 5 and Figure S3). This variation in the band gap values reects the odd-even slabs' oscillation of properties, characteristic of rutile (110): the band gaps are notably larger than the bulk value for even-layer slabs and smaller for odd-even-layer slabs.7982 Overall, the band gaps found in this work
are in good agreement with the value of 3.39 eV found for bulk rutile with the same HSE06 functional in Ref.63 and with the experimental values of 3.0 eV for the optical gap106 and
3.3±0.5 eV fundamental band gap107 for rutile.
system the conduction band (CB) is primarily made up of titanium states, and the valence band (VB) of oxygen states, as is known from the literature on TiO2bulk and surfaces.80,81In
the 6 atomic layer rutile (110) systems the conduction band contains both the 5-coordinated Ti (Ti5c) and 6-coordinated Ti (Ti6c) surface states in roughly equal intensities (Figure S3). In the composite system containing the 9 atomic layer rutile (110) slab, the states localised on 5-coordinated titanium atoms and subsurface titanium atoms immediately below dominate in the low-energy part of the CB. The most prominent dierence between the isolated rutile (110) slab and the composite is the shift of the surface 5-coordinated titanium atoms' states (dark blue line in Figure 5) towards the low-energy part of the CB of the composite, which conrms electronic interaction between the TiO2 surface and graphene.
8.5 8 7.5 7 6.5 6 5.5 5 4.5 4
D
en
si
ty
Energy/ eV
Ef
VBMTiO2 CBMTiO2
8.5 8 7.5 7 6.5 6 5.5 5 4.5 4
D
en
si
ty
Energy/ eV
Ef
[image:19.612.133.472.316.577.2]VBMTiO2 CBMTiO2
Figure 6: PDoS spectra of the 6 (top) and 9 (bottom) atomic layer rutile (110)/graphene composites. The projections shown are: Carbon (red), 5-coordinated titanium (dark blue), 6-coordinated titanium (cyan), subsurface titanium (green: below 5-coordinated surface site, purple: below 6-coordinated surface site), and 2-coordinated oxygen (orange). The dashed line represents the Fermi level, the solid black lines represent the valence and conduction band edges of the isolated rutile (110) slab.
band and the lowest part of the conduction band of the composite system (both located in the TiO2 band gap region) are made up mostly of graphene states. Notably, the graphene-dominated conduction band edge is ∼ 0.8 eV and ∼ 1.3 eV, in composites with the 9-and 6-atomic-layer rutile (110) slabs respectively, below the Ti-dominated high-intensity states of the conduction band (which start between −5.0 and −4.5 eV). We observe that the unoccupied states of graphene lie well below the unoccupied states of TiO2 which is in agreement with experimental work function and electron anity values, which show graphene to have a larger work function (measured as 4.5 eV108 or between 4.89 and 5.16 eV,109) compared to TiO2 (work function of rutile (110) experimentally measured as 4.2 eV;110
electron anity experimentally measured as4.3−4.4 eV111,112 and calculated as 4.7 eV112). Note that this alignment of Ti and carbon states is dierent from several recently pub-lished studies of TiO2-graphene interfaces, where the graphene conduction band edge as usually found to lie near, just below, or just above the TiO2 band edge.41,44,47,49,50 There is,
however, no agreement on the alignment of C- and Ti-based conduction band states in the published studies, and there are examples of C states being lower in energy than Ti states, similar to the results of this work, notably in graphene interfaces with anatase (001)45,48
and rutile (110).46 This dierence is likely to be caused by dierences in the electronic
prop-erties of anatase and rutile polymorphs of TiO2 (indeed, the CB of anatase is believed to be 0.2−0.4 eV below that of rutile113,114). It is also likely that the TiO2 band positions in the DFT+U calculations41,4446,48 are aected by the choice of the `U' parameter which
is applied to describe the on-site Coulomb interaction of Ti 3d electrons. We believe that hybrid functionals oer a less ambiguous description of band gaps and band positions. In particular, the HSE06 functional used in this work accurately predicts the band gaps, band positions and defect states in TiO2.63,113,115 This functional has also been successfully used
to describe optical properties of carbon nanotubes,116 band gaps of carbon nanoribbons117
and workfunctions of graphene, carbon nanoribbons and nanotubes.118,119 With this good
functional's description of the TiO2-graphene interface is also reliable.
This position of graphene-dominated states far below TiO2 states rather than just below TiO2 states has important implications for charge transfer in this composite system: it is strongly favourable for photoexcited electrons to decay to the bottom of the conduction band, i.e. to these low-lying graphene-dominated states.
The high-resolution PDoS plots (Figure 6) show a clear qualitative dierence between the composite systems involving 9-atomic-layer and 6-atomic layer TiO2 slabs. In the 6-layer-based composite, only carbon-6-layer-based states appear in the band gap of TiO2, suggesting very little electronic interaction between graphene and TiO2. By contrast, in the 9-layer-based composite, Ti-based states appear together with the carbon-based states near the bottom of the conduction band, in what would be the TiO2 band gap. This points to electronic interaction between carbon and TiO2 components, as these states are not present in the rutile component alone (see Figure 5). This mixture of titanium and carbon states in the conduction band is likely to aect the nature of charge transfer in this system. To investigate the origin of these Ti states, we plot the band structure and then explore the atomic orbitals which make up these bands.
The band structure of the 9 atomic layer composite is compared to the corresponding DoS spectrum in Figure 7. The band structure clearly shows that the Dirac point of graphene is preserved and can be seen close to the Γ point, along the Γ−Y line. The Fermi level lies
slightly below the Dirac point, indicating hole doping of graphene; this is conrmed by the electron density dierence plot (Figure S4 in the SI), which shows some electron transfer from graphene to TiO2. The amount of charge transferred has been evaluated as 0.68 electrons per cell (or 0.01 electrons per carbon atom), which is comparable to 0.02 electrons per carbon found for the similar system in Ref.41 The downshift of the Fermi level (0.42 eV) is slightly
8.5
8
7.5
7
6.5
6
5.5
5
4.5
E
ne
rg
y
(e
V
)
E
fermiS
Y
Γ
X
S
[image:22.612.79.519.82.373.2]Mainly Titanium States Mainly Graphene States Mixed Graphene/ Titanium States Mainly Titanium States 70 0 nm 55 0 nm 35 0 nm
Figure 7: Band structure of the 9 atomic layer rutile (110)/graphene composite system, showing 10 occupied bands (shown in blue) and 10 unoccupied bands (in red). The PDoS spectrum of this interface is shown to the left, with the total DoS included in black, and guide-lines relating parts of the DoS spectrum to the band structure. Additional annotations show the energies of possible electronic transitions and the composition of various regions of the band structure (assigned according to the analysis shown in Figure 8)
that the electronic structure of TiO2 and graphene remain essentially intact in the composite system. Although the Dirac point has not been captured in our DoS plots (Figure 6 and S3), it is clearly present in the band structure. The apparent band gap in the DoS, similar to the small44,46,47 or very small50 band gaps observed in some of the previous studies of
TiO2/graphene interfaces, has likely been caused by the use of insuciently dense k-point grids, similar to the early studies of strained isolated graphene alone.86,94 The absence of a
The question still remains about the origin of Ti-based states in the region corresponding to the band gap of pure TiO2. These states do not correspond to any special points in the conduction band (see Figure 7). The DoS plots in Figure 6 show that these states are localised on subsurface (bulk-like) Ti atoms of the 9 atomic layer rutile slab. The 6 atomic layer slab, which has no bulk-like Ti atoms, has no such gap states. This shows that subsurface Ti atoms are essential for strong electronic interaction between TiO2 and graphene and that the 6 atomic layer slab, which has no subsurface atoms, is too small to model the rutile-graphene interface. The narrower band gap of the odd-layer rutile slab also brings the conduction band edge closer to the highest occupied band of graphene, facilitating the electronic interaction between graphene and TiO2 (in agreement with the larger binding energy of graphene with the 9 atomic layer rutile slab). The localisation on subsurface Ti atoms is in qualitative agreement with the LDA+U study of Du et al.,41 which showed that the rst two CB states
are predominantly based on graphene and subsurface Ti atoms below surface Ti5c. This important role of the subsurface Ti atoms in the TiO2 rutile (110)/graphene interaction is likely related to the tendency of excess electrons in rutile (110) slabs to localise at subsurface Ti sites.120,121 Since there is some charge transfer from graphene to TiO
2 in the ground
state (as shown above), these subsurface Ti atoms are the most likely sites to accommodate this excess charge, and thus the presence of even one subsurface layer enhances the rutile (110)/graphene interlayer binding.
From these results one can see that, in order to correctly model the properties of this composite system, at least one subsurface layer of rutile (110) must be present. Thus the 9-layer rutile (110) slab is the smallest slab sucient to describe this system, and we expect that thicker rutile (110) slabs will behave qualitatively similar.
to give the contributions of Ti, O and C to each eigenstate at each k-point: P
cc∗T i,j,k,
P
cc∗O,j,k and P
cc∗C,j,k. The analysis of the AO coecients at the k-points along the band
structure path (Figure 8) conrms that the highest occupied band (labelled VBM) as a whole consists mainly of carbon states. Similarly, the 3 highest energy VBs consist entirely of carbon states, and titanium and oxygen states begin to emerge at the VBM-4 and lower (energy -8.3 eV and below in Figure 7). The lowest unoccupied band (labelled CBM) around the Γ-point, and along most of the Γ-X and Γ-Y lines, consists mainly of carbon states, while at and around k-points X, Y, and S it is predominantly titanium. These rutile titanium bands can be identied easily by their characteristically at proles they are essentially the same as lowest-energy unoccupied bands of isolated rutile (also seen as intense peaks in the DoS, starting at ∼ −5.0eV, see Figure 5 and Figure 6).
The band lines in Figure 7 and Figure 8 look smooth and do not reect the sharp Ti peaks seen near the bottom of the CB in the DoS. However, the band structure is plotted along special high-symmetry lines in the Brillouin zone (BZ), while the DoS is calculated by integrating over the whole BZ. To explain the DoS shape, we analysed atomic orbital coecients of the highest occupied and two lowest unoccupied states across the full BZ. The contributions by atom type (P
cc∗
T i,j,k, Pcc∗O,j,k and
P
cc∗C,j,k) were calculated for VBM,
CBM and CBM+1 on the 12×12×1grid of k-points covering the whole BZ (the same grid as used in the DOS calculations).
7.5 7 6.5 6 5.5 5 C oe ff ic ie nt V al ue E ne rg y (e V ) KPoint CBM +1
S Y Γ X S
Titanium Oxygen Carbon Band Energy 7.5 7 6.5 6 5.5 5 C oe ff ic ie nt V al ue E ne rg y (e V ) KPoint VBM
S Y Γ X S
7.5 7 6.5 6 5.5 5 C oe ff ic ie nt V al ue E ne rg y (e V ) KPoint CBM
S Y Γ X S
7.5 7 6.5 6 5.5 5 C oe ff ic ie nt V al ue E ne rg y (e V ) KPoint VBM 1
[image:25.612.121.482.84.448.2]S Y Γ X S
Figure 8: Energies of selected bands (VBM-1, VBM, CBM, CBM+1), plotted together with the sums of squared atomic orbital coecients for all titanium, oxygen, and carbon species in the 9 atomic layer composite system. These data points cover all k-points in the path chosen for the band structure in Figure 7
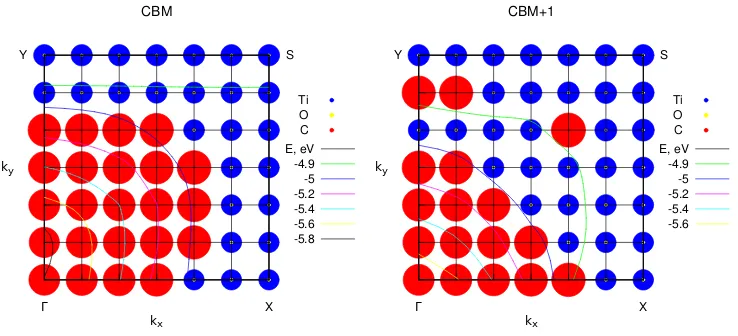
Y Ti O C Γ X S CBM E, eV -4.9 -5 -5.2 -5.4 -5.6 -5.8 kx ky Y Ti O C Γ X S CBM+1 E, eV -4.9 -5 -5.2 -5.4 -5.6 kx ky
Figure 9: Sums of squared atomic orbital coecients (shown as circles) for all titanium, oxygen, and carbon species in the 9 atomic layer composite system, plotted in the irreducible part of the Brillouin zone of the rutile (110)/graphene composite system. The areas of the circles correlate with the magnitude of each atomic species' contribution to the eigenstate (CBM or CBM+1) at each k-point (blue circles for Ti, yellow for O, red for C). The variation of these bands' energies across the BZ is shown with thin contour lines.
are no mixed states equally made up of C and Ti at any of the points in the BZ in this region; there is clear separation between C-dominated and Ti-dominated states.
Applying this analysis of atomic orbitals to the DoS plot in Figure 6 and Figure 7, it becomes clear that the carbon contributions in the low-energy region of the CB (−6.0 to
−5.0 eV) come from both the rst and the second unoccupied bands, while the titanium
contributions come only from the second unoccupied band, at certain points in the BZ. The observation that Ti states contribute at some rather than all points in the BZ explains why the Ti states appear as spikes rather than as a smooth band in the DoS. This appearance of Ti states alongside C states in the graphene-like lower part of the CB is an indication of elec-tronic interaction between graphene and rutile (110) - notably, interaction with subsurface (bulk-like) Ti atoms.
From this analysis of the electronic structure, and from the evidence in published re-search,38,39,41 it is now possible to infer more details about the mechanism of
band structure, and atomic orbital coecient analysis enable us to make predictions about the likely nature of photoexcitation transitions in the TiO2-graphene system. We note that a calculation of transition dipole moments and electronic excitations would be necessary for a full description of photoexcitation processes. This is beyond the scope of the current work, however, a qualitative picture of photoexcitation can be obtained from our DoS and atomic orbital data. Our data suggest that the mechanism of photoexcitation will dier depending on the energy of a given incident photon. For a visible-region photon (2.51.5 eV, some possible transitions shown schematically by red and green arrows in Figure 7), electronic transitions must originate from a carbon state within graphene. The excited state reached by the transition may then be either carbon- or titanium-based depending upon the photon energy. Very low-energy photons can excite only carbon π to π* electronic transitions (i.e. no charge transfer). Visible-light photons can span the band gap further away from the Γ point and nearer the points X and Y, where titanium states begin to appear in the unoccu-pied states. Then, these titanium states may accept the photoexcited electron, resulting in graphene → TiO2 transition (although the intensity of this transition is likely to be lower
than that of the graphene→graphene transition, because the charge transfer excitation has
smaller transition matrix elements due to small overlap of the wavefunction).
Thus, the experimentally observed broadening of the absorption range of the TiO2 com-posites22,24,30,3237 is attributed to the presence of these mixed graphene and titanium states.
Transfer of photoinduced electrons to TiO2 creates an ecient photoreduction catalyst.16,20
Note however, that the lowest-energy unoccupied states are all graphene-based (both at the bottom of the conduction band and just above the Fermi level), therefore the thermody-namically favourable process is for the photoexcited electrons to eventually decay to these lowest-energy unoccupied carbon states. Thus, photoexcited charge transfer from graphene to TiO2 is likely to be only a transient phenomenon (cf. a recent experimental study122
for example, in photocatalytic reactions. Similarly, if an electron is supplied from elsewhere (e.g. using molecular sensitisers123), it will most likely end up in these graphene-based
lowest-occupied carbon states. Both processes make graphene the electron-rich part of the composite, so that it may act as an electron shuttle in complex photocatalyst architectures, as proposed by Kamat.40 It is also those electrons in the lowest-energy unoccupied carbon
states which are then likely to recombine with holes in the valence band.
Photons in the ultraviolet range (>3.0 eV) are able to excite transitions that originate from deeper levels in the lower VBs, which are localised on TiO2. The accepting states are likely to be mixed graphene/titanium or purely titanium based, thus the overall direction of the charge transfer in this case is from TiO2 to graphene, as observed in many UV-Vis experiments.38,42
In all cases that we have discussed, the nal states reached by photoexcitations are likely to involve both carbon- and titanium-based states. The direct carbon π to π* electronic excitations are likely to be more intense than charge-transfer carbon→ TiO2 excitations39,41
even if the energy of the excitation is the same. These carbon π toπ* excitations, however, can be followed by excited-state charge injection to same-energy titanium-based states, as observed by Manga et al42 and described computationally by Long et al.43 Experimental
data showing the visible-region photon absorption enhancement provided by graphene in this system38,39 support this model of a combination of direct (e.g. carbon π −π*) and
charge-transfer excitations.
Conclusions
small compressive and tensile strain on graphene from the mismatch results in only small increase in total energy and negligible opening of the band gap (up to 0.01 eV) in the case of mismatches of 6% or fewer, and shows that the lattice mismatch of our chosen system (1.4-2.3 %) is small enough to have no eect on the electronic properties of graphene. The interfacial interaction and binding energies have been calculated for both 6 and 9 atomic layer composites, which show that the interaction strength is noticeably greater for the 9 atomic layer system than the 6-atomic layer system. For the 9 atomic layer system specically, the calculated interaction energy per carbon atom (-0.045 eV/atom) is comparable to that of graphite.104
Separation of photoinduced charges is one of the most benecial properties of TiO2 -graphene composte photocatalysts: thanks to this separation of charges, electron-hole recom-bination is greatly reduced, resulting in long-lived electrons and holes. We inverstigate the nature of charge separation in this composite by analysing the density of states, band struc-ture and orbital composition of this material. We show that the lowest unoccupied states of these composites are dominated by graphene, therefore after relaxation (but before decaying to the valence band) photoexcited electrons are likely to end up in the graphene compo-nent. Our analysis of the electronic structure of the TiO2-graphene composites elucidates how dierent wavelengths of photons are likely to result in dierent types of photoinduced charge separation. For example, visible light photons are likely to induce electron excitations from entirely carbon-based states (top of the VB) to both C- and Ti-based states (overall photoinduced electron transfer graphene → TiO2), while UV photons may produce
excita-tions from Ti-based states (deeper in the VB) again to both C- and Ti-based states (overall photoinduced electron transfer TiO2→graphene). Thus, photoexcitations with the dierent
charge-transfer characters are possible, depending on the excitation wavelength. However, both types of photoexcitations produce charge-transfer states, thus creating electron-rich and hole-rich materials for photocatalytic reduction and oxidation.
self-interaction energy present in pure DFT functionals is important for the accurate sim-ulation of this composite's electronic properties. The application of modern computational techniques and supercomputing resources in this research has shown that hybrid HF/DFT level calculations are possible on a large system such as this interface.
Finally, it should be noted that this work focussed entirely on composites formed by pristine graphene. As many experimental systems are synthesised from graphene oxide,29
the realistic composite may contain a number of oxygen functional groups, such as epoxy, hydroxyl and carboxyl,33 which may form bridges between graphene and titanium dioxide
and have been suggested as an important contributor to electron transfer between TiO2 and graphene.47,50,60 Therefore one of our future directions will be to investigate the dierence
between pristine graphene and graphene oxide in terms of the composition of occupied and unoccupied bands and the direction of charge transfer.
Supporting Information Available
The following les are available free of charge. Construction of commensurate unit cells; strain testing data; additional band structures of strained graphene; interaction energy data; density of states spectra; charge density dierence images; band structures of isolated TiO2 and graphene; an example of the input le used for the 9-atomic layer rutile (110)/graphene composite system.
Acknowledgement
(EP/L000202). We thank M. Watkins (University of Lincoln) and I. Bethune (Edinburgh Parallel Computing Centre, EPCC) and the CP2K-UK project (EPSRC EP/K038583/1) for assistance installing an optimised version of the CP2K software on the Iceberg cluster.
Notes
The authors declare no competing nancial interest
References
(1) Higheld, J. Advances and Recent Trends in Heterogeneous Photo(Electro)-Catalysis for Solar Fuels and Chemicals. Molecules 2015, 20, 67396793.
(2) Etacheri, V.; Di Valentin, C.; Schneider, J.; Bahnemann, D.; Pillai, S. C. Visible-Light Activation of TiO2 Photocatalysts: Advances in Theory and Experiments. J. Photochem. Photobiol. C 2015, 25, 129.
(3) Maeda, K. Z-Scheme Water Splitting Using Two Dierent Semiconductor Photocata-lysts. ACS Catal. 2013, 3, 14861503.
(4) Teoh, W. Y.; Scott, J. A.; Amal, R. Progress in Heterogeneous Photocatalysis: From Classical Radical Chemistry to Engineering Nanomaterials and Solar Reactors. J. Phys. Chem. Lett. 2012, 3, 629639.
(5) Chen, X.; Shen, S.; Guo, L.; Mao, S. S. Semiconductor-based Photocatalytic Hydrogen Generation. Chem. Rev. 2010, 110, 65036570.
(6) Kudo, A.; Miseki, Y. Heterogeneous Photocatalyst Materials for Water Splitting. Chem. Soc. Rev. 2009, 38, 253278.
(8) Liu, Z.; Bai, H.; Sun, D. Facile Fabrication of Hierarchical Porous TiO2 Hollow Mi-crospheres with High Photocatalytic Activity for Water Purication. Appl. Catal. B 2011, 104, 234238.
(9) Wang, B.; Li, C.; Cui, H.; Zhang, J.; Zhai, J.; Li, Q. Shifting Mechanisms in the Initial Stage of Dye Photodegradation by Hollow TiO2 Nanospheres. J. Mat. Sci. 2013, 49, 13361344.
(10) Lee, S. S.; Bai, H.; Liu, Z.; Sun, D. D. Novel-Structured Electrospun TiO2/CuO Composite Nanobers for High Ecient Photocatalytic Cogeneration of Clean Water and Energy from Dye Wastewater. Water research 2013, 47, 40594073.
(11) Song, H.; Chen, T.; Sun, Y.-l.; Zhang, X.-Q.; Jia, X.-h. Controlled Synthesis of Porous Flower-Like TiO2 Nanostructure with Enhanced Photocatalytic Activity. Ceramics International 2014, 40, 1101511022.
(12) Yang, R.; Yang, L.; Tao, T.; Ma, F.; Xu, M.; Zhang, Z. Contrastive Study of Struc-ture and Photocatalytic Performance with Three-Dimensionally Ordered Macroporous CuO-TiO2 and CuO/TiO2. Appl. Surf. Sci. 2014, 288, 363368.
(13) Zhang, N.; Yang, M.-Q.; Liu, S.; Sun, Y.; Xu, Y.-J. Waltzing with the Versatile Platform of Graphene to Synthesize Composite Photocatalysts. Chem. Rev. 2015, 115, 1030710377.
(14) Kapilashrami, M.; Zhang, Y.; Liu, Y.-S.; Hagfeldt, A.; Guo, J. Probing the Opti-cal Property and Electronic Structure of TiO2 Nanomaterials for Renewable Energy Applications. Chem. Rev. 2014, 114, 96629707.
(16) Reddy, K. R.; Hassan, M.; Gomes, V. G. Hybrid Nanostructures based on Titanium Dioxide for Enhanced Photocatalysis. Appl. Catal. A 2015, 489, 116.
(17) Li, J.; Wu, N. Semiconductor-based Photocatalysts and Photoelectrochemical Cells for Solar Fuel Generation: a Review. Catal. Sci. Technol. 2015, 5, 13601384.
(18) Kumar, S. G.; Devi, L. G. Review on Modied TiO2 Photocatalysis under UV/Visible Light: Selected Results and Related Mechanisms on Interfacial Charge Carrier Trans-fer Dynamics. J. Phys. Chem. A 2011, 115, 1321113241.
(19) Pinaud, B. A.; Benck, J. D.; Seitz, L. C.; Forman, A. J.; Chen, Z.; Deutsch, T. G.; James, B. D.; Baum, K. N.; Baum, G. N.; Ardo, S. et al. Technical and Economic Feasibility of Centralized Facilities for Solar Hydrogen Production via Photocatalysis and Photoelectrochemistry. Ener. & Env. Sci 2013, 6, 19832002.
(20) Xiang, Q.; Yu, J.; Jaroniec, M. Graphene-based Semiconductor Photocatalysts. Chem. Soc. Rev. 2012, 41, 782796.
(21) Leary, R.; Westwood, A. Carbonaceous Nanomaterials for the Enhancement of TiO2 Photocatalysis. Carbon 2011, 49, 741772.
(22) Khan, G.; Choi, S. K.; Kim, S.; Lim, S. K.; Jang, J. S.; Park, H. Carbon Nanotubes as an Auxiliary Catalyst in Heterojunction Photocatalysis for Solar Hydrogen. Appl. Catal. B 2013, 142-143, 647653.
(23) Zhang, J.; Zhu, Z.; Tang, Y.; Feng, X. Graphene encapsulated hollow TiO2 nanospheres: ecient synthesis and enhanced photocatalytic activity. Journal of Ma-terials Chemistry A 2013, 1, 37523756.
Multiwalled Carbon Nanotubes Drive the Activity of Metal@Oxide Core-Shell Cata-lysts in Modular Nanocomposites. J. Am. Chem. Soc. 2012, 134, 117606.
(25) Woan, K.; Pyrgiotakis, G.; Sigmund, W. Photocatalytic Carbon-Nanotube-TiO2 Com-posites. Adv. Mat. 2009, 21, 22332239.
(26) Jitianu, A.; Cacciaguerra, T.; Benoit, R.; Delpeux, S.; Béguin, F.; Bonnamy, S. Synthe-sis and Characterization of Carbon Nanotubes-TiO2 Nanocomposites. Carbon 2004, 42, 11471151.
(27) Vincent, P.; Brioude, A.; Journet, C.; Rabaste, S.; Purcell, S.; Le Brusq, J.; Plenet, J. Inclusion of Carbon Nanotubes in a TiO2 Sol-Gel Matrix. J. Non-Cryst. Solids 2002, 311, 130137.
(28) Iijima, S. Helical Microtubules of Graphitic Carbon. Nature 1991, 354, 5658.
(29) Williams, G.; Seger, B.; Kamat, P. V. TiO2-Graphene Nanocomposites. UV-Assisted Photocatalytic Reduction of Graphene Oxide. ACS Nano 2008, 2, 14871491.
(30) Shao, P.; Tian, J.; Shi, W.; Gao, S.; Cui, F. Eco-Friendly One-Pot Synthesis of Ul-tradispersed TiO2 Nanocrystals/Graphene Nanocomposites with High Photocatalytic Activity for Dye Degradation. J. Mater. Chem. A 2015, 3, 1991319919.
(31) Yang, M. Q.; Xu, Y. J. Basic Principles for Observing the Photosensitizer Role of Graphene in the Graphene-Semiconductor Composite Photocatalyst from a Case Study on Graphene-ZnO. J. Phys. Chem. C 2013, 117, 2172421734.
(32) Sha, J.; Zhao, N.; Liu, E.; Shi, C.; He, C.; Li, J. In Situ Synthesis of Ultrathin 2-D TiO2 with High Energy Facets on Graphene Oxide for Enhancing Photocatalytic Activity. Carbon 2014, 68, 352359.
the Synthesis of Photocatalytically Active Graphene-TiO2 Composites. Appl. Catal. B 2014, 158-159, 329340.
(34) Yang, M.-Q.; Zhang, N.; Xu, Y.-J. Synthesis of Fullerene-, Carbon Nanotube-, and Graphene-TiO2 Nanocomposite Photocatalysts for Selective Oxidation: A Compara-tive Study. ACS Appl. Mat. & Interfaces 2013, 5, 11561164.
(35) Perera, S. D.; Mariano, R. G.; Vu, K.; Nour, N.; Seitz, O.; Chabal, Y.; Balkus, K. J. Hydrothermal Synthesis of Graphene-TiO2Nanotube Composites with Enhanced Pho-tocatalytic Activity. ACS Catal. 2012, 2, 949956.
(36) Fan, W.; Lai, Q.; Zhang, Q.; Wang, Y. Nanocomposites of TiO2 and Reduced Graphene Oxide as Ecient Photocatalysts for Hydrogen Evolution. J. Phys. Chem. C 2011, 115, 1069410701.
(37) Zhang, H.; Lv, X.; Li, Y.; Wang, Y.; Li, J. P25-Graphene Composite as a High Performance Photocatalyst. ACS Nano 2010, 4, 380386.
(38) Pastrana-Martínez, L. M.; Morales-Torres, S.; Likodimos, V.; Figueiredo, J. L.; Faria, J. L.; Falaras, P.; Silva, A. M. T. Advanced Nanostructured Photocatalysts based on Reduced Graphene Oxide-TiO2 Composites for Degradation of Diphenhy-dramine Pharmaceutical and Methyl Orange Dye. Appl. Catal. B 2012, 123-124, 241256.
(39) Liang, Y. T.; Vijayan, B. K.; Lyandres, O.; Gray, K. A.; Hersam, M. C. Eect of Dimensionality on the Photocatalytic Behavior of Carbon-Titania Nanosheet Com-posites: Charge Transfer at Nanomaterial Interfaces. J. Phys. Chem. Lett. 2012, 3, 17601765.
(41) Du, A.; Ng, Y. H.; Bell, N. J.; Zhu, Z.; Amal, R.; Smith, S. C. Hybrid Graphene/Titania Nanocomposite: Interface Charge Transfer, Hole Doping, and Sen-sitization for Visible Light Response. J. Phys. Chem. Lett. 2011, 2, 894899.
(42) Manga, K. K.; Zhou, Y.; Yan, Y.; Loh, K. P. Multilayer Hybrid Films Consisting of Alternating Graphene and Titania Nanosheets with Ultrafast Electron Transfer and Photoconversion Properties. Adv. Func. Mater. 2009, 19, 36383643.
(43) Long, R.; English, N. J.; Prezhdo, O. V. Photo-Induced Charge Separation across the Graphene-TiO2 Interface Is Faster than Energy Losses: A Time-Domain ab Initio Analysis. J. Am. Chem. Soc. 2012, 134, 1423814248.
(44) Li, X.; Gao, H.; Liu, G. A LDA+U Study of the Hybrid Graphene/Anatase TiO2 Nanocomposites: Interfacial Properties and Visible Light Response. Comp. Theor. Chem. 2013, 1025, 3034.
(45) Masuda, Y.; Giorgi, G.; Yamashita, K. DFT Study of Anatase-Derived TiO2 Nanosheets/Graphene Hybrid Materials. Phys. Stat. Solidi B 2014, 251, 14711479.
(46) Zhou, C.; Zhao, X. Eects of Interfacial Structure and Polarity on Charge Transfer Between Carbonaceous Nanomaterials and Rutile (110) Surface. Comp. Mater. Sci. 2013, 69, 180185.
(47) Yang, N.; Liu, Y.; Wen, H.; Tang, Z.; Zhao, H.; Li, Y.; Wang, D. Photocatalytic Properties of Graphdiyne and Graphene Modied TiO2: From Theory to Experiment. ACS Nano 2013, 7, 15041512.
(49) Qian, W.; Greaney, P. A.; Fowler, S.; Chiu, S.-K.; Goforth, A. M.; Jiao, J. Low-Temperature Nitrogen Doping in Ammonia Solution for Production of N-Doped TiO2 -Hybridized Graphene as a Highly Ecient Photocatalyst for Water Treatment. ACS Sustainable Chem. Eng. 2014, 2, 18021810.
(50) Ferrighi, L.; Fazio, G.; Di Valentin, C. Charge Carriers Separation at the Graphene/(101) Anatase TiO2 Interface. Adv. Mat. Int. 2016, 3, 1500624.
(51) Xu, L.; Huang, W.-Q.; Wang, L.-L.; Huang, G.-F. Interfacial Interactions of Semicon-ductor with Graphene and Reduced Graphene Oxide: CeO2 as a Case Study. ACS Appl. Mat. Interfaces 2014, 6, 2035020357.
(52) Yang, Y.-C.; Xu, L.; Huang, W.-Q.; Luo, C.-Y.; Huang, G.-F.; Peng, P. Electronic Structures and Photocatalytic Responses of SrTiO3 (100) Surface Interfaced with Graphene, Reduced Graphene Oxide, and Graphane: Surface Termination Eect. J. Phys. Chem. C 2015, 119, 1909519104.
(53) Geng, W.; Liu, H.; Yao, X. Enhanced photocatalytic properties of titania-graphene nanocomposites: a density functional theory study. Phys. Chem. Chem. Phys. 2013, 15, 60256033.
(54) Ayissi, S.; Charpentier, P. A.; Farhangi, N.; Wood, J. A.; Palotas, K.; Hofer, W. A. Interaction of Titanium Oxide Nanostructures with Graphene and Functionalized Graphene Nanoribbons: A DFT Study. J. Phys. Chem. C 2013, 117, 2542425432.
(55) Favaro, M.; Agnoli, S.; Di Valentin, C.; Mattevi, C.; Cattelan, M.; Artiglia, L.; Mag-nano, E.; Bondino, F.; Nappini, S.; Granozzi, G. TiO2/Graphene Nanocomposites from the Direct Reduction of Graphene Oxide by Metal Evaporation. Carbon 2014, 68, 319329.
Surface Inhomogeneity Determined using Density Functional Theory. Phys. Chem. Chem. Phys. 2015, 17, 2973429746.
(57) Fischer, J. M. T. A.; Hankel, M.; Searles, D. J. Computational Studies of the Interac-tion of Carbon Dioxide with Graphene-Supported Titanium Dioxide. J. Phys. Chem. C 2015, 119, 2904429051.
(58) Gao, H.; Lu, B.; Li, D.; Guo, F.; Dai, D.; Si, C.; Liu, G.; Zhao, X. Photoactivity and Electronic Properties of Graphene-like Materials and TiO2 Composites using First-Principles Calculations. RSC Adv. 2016, 6, 6531565321.
(59) Umrao, S.; Abraham, S.; Theil, F.; Pandey, S.; Ciobota, V.; Shukla, P. K.; Rupp, C. J.; Chakraborty, S.; Ahuja, R.; Popp, J. et al. A Possible Mechanism for the Emergence of an Additional Band Gap due to a Ti-O-C Bond in the TiO2-Graphene Hybrid System for Enhanced Photodegradation of Methylene Blue under Visible Light. RSC Adv. 2014, 4, 5989059901.
(60) Long, R. Understanding the Electronic Structures of Graphene Quantum Dot Ph-ysisorption and Chemisorption onto the TiO2 (110) Surface: A First-Principles Cal-culation. ChemPhysChem 2013, 14, 579582.
(61) Jia, C.; Ma, W.; Gu, C.; Chen, H.; Yu, H.; Li, X.; Zhang, F.; Gu, L.; Xia, A.; Hou, X. et al. High-Eciency Selective Electron Tunnelling in a Heterostructure Photovoltaic Diode. Nano Lett. 2016, 16, 36003606.
(62) Liu, S.; Guo, E.; Yin, L. Tailored visible-light driven anatase TiO2 photocatalysts based on controllable metal ion doping and ordered mesoporous structure. J. Mater. Chem. 2012, 22, 50315041.
(64) Di Valentin, C.; Pacchioni, G.; Selloni, A. Electronic Structure of Defect States in Hydroxylated and Reduced Rutile TiO2 Surfaces. Phys. Rev. Lett. 2006, 97, 166803.
(65) Anisimov, V. I.; Zaanen, J.; Andersen, O. K. Band theory and Mott insulators: Hub-bard U instead of Stoner I. Phys. Rev. B 1991, 44, 943954.
(66) Li, W.; Walther, C. F. J.; Kuc, A.; Heine, T. Density Functional Theory and Be-yond for Band-Gap Screening: Performance for Transition-Metal Oxides and Dichalco-genides. J. Chem. Theory Comput. 2013, 9, 29502958.
(67) Janotti, A.; Van de Walle, C. G. LDA + U and Hybrid Functional Calculations for Defects in ZnO, SnO2, and TiO2. Phys. Status Solidi B 2011, 248, 799804.
(68) Marsman, M.; Paier, J.; Stroppa, A.; Kresse, G. Hybrid Functionals Applied to Ex-tended Systems. J. Phys.: Condens. Matter 2008, 20, 064201.
(69) Ferrighi, L.; Datteo, M.; Fazio, G.; Di Valentin, C. Catalysis under Cover: Enhanced Reactivity at the Interface between (Doped) Graphene and Anatase TiO2. J. Am. Chem. Soc. 2016, 138, 73657376.
(70) Heyd, J.; Scuseria, G. E.; Ernzerhof, M. Hybrid Functionals Based on a Screened Coulomb Potential. J. Chem. Phys. 2003, 118, 82078215.
(71) Heyd, J.; Scuseria, G. E.; Ernzerhof, M. Erratum: "Hybrid Functionals Based on a Screened Coulomb Potential". J. Chem. Phys. 2006, 124, 219906.
(72) Janotti, A.; Varley, J. B.; Rinke, P.; Umezawa, N.; Kresse, G.; Van de Walle, C. G. Hybrid Functional Studies of the Oxygen Vacancy in TiO2. Phys. Rev. B 2010, 81, 085212.
(74) Dovesi, R.; Orlando, R.; Erba, A.; Zicovich-Wilson, C. M.; Civalleri, B.; Casassa, S.; Maschio, L.; Ferrabone, M.; De La Pierre, M.; D'Arco, P. et al. CRYSTAL14 : A Program for the Ab Initio Investigation of Crystalline Solids. Int. J. Quantum Chem. 2014, 114, 12871317.
(75) Perdew, J. P.; Burke, K.; Ernzerhof, M. Generalized Gradient Approximation Made Simple. Phys. Rev. Lett. 1996, 77, 38653868.
(76) Grimme, S. Semiempirical GGA-Type Density Functional Constructed with a Long-Range Dispersion Correction. J. Comput. Chem. 2006, 27, 17871799.
(77) Goedecker, S.; Teter, M.; Hutter, J. Separable Dual-space Gaussian Pseudopotentials. Phys. Rev. B 1996, 54, 17031710.
(78) VandeVondele, J.; Hutter, J. Gaussian Basis Sets for Accurate Calculations on Molec-ular Systems in Gas and Condensed Phases. J. Chem. Phys. 2007, 127, 114105.
(79) Bates, S.; Kresse, G.; Gillan, M. A Systematic Study of the Surface Energetics and Structure of TiO2 (110) by First-Principles Calculations. Surf. Sci. 1997, 385, 386 394.
(80) Bredow, T.; Giordano, L.; Cinquini, F.; Pacchioni, G. Electronic Properties of Rutile TiO2 Ultrathin Films: Odd-Even Oscillations with the Number of Layers. Phys. Rev. B 2004, 70, 35419.
(81) Labat, F.; Baranek, P.; Adamo, C. Structural and Electronic Properties of Selected Rutile and Anatase TiO2 Surfaces: An ab Initio Investigation. J. Chem. Theory Com-put. 2008, 4, 341352.
(83) Kowalski, P. M.; Meyer, B.; Marx, D. Composition, Structure, and Stability of the Rutile TiO2(110) Surface: Oxygen Depletion, Hydroxylation, Hydrogen Migration, and Water Adsorption. Phys. Rev. B 2009, 79, 115410.
(84) Boys, S.; Bernardi, F. The Calculation of Small Molecular Interactions by the Dier-ences of Separate Total Energies. Some Procedures with Reduced Errors. Mol. Phys. 1970, 19, 553566.
(85) Guidon, M.; Hutter, J.; Vandevondele, J. Auxiliary Density Matrix Methods for Hartree-Fock Exchange Calculations. J. Chem. Theory Comput. 2010, 6, 23482364.
(86) Gui, G.; Li, J.; Zhong, J. Band Structure Engineering of Graphene by Strain: First-Principles Calculations. Phys. Rev. B 2008, 78, 075435.
(87) Gui, G.; Li, J.; Zhong, J. Reply to Comment on `Band Structure Engineering of Graphene by Strain: First-Principles Calculations' . Physical Review B 2009, 80, 167402.
(88) Naumov, I. I.; Bratkovsky, A. M. Gap Opening in Graphene by Simple Periodic In-homogeneous Strain. Phys. Rev. B 2011, 84, 245444.
(89) Kerszberg, N.; Suryanarayana, P. Ab Initio Strain Engineering of Graphene: Opening Bandgaps up to 1 eV. RSC Adv. 2015, 5, 4381043814.
(90) Peintinger, M. F.; Oliveira, D. V.; Bredow, T. Consistent Gaussian Basis Sets of Triple-Zeta Valence with Polarization Quality for Solid-State Calculations. J. Comput. Chem. 2013, 34, 451459.
(91) Wolf, D. In Materials Interfaces: Atomic-Level Structure and Properties, 1st ed.; Wolf, D., Yip, S., Eds.; Chapman & Hall: London, 1992; Chapter 1, pp 157.
(93) Van de Walle, C. G.; Martin, R. M. Theoretical calculations of heterojunction discon-tinuities in the Si/Ge system. Phys. Rev. B 1986, 34, 56215634.
(94) Ni, Z. H.; Yu, T.; Lu, Y. H.; Wang, Y. Y.; Feng, Y. P.; Shen, Z. X. Uniaxial Strain on Graphene: Raman Spectroscopy Study and Band-Gap Opening. ACS Nano 2008, 2, 23012305.
(95) Ni, Z. H.; Yu, T.; Lu, Y. H.; Wang, Y. Y.; Feng, Y. P.; Shen, Z. X. Uniaxial Strain on Graphene: Raman Spectroscopy Study and Band-Gap Opening. ACS Nano 2009, 3, 483483.
(96) Pereira, V. M.; Castro Neto, A. H.; Peres, N. M. R. Tight-Binding Approach to Uniaxial Strain in Graphene. Phys. Rev. B 2009, 80, 045401.
(97) Cocco, G.; Cadelano, E.; Colombo, L. Gap Opening in Graphene by Shear Strain. Phys. Rev. B 2010, 81, 241412.
(98) Cadelano, E.; Palla, P. L.; Giordano, S.; Colombo, L. Nonlinear Elasticity of Monolayer Graphene. Phys. Rev. Lett. 2009, 102, 235502.
(99) Marianetti, C. A.; Yevick, H. G. Failure Mechanisms of Graphene under Tension. Phys. Rev. Lett. 2010, 105, 245502.
(100) Lee, C.; Wei, X.; Kysar, J. W.; Hone, J. Measurement of the Elastic Properties and Intrinsic Strength of Monolayer Graphene. Science 2008, 321, 385388.
(101) Hwang, C.; Siegel, D. A.; Mo, S.-K.; Regan, W.; Ismach, A.; Zhang, Y.; Zettl, A.; Lanzara, A. Fermi Velocity Engineering in Graphene by Substrate Modication. Sci. Rep. 2012, 2, 590.