I
I
t
doc. no
W}gslztg4
ETJROPEAN COMMIS SIO]'{
DIRECTORATE-GENERAL
FOR
AND FINANCAL AFFAIRS
-i- \b r,
E7
Fl
t:Z
ztt r\
,*
*'
*
*
*
*
*
**
PRICE
AND
COST
COMPETITIVEF{ESS
Zndquarter
1994
PART
{:
QUARTERLY REPORT
PART
2:
TABLES AND
CHARTS
-C
ON{PETITIVENESS
A1\{
ONGST
I
NDUSTRIALISED
C
OLINTRI
ES
QUARTERLY
REPORT
-
SECOND
QUARTER
1994
This report provides
a
periodic
assessnrent
of
the
macroeconomic conlpetitiveness
of
the
EU
and
20
industrialised economies
on
the
basis
of
a
number
of
cost and price
indicators.
It
appears
quarterly.
It
consists
of
two
parts.
Pa,rv
/
offers an
analysis
of
recent developments.
The
discussion
is
illustrated
by a
small
number
of
tables
and
graphs.
part
2
provides more detailed
information.
For
eaclt
country,
changes
in
nominal and
real
effective
exchange rates
are
presented
in
the form
of
tables
and
graphs.
The
nominat effective
exchange
rate
(NEER)
ainis
to
track
changes
in
the
uutu.
of
a
nation's currency
relative
to
the
currencies
of
its
principal
trading partners.
It
is
calculated
as
a
weighted
average
of
the bilateral
exchange rates
u'ith
those currencies.
The
real
effective
exchange
rate (REER)
aims
to
assess
a nation's
competitiveness
relative
to its
principal
conrpetitors
in
international
markets.
It
corresponds
to
the
NEER
deflated
by
selected
relative
(or
'effective')
cost
or
price deflators. Part
?
of
the
report
presents
real
rates based
on the GDP
deflator,
the
deflator
of
export
prices,
the
deflator
of
producer
prices
in
manufacturing,
unit
labour
costs
(ULO
in
manufacturing as
well
as
unit
labour
costs
in
the econonty
as
a
whole.t
The
discussion
in
Part
1 focuses
on
rates based
on
the
latter
two
deflators.
1987, the year
of
the
Louvre
Accord
and
the last realignment
of
the
1980s,
is
taken
as
the
base
period
for
the
various indices calculated.
This
does
not
imply"
that
1987
exchange rates should be treated
as
equilibrium
rates.
part
I
of
the
report
starts
with
suntmary
of
nrain developntents
since
1987.
It
consists
of
two
sections.
The
y'ru
t
sccriotz
presents
exchange
rate
developrnettts
of
the
US
dollar,
the
Japanese
yen
and
a
basket
of
EU
currencies
relative
to
twenty
industrialised
nations.
In
this
first
section
the bilateral position
of
the
European
Union
relative
to
the
United
States, Japan
and the
EFTA
countries
is
also
examined.
The second sectiol? con'tments
on
exchange rate deveioplnents among
tlte cottntries
of
the
Union.
A technical annex providcs furthcr details.
PART
1
COMPETITIVENIESS
AMONT
G
S
T
II\IDIJ
S
TRIAL
TZED
COIJNTRTES
QUARTERLY
REPORT
2tto
QUARTen
1994
EVOLUTION
OF
THE MACROECONOIWC COMPETITIVENESS
OF
THE
EUROPEAN
UNION
MAIN
CONCLUSIONS
In
the second
quarter of
1994:
The nominal effective
exchange
rate
of
the
US dollar
declined
r.is-a-vis
European currencies
for
thefirst
time
since
the
second
quarter
of
last !'ear.
ln earlv Ma],
and late
June,
the
Fed
and other
central
banks even
intervened rn support
of
the
dollar,
butthe dollarcontinued its
dechne
inthe
firsthalf
oJull'.
The
3o/o
effective appreciation
of
European currencies
led
to
an
equii,alent
loss
in
the
European Union's cost
competitivcness.
.
European currencies continued
their
decline relative
to
the
Japanese
yen,
albeit
at a slou' quarterll'
rate
of
l%.
As
a
result, the cost competitiveness
of
the European
manufacturing industrv
relative to
its
Japanesecompetitors rmproved
bf'ttte
sameamount.
.
EU unit labour
costs,
u,hich
had
been
nslng
since the
third quarter
of
1990- stabilised
relative to
those
in the United
States, Japan
and the other industrial nations. The
recent moderation
in
\4'agedemands and
inflationary
pressures
in the
Union
appears
to
have made an
important
contribution.
Since
the
first
EMS crisis
(since
the
third
quarter of
1992):
.
The European Union
has
w-itnesseda significant
imprgvement
in its
cost competitiveness relative
to
the US
(b), lZ%)
and particularll',
Japan
(b)'
29%). These gains have been caused b1'
the
depreciation
of
the Europ€an currencies relative
to
the
US dollar
and the
Japanese
ven.
Iacreases
in
EU
ielative unit
labour
costs have had
anegativc,
but relativeh'smaller
effcct.
.
The
Union's
cost
competitivsness relative
to
the
Alpine
countries rmproved because
of
the
appreciation
of
the Ssiss Franc
and
Austrian
Schilling
The
cost performance
of
Su'rtzerland
and
Austria
has becn
very similar to that of
the Union.
The Union's
cost competitiveness
relative to
the
Nordic
countnes, hou'ever,
has
deteriorated
because
of
the
depreciatron
of
the
Nordic
currencies
and
reductions
in
relative
unit
labour
costs achieved
in
Furland
and,
to
a
lesserdegree.
Sweden..
The currencies
of
the counlnes
that
devalued
or
depreciated
against the
DM
follou'rng
the crises in
the European
Monetary
System,
have improved
their
cost competitiveness
relative to their parhers
rnthe
European
Union. In all ofthesecountries (uiththeexception of
Porhrgal), relative
umt
labour
costs have declined, assisting
the
r\ecessary
adjustments.
In
Portugai too, the rate
of
increase in
relative
unit
labour costs has
slorved
dou,n
sigmficantlv since
the
tlurd
quarter
of
1992.
Thc
currenc)'depreciations that occurred
behvesn September 1992
and
August
1993 appear
to
have
contributed
to
the
correction
of
previous misaligtments.
Over
a
longer perspective
(since
the
first
quarter of
1987):
.
The relative cost perforrruu"l€
of the
Union's non-mrmufacturing sectors has
been
much better
than
that
of
manufactunng industry'.
As
a
consequence
the
cost
mmpfiitiveness
of
Europe's
manufacturing industry
has detenorated
by
2%%. wtrile the competitive position
of
the
Union's
emnom)'as
a
u'hole
has
improved bv
4t/zo/o..
Amongst
the larger Union
members, France
and
ltall'
have
improved their competitive position in
manufactu.iog
b)'
7o/oand
l5%.
respectivelt'-
uhile
Geimanl' and Spain have
recorded
losses
of
14%and
5%%. The United Kingdom's competitive performance has rmproved
b1 1%
Amongst
the
I
COMPETITIVENESS AMONGST INDUSTRIALISED
COUNTRTES
QUARTERLY
REPORT
-
SECOND
QUARTER
1ee4
I.
TNTERNATIOI\{AL
DEVELOPMENTS
1.
Uailsd_Slalst
In
the second
quarter of
1994,
the
nominal
effective
exchange
rate
of
the
US
dollar
declined by a
tittle
over
2o/" (see
Table
1)t.
Most
public
attention has focused
on
the
value
of
the dollar
re,lative
to
the
Japanese
yen and
the
Deutschmark, and much less on
the value
of
the
dollar
relative
to
othen currencies such
as
the Canadian
dollar
(Canada
is
an
important trading partner
cf
the US). While the US
dollar
weakened
in the
second
quarter relative
to
the
DM
(by 3%%)
and
the
yen
$y
a%),
it
strengthened relative
to
the
Canadian
dollar (by 3%).
The2o/o
reduction in
the nominal effective exchange rate
of
the
US dollar reflects
dl
of these
developments.
'
l
The weakness
of
the
US dollar
relative
to
the
Japanese
yen and
the
German
mark
has
been caused
by
a number
of
factors,
including the
depressed
US
bond markets, the
US-Japan
trade dispute
and
the stronger than expected recovery in Europe and
Japan.
The
dollar
had
been
on
an
upward trend
since the
first
EMS
crisis in
the
third
quarter
of
1992. This upward trend was
first intemrpted
in the second quarter
of
last year, when the
dollar
depreciate{
by
3%o.
The dollar
recovered
quickly
however, rising
by
more
than
3Yr% in the second half
of
last year. The decline
of the
dollar this year
appears
to
be
of
a
longer duration.
Still,
it
is important
not
to
exaggerate
the
implications
of
the
current
dollar
weakness.
In
the
second
quarter
of
1994,
both the
nominal and
reaP effective
exchange rate
of
the
US
currency
were
still
slightly
above the rates observed
during
the
same
period
of
the year before.
The ZYonominal depreciation
of
the dollar
in
the
second quarter
of
1994led
to
a
ZVzo/oimprovement
in
the
cost competitiveness
of
the US manufacturing
industry
and
a
l%o/o
improvement
in
the
cost competitiveness
of the
US economy
as
a
whole.
The
profitability of
American exports,
however, did not improve
during
the
second quarter
of
this
year'.
a
Vzo/oincrease
in
relative
export
prices was offset
by
an
equivalent rise in
relative
unit
labour
costs3.
The exchmge rates considered are averages of daily exchange rates.
Uriless othenrise stated, relative unit labour costs in marfufacturing are used as deflator.
The
relatire
e4porl pnofitabilit-vof m
economy
is
defineda
theratio
of
relative exportprice
indices andrelatiye urut labour costs
in
the economl'as a r*'hole (expressedin
national currencies).It
is an indicatorof
t
rABLE 1: MAGffOECOIJOM|C COMPmnVENESS OF Tl{E UMTED STATES,
Jnpen
ANp THE EUROPEAN UMON'
RH.ANVE TO TWENTY INTXJSTRTAL COUNTRIESA
B/OLUTION IN MAT.TUFACruRNG INDUSAY B. ElrOLtmON lN WttOLE ECOi'IOMY%
Chanqe
Iluring
seond
quarter 199,'f {94 Arl / 9{ A1)LtsA
Japan
Eat12tSA
Japanzu12
I.IEER (11
uLc
{2}REm
Fl
a.2
2.8
1.44.4
0.3
{.0
-2.5
3.1
1.4-2.2
2.8
1.40.5 {.3
4.2
-1.7 2.5
1.2%
Chanoe
Since the first EMS
criis
{91U
/ gA 03}tsA
Japan
At
n
ttSA
Japanzu12
NEER (1)
ulc
(2)REm
0)
8.5 g2.5
-r's.+4_1
0.1
4.54.1 T2.7
-11.68.s
32.50.6
-1.49.1
30 6-15.4 0.6 -14.9
%
Chanoe
Since the Louwe Agreement
pa
a2 / 87 Qfl
rrsA
Japan
EIJ 12t
sA
Japq!
€u
!?
NEER (1)
uLc
{2} REER (3)€.7
€.9
-17.8
47.2 -9.5 33.2
€.8
10.3 2.7
-9.7
3.6
€.5
47.2
-14 6
8.7
6.8
2.3
4.7
Source : DG ll.D.4 EC
(1)
NEER = l.lominalEftctire
Excharge Rate. A mirurs means a depreciation of the NEER.(2)
ULC
= Relatirre Unit Labour Costs (in national cunency).(3) REER = Real Efuc'tire Exchange Rate = relatir,e unit labour costs (in common cunency)
A minus means an improrement in cost competitiwness.
Since
the
first
EMS
crisis
in
the
third
quarter
of
1992,
the
nominal
effective
exchange rate
of
the
US dollar
has risen
by
8%%.
The
dollar
appreciation has caused
a4o/o
detenoration
in the cost
competitiveness
of
the
US
manufacturing sector
md
a
9o/odeterioration
in the
cost
competitiveness
of
the
US
economy
as
a
whole
The
cost
perfbrmance
of
the US'manufacturing industry
has
traditionally
been better than
that
of
the LIS economy
as
a
whole.
The
long-term
trend
has been
for
the
US
to
notch
up
significant gains
in
cost
competitiveness
through
reductions in manufacturing
unit
labour costs
and
a depreciating
doltar. Since
the Louvre
Agreement
of
19E7,
US
unit
labour
msts
in
manufacturing
have decreased
by
9o/a
relative
to
those
in
other industrial
countries and
the dollar
has
depreciated by
almost
10oA.
Both
factors have contributed
to the
1E7o
improvement in
the
cost competitiveness
of the
US
manufacturing industry
since
the
first
quarter
of
1987.
Crraph
1illustrates
that
most
of
these gains were made in the period befween the
first
quarter
of
lg87 (Louwe
agreement) and the
third
quarter
of
1992 (the
fust
crisis in
I
30
20
0
-10
-20
-30
GRAPH
1DEVELOPMENT OF COST
COMPETIIVENESS
(1)
RELATIVE TO INDUSTRIAL PARTNERS
SINCE THE LOUVRE ACCORD
10
re2Q3/87O1
(2)
Ee4Q1/e2O3
(2)
E3e4Q2/e4O1
(2)
United States
Japan
European Union
(1) Cost competitiveness as measured bythe nominal efiec{ive
ercfange rde deftated by unit bbot, co6ts in MANUFACTURING. Aminus means an improrrernentin cosl competitiveness. (2) Expressed as the natural lognnlhm of the ralio (n %)
2.
Japan
In
the
second
quafter
of
lgg4,
the
nominal
effectiie
appreciation
of
the
yen
accelerated to
37o
from
lo/o
in
the
first euarterr
The appreciation
of
the
Japanese
yen
relative
to
the
US
dollar was much
stronger
than
its
appreciation
relative
to
the
European currencies4. The 3Yo appreciation
of
the yen led
to
an equivalent decline
in
the
cost competitiveness
of
the
Japanese
manufacturing sector, because
relative
unit
labour
costs remained constant
These
latest
developments appear
to
be
a
continuation
of
a
trend that
became
firrnly
established
in
the
early
1990s.
Table
I
illustrates
that
since
the
third
quarter
of
1992
relative
unit
labour
costs
in
manufaauring
have
hardly
budged.
This
implies
that
the
nominal effective exchange
rate
of
the
yen has become
the
sole determinant
of the
cost
competitiveness
of
Japanese
manufacturing
industry
(see
Cnaph
2).
As the
yen
has
appreciated
by
32%yo
in
nominal
terms,
cost competitiveness has
deteriorated
by
the
same percentage.
a
The 1?$ rate declined from an averageof
107.54in
thefirst
quarterof
1994to
103.22 )'en perdollar
in
thesecond quart€r
of
1994. More recently, the yen has strengfhenedto
97.37 +lS (12.7.1994). The ven appreciatedonl.v
slightl)'relative to
theDeutsctrnark
theli(DM
rate declinedfrom
62.43in
thefirst qrurter
of
1993 to 62.18 yJn per Deutschmark in the second quarterof
1994. More recentl-v-, the ven has lost some etround relativeJapanese
manufactufers
tppear
no longer
capable
of adjusting to
the
rising
value
of
the yen
by reducing
unit labour
costs (as they
did
so successfully
in
the second
half
of
the
1980s
when the yen appreciated
by
more
than
5A%
between 1985 and
1988)
The
rate
of
technologrcal progress and
the flexibility
of
the
Japanese
labour market
system
seem
to
have reached
their limits.
Consequently,
profit
margins have
been
squeezed
significantly. Caused by
an
llo/o
reduction in
relative
export
prices (expressed
in
nationat
currency),
the export
profitability of
the
Japanese
economy has declined
by almost
10o/osince the
third
quarter
of
1992.
An
alternative response
to
the current yen crisis could
be
a
reduction in the costs
of
non-labour inputs
into
the production
process.
Most
Japanese losses
in
cost
competitiveness have
occurred
only
recently,
i.e. in
the
period
after the
first
crisis
in
the
EMS
(see
Graph
l).
In
the
period
before,
the
1l%
rise
as a
whole
is examined.
This
analvsis
the
Member States.
Intra-Union
in the value
of
the yen was largely offset by
a
reduction in
unit
labour
costs.
I
3.
European
Union:
In this
section,
the
cost competitiveness
of
the EU
may
obscure diverging
developmentb
among
developments are presented
in
Sestion
II.
The compefirtve
position of
the
European
Union
relative to other
industrial
countries
In
the
second
quarter
of
1994,
the competitive position
of
the
European Union
deteriorated
by
lyzYo,
mainly due
to
the nominal appreciation
of
its
currencies
relative
to
the
US
dollar
(see
Table 1). The
Union's
real
ef;Fective
exchange rate
based
on unit
labour
costs
in the
manufacturing sector rose
for
the
first
time
since
the
third
quarter
of
1992 (see
Graph
2).
In
a more
positive
development,
relative
unit
labour
costs
stabilised. They had
been
rising
since
the third
quarter
of
1990.
The
recent
moderation
in
wage
demands
and
inflationary
pressures
in
the Union
appears
to
have
made
an
important contribution.
The nominal and real depreciation
of
the European
curencies, which
came
to
an end in
the
second
quarter
of
1994,
had
commenced
u'ith
the
first EMS
crisis
in
September
lgg2.
Since
the
third
quafter
of
1992,
the
EU
manufacturing
industry
has
recorded
a
IT/2aA gain
in
cost competitiveness,
in
spite
of
a
4Yzatorise
in
relative
unit
labour
costs,
Thus,
the
recent improvements
in
the
competitive position
of
the EU
should
completely
be
sttributed
to
a
nominal depreciation of
European currencies.
t
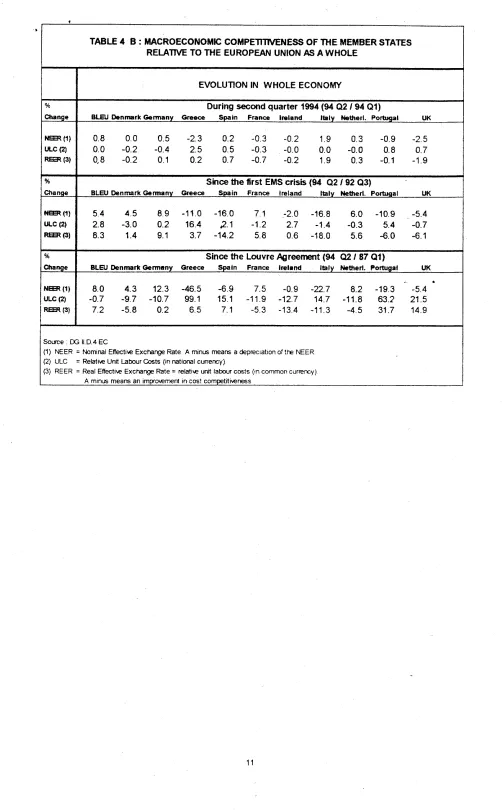
If
we
consider
developments
in
the
economy as
a
whole,
the picture
looks
even
brighter
thanks
to a better
cost pedormanc€
of
the Union.
The
rise
in
relative unit
laboun costs since the
Louwe
Agreement
is limited
to
2YzYoas
opposed
to
l0Y2%
in
the
manufacturing sector.
This
has
contributed
to
a
4y2%
improvement
in the
Union's
cost
competitiveness
and
a
sYr%
rise
in its
export
profitability.
The
implication
is
that
European economy as
a whole
is
more competitive nou'
than
it
was
at the
time
of
the
Louvre Agreement.
The competitive
position of
the
European Union
relative to
the
Ilrttud
Stales and Japan
In
the
second
quarter
of
1994,
th"
European
cirrrencies
(and
the
German
Marks)
appreciated
relative
to
the US dollar
for
the
first
time
since
the
second
quarter
of
last
year.
In
early
May
and late June,
the
Fed and
other
major central banks even intervened
in
support
of
the
dollar. The Union's
currencies continued
to
depreciate
relative
to
the
Japanese
yen, albeit
at a slower
pace
than
in
the
first
quarter. The 3o/o
depreci+tion
of
the dollar and lo/o rppreciation
of
the yen
were
reflected
in
equivalent
changes in
European cost cornpetitiveness,
as
EU unit
labour costs stabilised relative
to
those
in
the
United
States
and
Japan (see
Table 2).
Since
the
third
quarter
of
1992,
the European Union
has
witnessed
a
significant
improvement
in
its
cost
competitiveness
relative
to
the
US
(by
tzoh)
and
particularly,
Japan
(by
29"/").
These gains have been
caused
by the depreciation
of
the
European
currencies
relative
to
the
US dollar (by
17Vr%)
and
the
Japanese
yen
(by
3lYzo/o).Increases
in
EU
unit
labour
costs
relative
to
the US (6tA%)
and Japan (3t/r%)
contiriued
to
have
a
negative effect on
the competitive
position
of
the
Union
and,
from
a
longer-tenn perspective, could pose serious problems.
Since
the finst
quarter
of
1987,
EU
unit
labour
costs
in
rnanufacturing have
risen
by
ll|zYo
relative
to
those
in
the
United
States.
This
has
led
to
a
l7%o/o
deterioration in
the
Union's competitive
position relative
to the
US
(see
Graph
3).
Relative
unit
labour costs in the economy as
a
whole
have hardly changed,
limiting
losses
in
European
cost
competitiveness
to
2o/o.
EU unit
labour
costs
relative
to
Japan have
risen
in
both the manufacturing sector
(by l9%)
and the economy as a
whole
(by
17%).
Nevertheless,
the
European
Union
has benefited
from
a large improvement
in its
cost
cornpetitiveness relative
to
Japa4
as
the European currencies have depreciated
by
no
less
than
3lr/206
relative
to
the
Japanese
yen (see Table 2).
s
The DIW$ rate decreased from an av€rageof
1.722 in tbe first qr:arterof
1994 to I .660 Deutschmark per dollara
TAALE 2 : MACRC}EGOIiIC}MIC COMPET1TIVEilESS OF TTE zuROPEAN T,T.IION
ffi-ATIVE
TO THE UNITED STATES AT{D JAPAT.IA
EI/OLUTION lN MAI,JUFACTURNG INDI STRY B, N'OLUTION IN WIIOLE ECOT{OMY%
Chanqe
tsA
JapanDuring
scond
eurrter
lggf
{9{ 02 / 94Al)
USA
&pan
NEER (1)
uLc
(21 REER (3)3.2
0.3
3.5
-0.9
-0.2
-1.1
3.2
-0.9
-0,5
0.12.7
-0.9
oA
Chanoe
tsA
Since the
fird
EMS cridsp4
A2 / 92 a3)Japan
tSA
JapanIrEER (1)
ttrc
t2)REm
F)
-17.4
-31.6
t6.4
3.5
-12.1
-2p.2
-17.4
-31.6
0.1
1.7
-17.3
-30.5
%
Cfianoe
Since the Louwe Agreement
(g
A2 / 87all
Jaoan
LISA
JapanusA
NEER (11
uLc
(2)REER (31
2.O
-31.3
15.4
18.9
17.6
-18.3
2.0
0.1 2.1
-31.3
17.4
-
19.6
Source : DG ll.D.4 EC
(1) NEER = I'lominal Efiecti\€ Excfnrge Rate. A minus means a depreciation of the NEER.
(2)
ULC
= Relatir,e Unit Labour Costs (in national cunency),(3) REER = Real Eftclir,e Exchange Rate = relatir,e unit labour costs (in comrnon cunency)
A minus means an improlement in cost competitilerpss.
The
compditive
position of
the
European
Union
relative
to
the
EFTA
countries
ln
the
second
quarter
of
1994,
the
changes
in
European
Union relative to
the
EFTA
countries
3).
Unit
labour
costs
in the Union
continued
to
rise
(by
l%)
the cost
competitiveness
of
the
were
relatively
minor
(see Table
more
rapidly than
those
in
Finland
In
the finst
quarter
of
1994,
the
Swiss
franc
(21/zo/o),the
Swedish
krona
(4oh) and the
Finnish markka (4Yr%) experienced a
more
significant nominal
appreciatioq contributing
to
an
improvement
of
aroun
d
3% in the
competitive
position
of
the
EU
relative
to
these
countries.
Since
the
third
quarter
of
lggzrthe EU
currencies have depreciated
relative
to
the
Swiss
franc (lOVr%) and
the Austrian
schilling (sYr%).
Consequently,
the
competitive
position
of
the
EU
relative
to
Switzerland
and
Austria
has
improved
by
lfh
and
5o/o,fne
elsuing
losses
in
EU
comp€titiveness
were
especially
notable
in
relation
to
Sweden
(31%)
and Finland
(26%),
as
these countries
not
only
devalued
their
currencies
but
also
achieved
major reductions
in
unit
labour costs
in
manufacturing
relative
to
the
EU.
In
Finland,
the
social partners have agreed
for
three
years
in
a
row
not
to
raise nominal
wage
levels.
Looking
back
further
in
time, the Union's competitive
performance
in
comparison
with
Finland
is
even
worse
(a
decline
of
55oh
since
the
first
quarter
of
1987),
but
losses
relative
to
Sweden are
limited
to
15oh.
The cost competitiveness
of
the
Union
relative
to
Switeerland improves
by
15Yz%,
but
deteriorates
by
51/zoArelative
to
Austria
(see Graph
4).
a
TAALE 3 :MSROECOI,|OMIC COMPETTTIVENESS OF THE EUROPEAI UNION
RELATI\E TO EFTA CO UN TRIES
\
E\OLUTION IN MAIIUFACTURING INDUSTRY B. E\DLUTION IN \TIJI-IOLE ECONOMY%
Chame
During second quarter
1994 (9402
/ 9401)
Auslria
Finland
filorwev SwedenSwitzerland
AusfriaFinland
l{orway Sweden SwitzerlandNEER (1)
ulc
(21REER (3)
-0.2 0.3 -0.3 0.6
0.2-0.2 1.1 -0.4 0.1
-0.6-0
3
1.4 -0.7 0.6
-0.4-0.2 0.3 -0.3 0.6
0.2-4.2 0.3 0.3 -0.0
-0.1-0.4 0.6 -0.0 0.6
0
1% Chanoe
Since
the
f,rst
EMScrisis
{94
02,
92 A3}Austria
Finland
Norwav SwedenSwiEerland
Ausiria Finland ibrwav
Sweden SwiEerlandI{EER (1)
rrLc (2) REER {3)
-5.5 8.9 3.7
21.5
-10.30
5 15.9
-14
7.8
-1.0-5.1 26.2 2.2
31.0.
-11.2-5.5
89
3.7
21.5
-10 3-3.0 25
2.7 16
06
-8.4 11.6 6.4 23.5
-9.8o/o
Chanoe
Since
the Louvre
Agreenert (94 02
/
8701)
Austria
Finland
Norwav SwedenSwitzerland
Aus*riaFinland
t{orway Sweden SwitrerlandNEER {1)
uLc {a
REER F)
-7.3 72.6 5.6 23.4
-6.913,6 26.5 -3.4 -6.7
-9.25.3
550
2.A
15.2
-15.4-7.3 n.6
5.6 23.4
-6.91.5
-28
9.9
-121
-3.6-6.0 19.1 16.1
85
-10.2Source.DGi; D4EC
(1) NEER = Mmrnai Efectire Exct-ange Rate. A minus rreans a depeciation of 1fe NEER
(2)
ULC
= Relairw Unrt Labour Costs (in rnlronalcunerrcy).-(3) REER = Reai Effectrre ExcfarBe Rate = relatire untt labour coots (in common cunerny)
t
Ir.
INTRA-UNION DEVELOPMENTS
In
the
second
quarter
of
1994,
no major shifts
in
intra-European
competitiveness
occurred
(see
Tables
44.
and
48)
The
most
interesting
development
was
the
first
significant appreciation
of
the
ltalian lire
since
the
third
quarter
of
1992, that
rvas
linked
with
the
coming
into office
of
a
conservative alliance. The
2o/onominal
appreciation
of
the
lire
led
to
an equivalent loss
in
the cost
competitiveness
of
the Italian
manufacturing
industry.
More
recently,
the
lire
has
weakened
again, reflecting
the
uncertainties
surrounding the economic policies
of
the
new
government. The
British
pound,
that
had
appreciated since
the
first
quarter
of
1993, depreciated
by
zYr%
in
norninal and
by
lt/z
real terms. The pound
has been
under pressure in
part
because
of the weakness
of
the US
dollar
relative
to
the
German
mark. The
2%o/o
depreciation
of
the
Greek drachma
was
again
insufficient
to
compensate
the
3Yo
nse
in unit
labour
costs,
which
led
to
a
t/zo/odeterioration
in the
Greek
competitiveness.
The
1%
depreciation
of
the
Portuguese
escudo had more positive effects, contributing
to a
small
improvement
in
the
competitiveness
of
the Portuguese economy
(/z%)
Most
other currencies were relatively
stable. Relative
unit
labour
costs
in
manufacturing declined
in
Germany,
France,
Ireland
and
the
BLEU,
but
increased
in the remaining
Union
member
states.
.Since
the September
lggl
ERM
crisis,
fwo
groups
of
countries can be distinguished.
The
lirst
group
comprises
the countries that were forced
to
devalue
(or
let
float)
their
currency against
the
DM,
hence
improving their
cost
competitiveness against
their EU
partners:
Spain
(181/r%),
Italy
(17%%), Portuga.l
(61/r%),
the
United Kingdom
(:6%)
and
lreland
$%)
In
all of
these
countries
(with
the exception
of
Portugal)
relative unit
labour costs have declined, aiding
the
necessary
adjustments. The currency depreciations
which
occurred between September 1992 and
August
1993 appear
to
have contributed
to
the correction
of
previous misalignments.
The
second
group
includes
the
core
ERM
countries,
which kept their
central
parities
unchanged, recording
significant
losses
in
cost
competitiveness.
Germany
(101/zo/o),
the
Netherlands
(7o/o),
the
BLEU
(6'A)., and
France
(6a/o).
Denmark
stands
out,
because
it
has
managed
to
offset
the
nominal effective
appreciation
of
its
currency
by
a
corresponding
improvanent
in its
relative
cost
perfiormance.
Of
the
other countries
in
this
second
group
only
France has
recorded
a drop
in unit
labour
costs
relative
to
the
Union
as
a
whole.
The competitive position
of
Greece,
which
never entered the
ERM,
has
also deteriorated
(by
6Yzo/o).in
spite
of
the
continuing depreciation
of
the
drachma. Relative
unit
labour
costs have risen
by
20Yo,
well
above
the
rates
of
increase
recorded
by
other
member
I
TABLE
4
A
: MACROECONOMIC COMPETTIh ENESS OFTllE
MEMBER STATES RELATIVE TO THE EUROPEAII UNION AS A WHOLEEVOLUTION
N
TilANUFACTURING INDUSTRY%
Ctranoe
During
secondquarter
f994 (94Q2194
Q1)BLEJ llcnnark Germanv
fleece
Smin France lipland
ltalv
lletherl.Portisal
UK NEER (11uLc e)
REER (3'
0.8 -0.2 0.7
0.0 0.5
-2.30.5 -0.7
2.90.5 -0.3
0.60.2 -0.3
-0.20.4
-05
-0.40.6 -0.9
-0.61.9
0.4 2.2
0.3 -0.9
-2.50.6 0.4
0.90.9 -0.5
-1.7%
Ctranoe
Slnce
the
first
EMS,crisb(94
02 /
92 A3)BLBJ llenmarlt Gcrmany
Grccce Spain Frane lrcland
ltalv
llethed.Porfusal
Ul( I.EER {1}uLc (2) REER (31
5.4 4.5 8.9
-11.0
-16.00.6 -5.6 1.6 19.8
!S.Z6.0 -1.3 10.7 6.7
-18.77.1
-1.2 5.8
-5.4
-o.7
-6.1 6.0
0.8 6.8 2.0
1.8
3.8
-10 9
4.7 -6.6 -16.8
-0.9 -17.6
% Chanoe
Since
the
LouvreAgreenent
(94
02 /
87Oll
BLRf Denrmrk Glermany
Greece Spain
France
keland
ltaly
ilefterl.
Port4al
UX?{EER {1)
ulc
(2) REER t3)-46.5
132.4
24.3
-5.4 4.6 -1.1 -6:9
13.3
5.4
8.0 4.3
12.3-5.3 -6.3
1.42.3 -2.2
13.87.5
-0.9
-n.7
8.2
-19.3-13.6
-24.5 1A.2 -9.3
U.7
-7.1
-25.1
-14.8 -1.8
32.9Source : DG ll.D.4 EC
(1) t\iEER = l.Jominal Efiectiw Excfnrge Rate. A rrfnus rneans a depreciation cf ttE NEER
(2)
ULC
= Relatire Unrt Labour Costs {in nattonal cunerrcy)(3) REER = Real Effectile Excharge Rate = relatie unrt labour costs (in commofl cunerrcy) A minm means an irnororernent in cost comoetittvetress
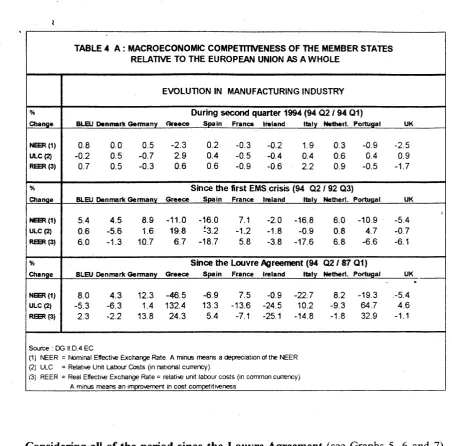
Conside.ing
all of
the
period
since
the
Louvre
Agreement
(see Graphs
5,
6
and 7),
only
two
countries
-
4mong those having adjusted
their
exchange rate since September
1992
-
have significantly strengthened
their
competitive position
in
the
Union:
Italy
(by
l5o/o)
and
lreland
(by
25%'1,
The United Kingdom's
competitive perfbrmance
has
improved
by
a
meagre 1%.
Spain
and
Portugal
have recorded losses
of
St/zo/oand 33o
,respectively.
The poor
perfbrmance
of
Porfugal
should be
attributed
to
a rise
in
relative
unit
labour
costs
of
almost
65oh,.
second
only
to
Crreece
(where
unit
labour costs
have
risen
by
no.less
than
132%).
However, the
rate
of
increase
in
Portuguese
unit
labour
costs has slowed
down
significantly
since
the
third
quarter
of
1992.
Greece
witnessed
the greatest loss
in cost
competitiveness
of
all
EU
member states
(241/zo/o),
which
offers
at
least
a partial
explanation
of
the recent speculative pressures on
its culrency.
Amongst
the
larger
Union
members,
France
has managed
to
improve
its
competitive position
by
7o/o,
wfule
Gerrrany
recorded
a
14% loss
in
competitiveness.
[image:13.593.53.506.21.467.2]TABLE
4
B :
MACROECONOMilC GOMPETTTTyENESS OF THE MEMBER STATES REI.ATIVE TO THE EUROPEAN UNION AS A WHOLEEVOLUTION
lN
WHOLE ECONOITTYYo
Chanoe
During
s€condquarter
1994 (9402 /
94Oi)
BLEIJ llenmark Germany
Greece
Spa.in
Francr Inlsnd
ttaly
lStherl.Porbrqal
UK NSER (1)rJLc f2) REER (31
0.8 0.0
0.50.0 -0.2
-0.40,8 -0.2
0.1-2.3 2.5 0.2
0.2 -0.3
-0.20.5 -0.3
-0.04.7 -a.7
-0.21.9 0.3 -0.9
-2.50.0 -0.0 0.8
a.71.9 0.3 -0.1
-1.9% Chanoa
Stoice
the
first
EMScrisb (94
A2/
9203)
BI-EIJ Denrmrk Germsny
Gireece
Spain
France
lreland
ltalv
llettrerl.Portuqal
UK I|EER {1}ulc{a
RER (3)5.4
4.52.8
-3.08.3
1.48
9
-11.0
-16.00.2 16.4
2.t
9.1 3.7
-14.27.1 :2.0
-16.8-1.2 2.7
-1.45.8 0.6
-18.06.0 -10.9
-5.4-0.3 5.4
-O.75.6 €.0
-6.1C|rance
Since
the
LouvreAgreerurt (94
02,
87Ot)
BLEU
llenmrl
GermanvGreece Spain
France
lrelend
ltafv
l{atherl.Portuoal
UK NEER {r}uLc (4
REER (3)
-22.7 8.2 -19.3
-5.414.7
-11.8 63.2
21.5-11.3 -4.5 31.7
14.98.0 4.3
12.3
-46.5-0.7 -9.7
-10.7
99.'l7.2 -5.8 0.2
6.5-6.9 7.s
-0.915.1 -11.9
-12.77
.1
-5.3
-13 4Source : DG ll.D.4 EC
(1) NEER =fJominal EfrectieExcharpeRate AminusmearsadeprecratronoftfBl€ER (2)
ULC
= Relatne Unit Labour Costs (in rutional cunercy)(3) REER = Real Efiectiw Excharge Rate = relatiw unit labour cmts {rn common currercy) A minus mear6 an impro\€rnent in cost competrti\eness
[image:14.593.37.539.21.831.2]lllDl]'lAr{ - r
9s4t07i07
GRAPTI
2
NONIINAI, AND REAL
EFFECTTVE EXC]I.IANGE
RATT,S
\/IS.A-\/IS
IC2O
NOl/INAL
IFFTCTIVE
IXCI-IANGI
RATESVIS A
VIS
ICzO.
1987
Ql
( PERI OD
=
100
AVIRAGE }
150
1{0
130 120
110
100 9C
80
UNII
LABOUR
COSTS
IN
|t,|ANUFACTURINGINMJSIRY
ViS A
VIS
ICzO,
1987
Ql
=
1OO150
t40 t30 t20 t10
100 00 BO
1.40
ll0
120
t10
100 so
BO
70
-r-.-r-l--
'1993
1S!.1UNiT
LABOUR
COSTS
IN
TOTAL
ECOI{OMYvIS
A VIS
1C20, 1987
Q1
=
100
110
110 120 110 100 90
80
tal
t40
lJo
12
t10 t00
90
BO
70
VIS A
VIS
ICzO,
IIlD
!4lAR
-
t994lA7
107GRAPH
3
NONllN,\L
AND REAL
EFPECTM
EXCFIANGE
RAT ES
YIS-A-VIS ECl2
NOftIINAL IFFECT
IVE
EXCIIAI'IGI
RATTSvIS
A
VIS
EC12.
1987
Ql =
10u
1s0
1{0
lJo
120
lt0
100
90 80
70
lu
:.
t50 t40
t_Jo
t20
t"10
100 90 80 70
::.:
:
:.
:19S3
1894UNII
LABOUR
MSTS IN
MANUFACTURING
INDTJSTRYVIS A VIS E012,
1987
Ql
=
100
1J0
120
110
100 90
80 70
t30 t20
110 100 EO 60 70 tB87 1988 lgSs lggo 1993 1994
UNIT
LABO{JR
COSTS
IN
IOTAL
VIS A
VIS
ECT?, 1987
Q1tC0f\0['lY
=
100
1J0
120 110
100
90
80
70
tJo t20
t_10
t00
90 EO 70
t993
IrtDl4lAR
-
19e4rc7n7
GRAPH
4
N0NIINAI- AND
REAL
EFFECTI\/[,
EXCHANGE,
RATE,S
VIS-A-\/IS
ECI2
100 90
UNIT
LABOUR
MSTS
IN
MANUFACTURING INU.JSIRY
VIS A
VIS
IC12,
1987
Ql
=
1Ot]t20
110
t00
9(}
EO 70
130 120
tt0
[00
90 80 70 60
lJo
t20 t10
100
so
BO
70
1JO
120
l-lro
l-100
t-eol.
80
t-
70t--
6Q'----.-...|--...-.-...-.-'-'...'''''''I'''''''''''''''
1SS3
19q.11JO 120
110 100 90 80
70
UNIT
LABOUR
C0STS
IN
IOTAL
tcOt\0fvlf
VIS A
VIS
ECL?,
1987 Q1
=
1OONOT/|IML
TFFECTIVE
EXCIIAI,IGE RATESil
tD l4l
AR
-
1994107lgt
GRAPH
5
NONTINAL EFFECTIVE E,XCTIANGE RATES
VIS.A-VIS
E,(]I2
f{OI.,|INAL EFFECI
IVT
EXO{AME
RATESVIS A VIS
EC12,
1987
Ql =
100
NCI-,{INAL
ViS
AIFFECT
IVE
EXO{ANGE
RATESVIS
EC12,
, 1987
Ql
=
100
i
---:
:
-\;
filDl4lAR -
1ee4
07i07
GRAPH
6
REAI-
EFFECTIVE
EXCIIANGE
RATES
\/IS-A.\/IS
E,CI2
UNIT
LABOUR
COSTS
IN
MANUFACTURING
INUJSIRY
VIS A
VIS
EC12.
1987
Ql
=
100
.--..-.i.:,:.:.'.'.,....'.'.--i..'...J-,,.:.:ffi.:,
lm
1993
1994UNIT
LABOUR
COSTS
IN
MANUTACTURING
INUJSIRY
VIS
A
VIS
8C72,
1987
Ql
=
100
..-.: .... .."-.. ..--'..'..-..i...'-..'...- -i . ..-...re.'..'.i.r,.i-*
{::"!
i\*l i
-i'1,-J
\!
:.,--i-f6l__---Ti
,-.-F'.
Y
:ii!!\-:
:
i
i
\-fffi'],
:
i
i
:
:
:\
|t,{0
t20
110
lrlDl4lhR -
1994fi7t07
GRAPH
7
RT,AI- EFFEC'TIVE EXCTIANGE RATES
VIS-A.VIS
ECI2
UNIT
LABOLJRCOSTS
IN
TOIAL
[CO|\OMYVIS A VIS
EC12
,
1987
Ql =
100
UNI
T
LABCXJR COSTSVIS A VIS
ECl
2 ,IN
I0TAL
tCOt\0MY1987 Q1
=
100
i... ...-.-'*.- -.--...i ..'..'.1 r...'.... "i "'....'.. "'..
i ,'
:
'[6^Dl:
t_40tlcl
!20 t10
PART
2
TABLES
ANID
CIfiRTS
doc. lltrg5n/|9+EN
PRICE
AND
COST
COMPETITI\,'EI\ESS: TABLES
AN]-D
CHARTS
Tables
and charts containing indices
of
COMPETITIVENESS derived
from
indices
of
NOMINAL
EFFECTME
EXCHANGE RATES
and
PRICE AND
COST PERFORMANCE
are attached hereafter
The
EC12,
the
ERM and
20
INDUSTRIAL COUNTRIES
are
presenled
in
the
following order.
Period coverage
Base period
:
1974-19%l'l0.z
:
1987
=
100
tlon-EC
Eurooe
(1)
EC12
(21
ERM
(4)
Denmark
(5)
Germany
(6)
Greece
$pain
France
lreland
Italy
Netherlands
Portugal
United Kingdom
(14)
Austria
( 1
5)
Finland
(16)
Nonruay(I7
)
Sweden
(18)
Switzerland
FJon-Eurooe
(19)
Aus;tralia
(20)
canada
(211
Japan
(22)
usA
(7)
(8)
(e)
(10)
(1
1)
(12',1
(13)
Each
country (or
country
bloc) is compared with
(other)
.
INDUSTRIAL
COUNTRTES
.
EUROPEAN COMMUNITY
COUNTRIES
.
ERM COUNTRIES
Nationai
price and cost indices (in national cunency and in USD) and bilateral
USD
exchange
rates
for
all countries are given
in
tables on the last 6 pages of
the
dossier.
A
brief technical
annex
is attached.
IND]
CA
TORS
VtS-A-VIS
OTHER
EC72
OF COMPET]T]VENESS
BASE
L}BT
:
1OO
INDUSTRiAL
COUNTRI
ES
( ICzO
)1f,o
720/
lto
too
BO
BO
70
15d!
7ZO
110
1(}0
go
80
70
t:/
7L
73 7+
75
INDI
CA
TORS
VTS-A-VTS
OTHER
92
72
\-'
\
\
76 T7 78
79
BO
81 82
85 84
€5 E6
87 88
Bs
90
ERM
OF COMPETITIVENESS
BASE
1gB7
lNDI/STRTAL
COUNTRI
ES
( ICzO
)t
91
9J
:
100
'-.7
130
tzcl
110
10c]
90
8C)
70
130
120
11tl
100
9t)
8Cr
7tl
7r\
A1
/l
72
ECIz
AS
COI{PARET'TITH
OTHER
IIIDUSTRIAL
COUT.ITRIES
(IC)
BASE
3
87
.**i-.-*--+
!
t
'"nlCE (Co:3T) CSlFEIIrtvlr€SS!
A€aL EFfECTIIE EXCrt**C[trTE
r: r PRIC€ (COST l PERFORf{AIICEr
.
(tfLATlv€ FFICE tCOSlt tl.lOEX tN A Ofi+l(''lC|nREHCYI
13
Oofiti,tL r
ttELArIvE pRtcE (cosrt trf,rEx lH NArto+talctnn€r|cy)
r+--.---t
IGIF.I'EFLAIO9 (,l{II LAAOUE -UNIT LAAOtn PRODT,CER DEFLATOR OF!3.
EXCt{ANGE. :GD?.DEFLATOR I,}IIT LABOIJFI''III
LAaouT PRoDt,,cEI DeFLAToR oF ttl'El8
:
CoSt lN IoT. cO3I lN ITaN PRICESOF
TOIAL €XPORTS;!RaTE
:.
COSI lN ToT. cOST lN t{AN pRtcEsOF
lotaL EIpORTS: ECOI-|OHY IHDUSTRY HAN( FACI. (G + 'S'
r
t 75 : 106.l
| 76 t 98.( r- 77: 100.5
| 73 : lO3.I . It r 112.7
It
t tO r 118.3
I Ol : 100-;
t t: : ?6.a
t tS : 90.7
r a{ r 83.7
tt
I t5 r 85.6
-r la r t3.O
t 17 r t00.0 r lt r 98.7
I It r !5.8 It
I t0 r t07.3 r fl r l0<.8 . ,2 r 109.2
r t3 : 100.(
It
r tt? r lO2.?
r tt3 r 98.3
I tt{ : 98.2
I fil r t6.5 r )42 r 9?.9
tt
lrt.5
to?.1
103 .0
105 .0
I 15.0
tl?.(
!0c.9 98 .3
9? .6
85.(
85. I
93.3 100.0 9?.8 !(.5 105.( t0t.5
106 .8 98.<
100 .2 95-3 96.0
,<.o
95. I
99.5
9l .0
9l .9 95.1
105 .2
rrt.5
95 .2 90. (
d5.4 80 .2 80.8 88 .5 100.0 9A.2 96.0 106.7
l0( .6
t 0e.0 102 .9
t0(.5 l0l.l t01.3
,9.4
100.8
103 .3
96.8 99.6 102. I 109.? I10.3 95.0 92.2 87.5 42.2 83.2 ,3 .2
lo0. o
r8 .5
t5.8
106 .2
t03.7
lg7 .< 98. I
tr.5
t6.o
t6. o
N.4 t6.0
93.5 90.4 91.?
t7 .<
l0?.( lo5. 7
93.? 9l .0
,8?.7 as.0
85.(
93.9 I O0.0
t8 .3 95.7
t07.8
r oJ.s
t09.6 t02.6
lo< .2
loo.7
1o0.9
t9.
t
100.8
I37.5 l2( .5 123.3 t24.O ls2.l l5<.2 112.6 l0(.7
t5 -8
45.9 85.3
r3 .5 1o0.0
,8 .4
,s.4
106.4 la2 .9
l0s.(
95. 9
97 .6
93.7 93.5
tl.7
9t.0 77.r 79.18l .5
63. I
85.3
88.I 89.(
92.O 91.7 95. 3
98 .0 99.(, 1o0.0 1o0.3
lo0. (
100 .8 101.9
103 ,6
104 .8
ta<.7 l0(.9
105.0
105 ,2 105.3
81.7 82 .0
83 .5 84 -7
87.1-9t.2
93 .2 93. e
96 .6
98 .2
99 .8
99 .7
1o0.0-99.1
99 .0 99. I
99 .7
lol.(
102,7 102. 7
102 .8 102. ?
t 02.5 102.3
72-2, 73. t
75. 3
75.7
79 .6
83. t
84 .6
86.3 89. I 92.2 91.7
. 9<.5
100.0
99.8
100,6 100.3
t01.7
103 .4 107.3
r07.t
107.9
I 08.3 ... l08.( .
108.( 75. I 77.4 80.8 82 -< 82,7 a? .2 84-3 8e .l
91.3 94.6
97 .S
99.7
t 00.0
9i.9
lo0. (
t9.8
100.8
t 02.o 102.(
to?.o
102.5 102. 7
105 .o
105.2
68 .0
72 .6
76.4 7E.g 77-5 t!8.8 a2.8 46.9 ?t -5
95.3 r00. I
100.( loo. o
.t9. t
l0l.t tor..3 lo?.8 lo{.0 107.o 106.8 lo?.9 lg?.9
lc.2
lo8.( t I t I' IERII
AS
COI'IPAREDI{ITH
OTHER
INI}USTRIAL
BASE
:
87
I : PRICE (CO:T ) CO}rO€TITIVIh€SS : REAL EFFECTI\E €XCf{AHGE RATE :: t r (RELAT'VE fRtCE (COST) INDEX lN A COmTON CTRRENCY) ::
af-a---
---:---.4
r rGDP-DEFLATOR tlllT LAEOtn $llT LABOtn PRODTCER
tttEAR , COSI 'lN TOT. COST IN tlAN PRICES OF
I t ECO}TOHY INDI STRY HANUFACT.
DEFLATOE OF ::
TOTAL EXPF TS: r
(G. S) ::
l.ror.{INAL €FFECT I\E
EXCHANGE
, RATE
: PRICE (COST ) FERFORP|ANCE
: (RELATIVE PRICE (COST) INDEX IN NATIOI.|AL CURRET*CY) r
+----+---L
:GDP-DEFLAT0R UNI T LABOUF UNIT LABOTR PRODUCER DEFLAIfi OF t
: COST I t{ TOT . COST lN l{AN PR t C€S OF TOTAL €PORTS T
: ECONO|{Y INDUSTRY HANUFACI. (G . S, t
75l 75! 77: ?8: 79: 80: 8l :
8t: 85: 81 :
E5! 862 37: 88: 89! 90: 9l :
92: 93:
l03. I
97 .S 99 .6
102 .3
llt.6
t17.4 100 .2
95 .9 90. 7
83.9
84 .2
93.(
100.0 98. ?
95,a
106 .5
l0(.1
108 .5 '
oQ o
lll.5 l0r -2 t.02.0 loa -2 I 14.0
12t.7
l0(-3
97 -7
o.t
85. (
85 .5 93.6 100. 0
97.3 9( .0 t04.6 t01.9 106.3 og.l I00.8 9?. I 93.7 96 .0
t05.0 ll?.(
95 .0 90.8
f s.a
80.7
8l .6 89 .0 100.0
97 .4
95.0
toi.s
103. 3
t07.7 101.? 102.8 95.5 99.3 lol.9 los.9 It0.l
95 .0 92.4 87.8 42.8 8(.0 95.( t00.0
97 .9
95 .6
r05.9 103.( 107. I 98.0 92.4 89 .5 93.( 96.7
l0l .7 1A4.7
92 .5 90. 3
87.4
83 .0
45.5
9(. I 10e.0
93 .3 96.6 107.7 105.9 109.( l0:.d 130.6 I 18.5 117.7 118.7 126.7 l?9.<
t 09.3 102.2 9( .3 86 .2 85.3 93.6 100.0 98.2
95 .5 106.6
I 03 .4
105 .2
97.l
e0.(
82 .2 84 .6 86 .2
ae. t 90. 7
91.7 93.8
96 . 1-'
97.3 98.7 99.8 100.0 10c.0 99.9 99.9 100.7 lc:.1 103.0
85. 3
85. (
86.7 87.8 90.0
9<.1
95 .4
95 .6 97.8 e9. I t00.3 100 .0
t00.0
99. I
98.(
98.1 98.6 100.1
l0t . t
77 .2
7? .7 79.7 80.9 83.7 86.9 a7 .9 88.8 91.0 93.6 95.7 95-0
,100 .0
QO)
99.5
98 .8 I0c . 0
t0l.< lo(.8
?8 -7
81.(
8<.<
85.9 85.9
85. I
86-9 90 -(
93.1 96. O
98.5
99 -7
t00.o
99.7
t00.!
99-3 100. 0
100.9
100 .9
70.8
?5.S
7t.3 8!.5
BO. ?
a€.
t
8< .688.(
92.7
36.3
100.
(
1o0.5 t00..olo0.o
t0l,2
t01.0
102.
(
t0l.l
r05 .5
:952: : 933 :
:93(: : 9(l :
z9a2:
t:
l0l .5 97.8 97-8
9b .: 97.6
99 .8 96.0
95 .8 93-9
q5 .0
t 03 .2 99.9 100.1
98 .2
9e .5
99.3
95.9
95 .9 94.4 95.9
t 03.9
!00.5 I 00,.8 99. ?
100 .8
102.9 103.0 103.2
103 .2 103.3
t0l.e
t0i.:
101.0
r 00.8 100.5
l0(.6
105.3
105 .5
105 .5
105 .3
100. 7
tct-0
t0t.l
l0l .3
t0t.5 103.3 105.9 106.5 105.6 106.7
98 .7
94 .9 94.8 93. r