A global multicenter study on reference values: 2. Exploration of sources
of variation across the countries
Kiyoshi Ichihara
a,⁎
, Yesim Ozarda
b, Julian H Barth
c, George Klee
d, Yoshihisa Shimizu
e, Liangyu Xia
f,
Mariza Hoffmann
g, Swarup Shah
h, Tandi Matsha
i, Janette Wassung
j, Francois Smit
i,j, Anna Ruzhanskaya
k,
Joely Straseski
l, Daniel N Bustos
m, Shogo Kimura
a, Aki Takahashi
n, on behalf of,
Committee on Reference Intervals and Decision Limits, International Federation of Clinical Chemistry and
Laboratory Medicine and Science Committee, Asia-Paci
fi
c Federation for Clinical Biochemistry:
aFaculty of Health Sciences, Yamaguchi University Graduate School of Medicine, Ube, Japan b
Department of Medical Biochemistry, Uludag University School of Medicine, Bursa, Turkey c
Blood Sciences, Leeds General Infirmary, Leeds, UK d
Laboratory Medicine and Pathology, Mayo Clinic College of Medicine, Rochester, MN, USA e
Department of Medical Life Science, Faculty of Medical Bioscience, Kyushu University of Health and Welfare, Nobeoka, Japan f
Department of Clinical Laboratory, Peking Union Medical College Hospital, Peking Union Medical College & Chinese Academy of Medical Science, Beijing, China gDivision of Chemical Pathology, University of Stellenbosch, National Health Laboratory Services, Tygerberg, South Africa
hDepartment of Laboratory Medicine, P. D. Hinduja National Hospital and Medical Research Center, Mumbai, India i
Department of Biomedical Sciences, Faculty of Health and Wellness Science, Cape Peninsula University of Technology, Cape Town, South Africa j
PathCare Laboratories, Cape Town, South Africa k
Beckman Coulter LLC, Moscow, Russia l
ARUP Laboratories, University of Utah School of Medicine, Salt Lake City, UT, USA
mDepartment of Clinical Biochemistry, Faculty of Pharmacy and Biochemistry, University of Buenos Aires, Argentina nBeckman Coulter Japan, Tokyo, Japan
a b s t r a c t
a r t i c l e i n f o
Article history:
Received 31 December 2015
Received in revised form 8 September 2016 Accepted 20 September 2016
Available online xxxx
Objectives:The intent of this study, based on a global multicenter study of reference values (RVs) for serum analytes was to explore biological sources of variation (SVs) of the RVs among 12 countries around the world.
Methods:As described in thefirst part of this paper, RVs of 50 major serum analytes from 13,396 healthy individ-uals living in 12 countries were obtained. Analyzed in this study were 23 clinical chemistry analytes and 8 analytes measured by immunoturbidimetry. Multiple regression analysis was performed for each gender, coun-try by councoun-try, analyte by analyte, by setting four major SVs (age, BMI, and levels of drinking and smoking) as a fixed set of explanatory variables. For analytes with skewed distributions, log-transformation was applied. The association of each source of variation with RVs was expressed as the partial correlation coefficient (rp). Results:Obvious gender and age-related changes in the RVs were observed in many analytes, almost consistently between countries. Compilation of age-related variations of RVs after adjusting for between-country differences revealed peculiar patterns specific to each analyte. Judged from the rp, BMI related changes were observed for many nutritional and inflammatory markers in almost all countries. However, the slope of linear regression of BMI vs. RV differed greatly among countries for some analytes. Alcohol and smoking-related changes were ob-served less conspicuously in a limited number of analytes.
Conclusion:The features of sex, age, alcohol, and smoking-related changes in RVs of the analytes were largely comparable worldwide. Thefinding of differences in BMI-related changes among countries in some analytes is quite relevant to understanding ethnic differences in susceptibility to nutritionally related diseases.
© 2016 The Authors. Published by Elsevier B.V. This is an open access article under the CC BY license (http:// creativecommons.org/licenses/by/4.0/).
Keywords: Reference values
Worldwide multicenter study Body mass index (BMI) Multiple regression analysis Age-related changes Ethnicity-related changes BMI-related changes Smoking-related changes Alcohol-related changes
Clinica Chimica Acta xxx (2016) xxx–xxx
⁎ Corresponding author at: Department of Clinical Laboratory Sciences, Faculty of Health Sciences, Yamaguchi University Graduate School of Medicine, Minamikogushi 1-1-1, Ube 755-8505, Japan.
E-mail address:[email protected](K. Ichihara).
http://dx.doi.org/10.1016/j.cca.2016.09.015
0009-8981/© 2016 The Authors. Published by Elsevier B.V. This is an open access article under the CC BY license (http://creativecommons.org/licenses/by/4.0/). Contents lists available atScienceDirect
Clinica Chimica Acta
j o u r n a l h o m e p a g e :w w w . e l s e v i e r . c o m / l o c a t e / c l i n c h i m
Non-standard abbreviations
Alb albumin
ALP alkaline phosphatase
ALT alanine aminotransferase
AMY amylase
ARG Argentina
AST aspartate aminotransferase
BMI body mass index
Ca calcium
CDL clinical decision limit
CK creatine kinase
CI confidence interval
Cl chloride
CLSI Clinical and Laboratory Standards Institute
C3 complement component 3
C4 complement component 4
CHN China
Cre creatinine
CRM certified reference materials
CRP C-reactive protein
CV (b) CV of the regression slope b DL drugs for dyslipidemia; decision limit
DMS data management system
ETOH alcohol consumption
Fe iron
GGT gamma-glutamyltransferase
Glu glucose
GBR Great Britain
GH growth hormone
HDL-C HDL-cholesterol
HBV hepatitis B virus
HCV hepatitis C virus
HT drugs for hypertension
IgA immunoglobulin A
IgG immunoglobulin G
IgM immunoglobulin M
IND India
IP inorganic phosphate
JPN Japan
K potassium
LAVE latent abnormal values exclusion
LDH lactate dehydrogenase
LDL-C LDL-cholesterol
LL lower limit
MRA multiple regression analysis
Me median
Mg magnesium
Na sodium
PAK Pakistan
PHL Philippines
RI reference interval
RMP reference measurement procedure
RUS Russia
RV reference value
rp partial correlation coefficient
SAU Saudi Arabia
SD standard deviation
SDR standard deviation ratio
Sk skewness
Smk smoking cigarettes
SV sources of variation
TBil total bilirubin
TC total cholesterol
Tf transferrin
TG triglycerides
TP total protein
TUR Turkey
UA uric acid
UL upper limit
ZAF South Africa
ZAF/Af African of South Africa ZAF/NAf Non-African of South Africa
1. Introduction
The current reference interval (RI) study not only allows determina-tion of RIs but also provides us with an invaluable opportunity to
explore and clarify sources of variation (SVs) of each laboratory tests among healthy individuals. In 2004, a multicenter study was conducted in the East and Southeast Asian countries to assess the feasibility of es-tablishing common reference intervals. That study unexpectedly uncov-ered regional differences in test values for a variety of analytes, especially for inflammatory or nutritional markers, such as IgG, C3, and CRP[1]. To confirm thesefinding, a large scale study to derive com-mon RIs was conducted in 2009 involving 3500 healthy volunteers re-cruited by 67 laboratories from 7 countries in East and South-east Asia. By the use of a collective measurement scheme, 72 analytes (25 chemistries and 47 immunoassays) were measured for each specimen
[2,3]. The study clearly revealed regional differences in one third of the analytes as determined by use of the criterion of an SD ratio (SDR: between-factor SD divided by between-individual SD)N0.3, which cor-responds to the allowable analytical bias based on between-individual SD[4,5]. Notable examples were HDL-C, IgG, C3, CRP, PTH, and folate.
With this background, the current global multicenter study on refer-ence values (RVs) coordinated by the C-RIDL/IFCC was carefully planned with two major objectives: (1) to establish optimal methodologies for derivation of RIs through analysis of real-world datasets gathered from studies around the world, and (2) to explore their SVs including age, gender, BMI, drinking, smoking, geographical regionality and eth-nicity. The use of a common protocol with a detailed health-status ques-tionnaire[6], and the scheme of aligning RVs based on the test results of a standard reference serum panel measured in common allowed us to perform the analysis in a well-controlled manner[7]. In thefirst part of this report on the global study, various methodological issues related to derivation of the RIs were addressed and thoughts on each issue were provided as a consensus among the collaborators[8]. In this second part of the paper, SVs of RVs found in the 12 countries were systematically evaluated, using the same dataset as analyzed in thefirst part. The main focus of the analyses were as follows:
(1) to evaluate the importance of age, BMI, and levels of alcohol in-gestion and smoking as a major SVs of RVs in the various coun-tries (ethnic groups) by use of multiple regression analysis (MRA),
(2) to confirm ethnicity related differences in BMI-related changes in RVs, which were noted for some analytes (ALT, TG, HDL-C, and CRP) in the preliminary analysis[5],
(3) to make a BMI adjusted comparison of RVs among the countries, and
(4) to delineate gender- and age-related profiles of RVs from a large number of datasets compiled from the 12 countries.
2. Methods
2.1. Source data
Included in this interim analysis are the results from 12 countries: China (CHN), Japan (JPN), Philippines (PHL), India (IND), Pakistan (PAK), Saudi Arabia (SAU), Turkey (TUR), Russia (RUS), UK (GBR), South Africa (ZAF), USA, and Argentina (ARG). The demographic pro-files of each country's study are as reported in the part 1 of this paper
RIs, RVs from individuals receiving medications were not excluded from the analysis, because their numbers were relatively small [see Table 1 of
[8]and no difference was observed in the preliminary multiple regres-sion analysis (MRA) with or without the excluregres-sion of those individuals, although we noted a non-negligible effect of oral contraceptive in the derivation of Alb, TG, and ALP[8].
Among 50 target analytes[6], RVs of the following 31 analytes were chosen for analyses in this study: TP, Alb, UN, UA, Cre, TBil, Glu, TC, TG, HDL-C, LDL-C, K, Ca, IP, Mg, Fe, LD, GGT, AMY, AST, ALT, ALP, CK, CRP, IgG, IgA, IgM, C3, C4, Tf, and TTR. RVs of Na and Cl were excluded be-cause of the difficulty in harmonizing the values for these analyses.
2.2. Analysis of sources of variation by multiple regression analysis
MRA was performed, country by country, analyte by analyte, sepa-rately for each gender. The value of each analyte was set as an object variable and afixed set of SVs were included as explanatory variables [of age, BMI, and levels of alcohol consumption (ETOH) and smoking cigarettes (Smk). ETOH was ranked intofive grades by ethanol in g per day: 0: none; 1:≤12.5 g; 2:12.5bto≤25 g; 3:25bto≤50 g; 4:50 gbethanol/day. Smk was ranked into 3 grades by the average number of cigarettes per day: 0:none; 1:≤20; 2:N20/day. The South African dataset was again analyzed in two parts by ethnicity. Regarding ETOH, it was excluded from the analysis for Saudi Arabia and Pakistan (where drinking alcohol is prohibited for religious reasons), and for Smk, it was not included in the analysis of females in India, Pakistan, and African of South African because of a very low rate of smoking [also see Table 1 in[8].
Each of 25 analytes was set one by one as an objective variable. Values for analytes which showed skewed distributions of values were logarithmically (log) transformed before MRA. These include TBil, Cre, TG, AST, ALT, LDH, GGT, ALP, CK, AMY, and CRP. The outlying points out-side mean ± 4 × SD of the RV distribution were excluded before MRA (if transformed, mean and SD were computed in the log scale).
The association of each SV with the object variable was expressed as a standardized partial regression coefficient (rp) which corresponds to the partial correlation coefficient, with values between−1.0 and 1.0. Because of the generally large data sizes, statistical testing of rpis not suitable; therefore, we arbitrarily regarded 0.15≤|rp|b0.25 as slight, 0.25≤|rp|b0.35 as moderate, and 0.35≤|rp| as obvious associations.
2.3. Association of age and BMI with the RVs for each country
Linear-relationships of the RVs with age or BMI were analyzed coun-try by councoun-try using the least-square linear regression in order to deter-mine whether or not the relationships were constant among the countries. For age, the analysis was selectively performed in males for RVs of Alb which had a prominent age-related change, and in females for RVs of IP, ALP, and LDH, which showed prominent increase after menopause. For BMI, regression analysis was performed separately for each gender using RVs of UA, TG, HDL-C, ALT, GGT, and CRP with the highest associations with BMI. Again, in the analysis of RVs of ALT, GGT, and CRP, the RVs were transformed logarithmically to minimize the skewness in the distributions.
2.4. BMI adjusted comparison of the RVs among the countries
With conspicuous differences in BMI among the countries (Fig. 1) and our observation of ethnicity related differences in the effect of BMI on RVs, BMI adjusted analysis of between-country differences was performed. The adjustment was made, country by country, by use of the following formulas, assuming BMI of thei-th individual (BMIi) was shifted to BMI0(=25 kg/m2):
b¼Δyi=ΔBMIi ⋯definition of the slope
Δyi¼bðBMIi−BMI0Þ
Yi¼yi−Δyi
[image:3.595.107.501.54.335.2]Males
Females
Fig. 1.Comparison of BMI among the ethnic groups in males and females. The distributions of BMI for males and females were compared among ethnic groups. The horizontal box in each
scattergram represents the central 50% range and the vertical line in the center denotes the median point. The long vertical line was drawn at BMI = 25 kg/m2
as a guide. As judged from the SDR of around 0.45 for both genders, there are large between-group differences in BMI among the ethnic groups.
where b is the slope of the least squares regression line y= a + b × BMI. BMIiand yirepresent the BMI and test results of thei-th individual. Yi corresponds to yiadjusted for the difference of BMI from BMI0(Δ BMIi). By the definition of the slope b, the change of the yi(Δyi) by shifting from BMIito BMI0can be computed by the second formula above. Then, the adjusted value Yican be simply computed by the third formula.
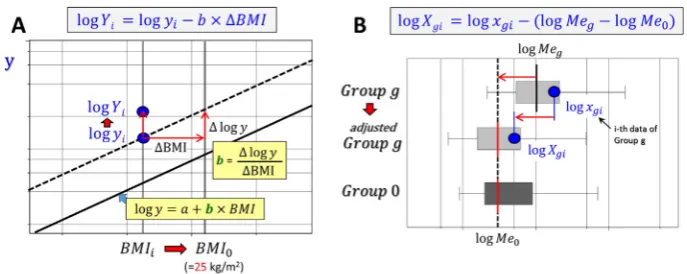
Likewise, when yiis logarithmically transformed, the adjusted Yi by shifting BMIi to BMI0can be computed based on the least square linear regression line logy= a + b × BMI using the following formulas (Fig. 2A).
b¼Δlogy=ΔBMI
Δlogyi¼bðBMIi−BMI0Þ
logYi¼ logyi−Δlogyi
Yi¼elogyi−Δlogyi
2.5. Sex and age related profile of the RVs adjusted for between-country differences
All the test results were recalibrated to the assigned values if available, and otherwise aligned to the values for China, which had the largest number of RVs. Then, in consideration of between country differences observed between the countries as reported in part one of this report[8], the aligned test results for each analyte were ad-justed country by country so that the median of country g (Meg) was adjusted to the median of China (Me0). Therefore, the i-th value of country g,xgi was adjusted toXgiby use of the following formula.
Xgi¼xgi−Meg−Me0
In case of analyte whose values were log transformed, the following formula were used to adjust for the differenceDgin the medians on the log-scale (Fig. 2B).
Dg¼ logMeg−logMe0
logXgi¼logxgi−Dg
Xgi¼elogxgi−Dg
3. Results
3.1. Comparison of partial correlation coefficients for age and BMI among the countries
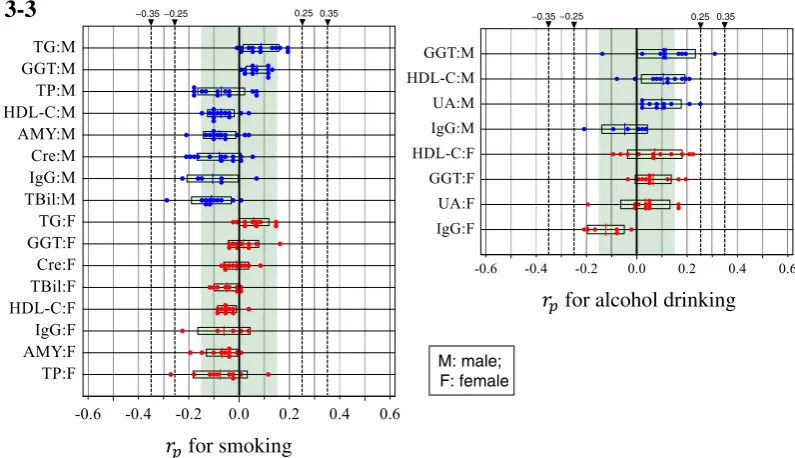
The lists of partial correlation coefficients (rp) obtained country by country, analyte by analyte, for each gender were organized for each SV into four tables (Suppl. Table 1). Test items in each table were sorted by the descending order of their average rp(rp) for the countries exam-ined. The analytes with |rp|N0.10 for either of the sexes for the analysis of age and BMI (or |rp|N0.07 for ETOH or Smk) were chosen and their distributions of rpare shown inFig. 3.
Age as a SV in males showed moderately positive associations with TC and Glu; slight associations with LDL-C, urea, CRP, and TG; moderate-ly negative (neg) association with Alb; and slightmoderate-ly negative associa-tions with IgM and TP. In females, age showed associaassocia-tions with urea and TC; moderate associations with LDL-C, Glu, and LDH; slight associa-tions with TG, ALP, Tf (neg), IgM (neg) and 6 other analytes. It is notable that LDH and ALP in females showed a relatively wide among-country difference in the degree of age-association. It is also notable that degree of age-associations is generally more prominent in females, especially for urea, Alb, LDH, and ALP.
BMI as a SV in males showed a prominent association with C3; mod-erate association with ALT, CRP, UA, GGT, and TG; slight association with HDL-C (neg) and 4 other analytes. In females, BMI showed prominent association with C3 and CRP, moderate association with UA and HDL-C (neg), and slight association with TG, GGT, AMY (neg), and four other analytes. It is notable that the associations of ALP and AMY with BMI are more prominent in females.
Smk as a SV had only a week associations with TG, GGT, TBil (neg), IgG (neg), and AMY (neg) in both genders. ETOH as a SV also had a week associations only with GGT, HDL-C, UA and IgG (neg).
3.2. Consistency of age-related changes among ethnic groups
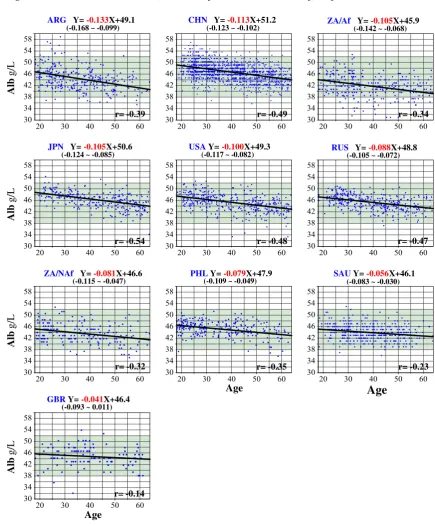
The partial correlation coefficient rpcomputed by the MRA showed closeness of the linear association between values of a given SV (x) and RVs (y). However, rpdoes not necessarily mean that the slope of the linear association is steeper in proportion to rp. Therefore, regarding age as a SV, its relationship with RVs and the slope was evaluated by least-square linear regression analysis. Chosen for the analysis were Alb of males, and ALP for females. A two-dimensional scattergram was drawn for each ethnic group using the same scale for x- and y-axes. The graphs are displayed in the descending order of the slopes in
Fig. 4. Regarding Alb, there is apparent consistency in the linear relation-ship among the 10 ethnic groups. There is somefluctuation of the
Fig. 2.Adjustment of test values on logarithmically transformed scale. The left panel (A) illustrates a formula to adjust a test value y of thei-th individual for a change of BMI from BMIito
[image:4.595.121.465.572.709.2]slopes, which range from−0.04 to−0.133 (a 3.3-fold spread), but the difference can be reduced to 2.0-fold by excluding the groups on both ends with small sample sizes. It is notable that the slopes (b), as a whole, are not consistent with the correlation coefficients (r).
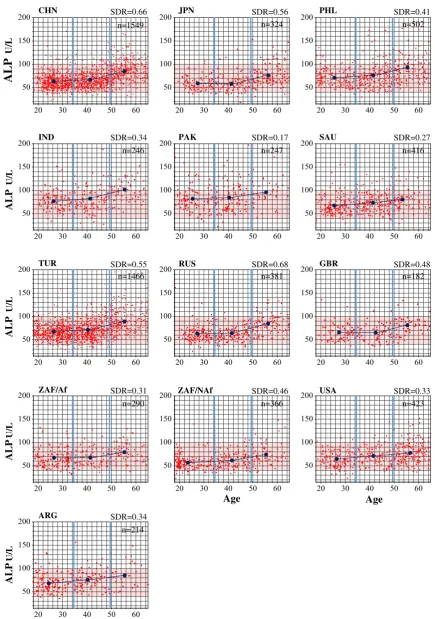
For ALP in females, a prominent elevation after menopause (around 50 years) was apparent in almost all 13 ethnic groups. The magnitude of between-group differences was expressed in SDR (computed by one-way ANOVA). Thefluctuations in SDR were small, implying there are
for age (male)
for age (female)
0.35 0.25 0.35
0.25 −0.35−0.25
−0.25
3-1
3-2
−0.35
for BMI (male)
for BMI (female)
0.35 0.25 0.35
0.25 −0.35−0.25
−0.25
[image:5.595.101.504.114.682.2]−0.35
Fig. 3.Comparison of MRA results across the countries in males and females. Multiple regression analysis (MRA) was performed, country by country, for each analyte by setting age, BMI,
and levels of alcohol consumption (ETOH) and smoking (Smk) as afixed set of explanatory variables. The analysis was done separately for each gender. The association of each source of variation (SV) with test results of a given analyte was expressed as a partial regression coefficient (rp) with values between−1.0 and 1.0. The results of rpfrom all the countries were gathered, SV by SV, for each gender. The distributions of rpfor each analyte are shown in descending order of average rpof all the countries. Because of the large data size, 0.15≤|rp|b0.25 was regarded as slight, 0.25≤|rp|b0.35 as moderate, 0.35≤|rp| as prominent association. Fig. 3-1: Distribution of rpfor age. Fig. 3-2: Distribution of rpfor BMI in males and females. Fig. 3-3: Distribution of rpfor habit of smoking (Smk) and drinking alcohol (ETOH).
no major differences in age-related changes in female ALP among groups. The same analyses performed for urea, TC, and LDL-C gave sim-ilar results (data not shown).
3.3. Consistency of BMI-related changes among the countries
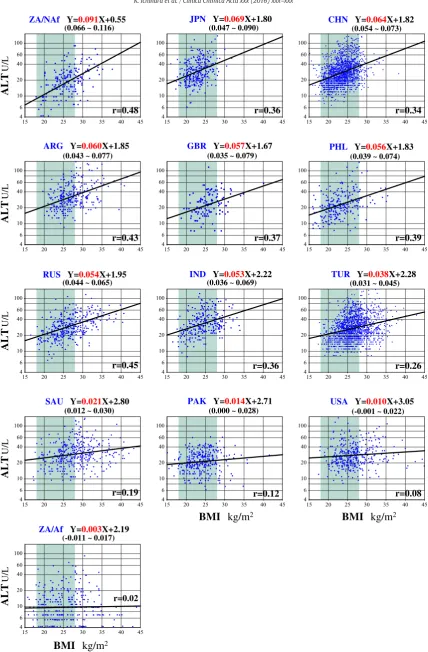
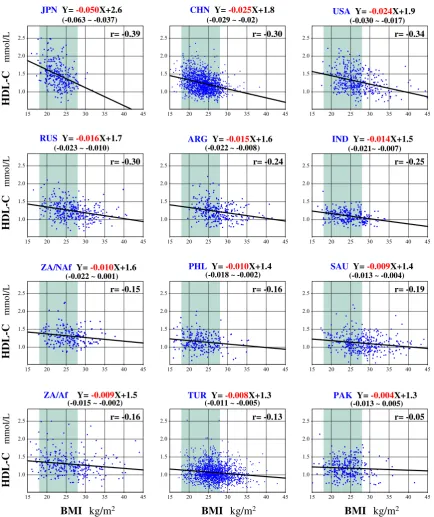
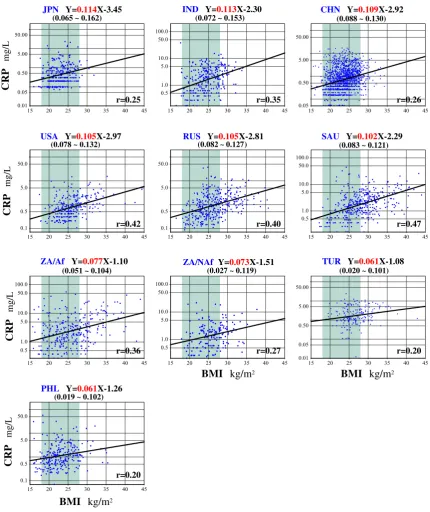
For BMI as a SV, the same analyses were performed to compare rp with the slopes of the linear regressions between BMI and test results. Chosen for analysis were UA, TG, HDL-C, ALT, GGT, and CRP which showed obvious associations with BMI. Typical results are shown in
Fig. 5for ALT (Fig. 5-1), HDL-C (Fig. 5-2), and CRP (Fig. 5-3) for males. Regarding log-transformed ALT, there are conspicuous differences in slopes of the least-square regression line for 13 ethnic groups. The slopes differed greatly, ranging from 0.003 to 0.091, a factor of 30 fold (6.9 fold after excluding one group on each end). For HDL-C, the slopes also differed greatly among the ethnic groups, ranging from−0.0004 to
−0.0050 (a factor of 12.5-fold; reduced to 3.1-fold after removing two groups from the ends). In contrast, the slopes of log-transformed CRP with BMI ranged from 0.061 to 0.114 (the factor of 1.9 fold; the same after exclusion). It is of note that the slope (b) is as a whole not related to the correlation coefficient (r), which is a parameter representing the closeness of the relationship. The results of the same analyses for UA, ALT, and GGT are shown in Suppl. Fig. 1. In all, there are quite conspicu-ous ethnic differences in BMI-related changes for the test results in each of these analytes except CRP.
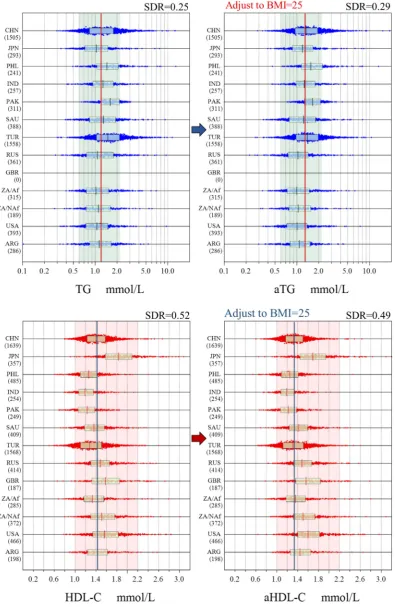
3.4. BMI-adjusted comparison of RVs among ethnic groups
The results of the above analyses point to the need for BMI adjusted comparison of RVs among the countries because there exist large between-country differences in BMI as shown inFig. 1. InFig. 6, two ex-amples are shown for between-country comparison of RVs for log-transformed male TG and for female HDL-C. Adjusted comparisons for other analytes affected by BMI are shown in Suppl. Fig. 2. In terms of SDR, the changes are small with only slight shifts of RVs for each ethnic group. The interpretations of adjusted differences in RVs among the eth-nic groups are described in the Discussion.
3.5. Gender- and age-related profiles of RVs after application of the LAVE method and adjustment for between-ethnic groups differences.
Fig. 7shows the effects of applying the LAVE method and adjustment for between-ethnic group differences on the gender- and age-related profiles of RVs. Gender and age-related scattergrams of RVs for TG and ALP were drawn in three ways. Plotted in Graph A were RVs of all ethnic groups which were made traceable to the reference measurement pro-cedures (RMPs) based on the assigned values in the panel: i.e., all the RVs of each ethnic group were aligned to the assigned values of the serum panel. In Graph B, RVs made traceable to RMPs were plotted only when test results of other related analytes were within respective RIs. In Graph C, RVs of each ethnic groups after applying the LAVE meth-od were aligned to those of China (CHN) by adjusting for the difference of its median from that of China. The horizontal broken lines are shown as a guide for ease of comparison. Thefinal adjusted gender- and age-profiles are shown in Suppl. Fig. 3 for major analytes.
4. Discussion
This primary study for derivation of RIs provides us with a good op-portunity to analyze potential biological SVs of RVs among healthy indi-viduals. Conventionally, gender and age are the only SVs considered because they are often strong enough to require partitioning RVs. Not much attention has been paid to other biological SVs such as BMI, alco-hol consumption, cigarette smoking, exercise, food preferences, men-strual cycle, ABO blood groups, etc. This situation may be attributable to an insufficient sample size or lack of knowledge or facility for performing the analyses. In fact, no description is given in the Clinical and Laboratory Standards Institute (CLSI) guideline[9]regarding the method to be used for the analysis, and major RI studies in the past have not included SV analysis[10,11]. Reliable analysis of SVs cannot be done by simple stratification of the RVs. The need for multiple linear regression analysis (MRA) for the purpose wasfirst described by Ichihara and Kawai when they looked into factors for partitioning RVs and encountered problems of interaction and confounding phenomena of gender on RVs[12]. The theoretical aspect of these phenomena was described elsewhere[4,5]. After thefirst report, a series of papers on
for smoking
for alcohol drinking
M: male; F: female
0.35 0.25 0.35
0.25 −0.35−0.25
−0.25
3-3
−0.35 [image:6.595.93.491.55.284.2]RI studies which included MRA for exploration of SVs as an integral part of the study were published[1,13–17]. The analyses targeting the same SVs as in this study (BMI, smoking, and alcohol consumption) are avail-able in[1,12–15,17]. Additionally, the association of ABO blood group on RVs was evaluated in the RI study for isozymes of ALP, LDH, and AMY
[16]and menstrual cycle related changes were reported on 85 major laboratory tests[18]as a secondary analysis of the 2009 Asian study on RVs[2,3].
The effects of additional biological SVs, such as ethnicity and the geo-graphical effect on RVs are of interest, but these studies can be achieved only by building international collaborations. Therefore, there are very
few investigations reported so far which were conducted as primary studies for deriving RIs[1,2,10,11,19]. On the other hand, there have been a large number of publications comparing laboratory tests results among multiple ethnic groups. These were, however, conducted as a part of large epidemiological studies aiming at uncovering risk factors for common disorders like the metabolic syndrome, cardiovascular dis-eases, diabetes, hypertension, and steatohepatitis. The target popula-tions were those that had an increased likelihood of contracting the highly prevalent diseases, and thus, the sampling schemes used were “random population based sampling”. Therefore, unlike the current ref-erence interval study, they were not based on the concept of
ARG Y= -0.133X+49.1 CHN Y= -0.113X+51.2 ZA/Af Y= -0.105X+45.9
JPN Y= -0.105X+50.6 USAY= -0.100X+49.3 RUS Y= -0.088X+48.8
ZA/NAf Y=-0.081X+46.6 PHLY= -0.079X+47.9 SAUY= -0.056X+46.1
GBRY= -0.041X+46.4
r= -0.39
r= -0.49
r= -0.34
r= -0.54
r= -0.48
r= -0.47
r= -0.32
r= -0.35
r= -0.23
r= -0.14
Age
Age
Age
Alb
g/L
Alb
g/L
Alb
g/L
Alb
g/L
(-0.168 ~ -0.099) (-0.123 ~ -0.102) (-0.142 ~ -0.068)
(-0.124 ~ -0.085) (-0.117 ~ -0.082) (-0.105 ~ -0.072)
(-0.115 ~ -0.047) (-0.109 ~ -0.049) (-0.083 ~ -0.030)
[image:7.595.81.517.169.696.2](-0.093 ~ 0.011)
Fig. 4.Comparison of age-related change in RVs among ethnic groups. In panel 4-1, the relationship between age and RVs of male Alb is shown for each ethnic group. The least-squares
regression line was computed and its equation is shown on top of each graph to allow comparison of slopes among the ethnic groups. Shown below each slope in red letter is its 95% CI. The simple correlation coefficient (r) is shown at the right bottom. In panel 4-2, the relationships between age and RVs of female ALP were plotted. The significance of age related changes was expressed as SDR, computed by one-way ANOVA after partitioning RVs into three age groups by setting boundaries at 35 and 50 years of age. (For interpretation of the references to color in thisfigure legend, the reader is referred to the web version of this article.)
“healthiness”but included individuals who might have the latent dis-eases targeted by the studies. Examples include a large scale multina-tional study like the INTERHEART study which involved 52 countries
around the world and aimed at elucidation of risk factors such as serum lipids for myocardial infarction[20–22]; or nationwide studies in the United States with balanced sampling from multiple ethnic
ALP
U/L
ALP
U/L
ALP
U/L
ALP
U/L
ALP
U/L
SDR=0.66
CHN JPN SDR=0.56 PHL SDR=0.41
IND SDR=0.34 PAK SDR=0.17 SAU SDR=0.27
TUR SDR=0.55 RUS SDR=0.68
ZAF/Af SDR=0.31 ZAF/NAf SDR=0.46 USA SDR=0.33
ARG SDR=0.34
GBR SDR=0.48
Age
Age
Age
n=1549 n=324 n=502
n=246 n=247 n=416
n=1466 n=381 n=182
n=290 n=366 n=423
n=214
[image:8.595.76.512.48.668.2]ZA/NAf
Y=
0.091
X+0.55
JPN
Y=
0.069
X+1.80
CHN
Y=
0.064
X+1.82
ARG
Y=
0.060
X+1.85
GBR
Y=
0.057
X+1.67
PHL
Y=
0.056
X+1.83
RUS
Y=
0.054
X+1.95
IND
Y=
0.053
X+2.22
TUR
Y=
0.038
X+2.28
SAU
Y=
0.021
X+2.80
PAK
Y=
0.014
X+2.71
USA
Y=
0.010
X+3.05
ZA/Af
Y=
0.003
X+2.19
r=0.48
r=0.36
r=0.34
r=0.43
r=0.37
r=0.39
r=0.45
r=0.36 r=0.26
r=0.19
r=0.12
r=0.08
r=0.02
ALT
U/L
ALT
U/L
ALT
U/L
ALT
U/L
ALT
U/L
BMI
kg/m
2BMI
kg/m
2BMI
kg/m
2(0.066 ~ 0.116) (0.047 ~ 0.090) (0.054 ~ 0.073)
(0.043 ~ 0.077) (0.035 ~ 0.079) (0.039 ~ 0.074)
(0.044 ~ 0.065) (0.036 ~ 0.069) (0.031 ~ 0.045)
(0.012 ~ 0.030) (0.000 ~ 0.028) (-0.001 ~ 0.022)
[image:9.595.88.517.40.693.2](-0.011 ~ 0.017)
Fig. 5.Comparison of BMI-related changes in RVs among ethnic groups. In panel 5-1, the relationship between BMI and RVs of ALT in males (in logarithmic scale) is shown for each ethnic
group. The least-square regression line was computed and its equation is shown on top of each graph to allow comparison of slopes among the ethnic groups. Shown below each slope in red letters is its 95% CI. The simple regression coefficient (r) is shown at the right bottom. The same analyses were done for HDL-C and CRP as shown in panels 5-2, and 5-3, respectively. Other male results for UA, TG, and GGT, and female results for all six analytes are available in Suppl. Fig. 1. (For interpretation of the references to color in thisfigure legend, the reader is referred to the web version of this article.)
groups such as the National Health and Nutrition Examination Survey (NHANES)[23,24]and the Women's Health Study[25], or in Canada the Study of Health Assessment and Risk in Ethnic groups (SHARE)
[26]. These studies targeted the analysis of multiple serum risk factors for common diseases. Numerous epidemiological studies for elucidation of health-related risk factors were also done in local multiracial commu-nities of Framingham[27], Dallas[28], London[29], Manchester[30], and Newcastle[31]. These studies are cited below in the discussion of ethnicity-related changes in RVs.
On the other hand, in this global project on RVs, we adopted a“ con-venience sampling”scheme, targeting those who were easily accessible from hospitals and clinical laboratories. Therefore, epidemiologists may criticize that the reference individuals do not represent minor social
groups with special occupations, economic conditions, or ethnicity. However, the study on RVs needs to focus on the status of“healthiness” in volunteers who fulfill pre-defined conditions, and, in this particular project, who do not possess multiple abnormal results in major labora-tory test results. Therefore, presumptive test results from minor sub-groups would have negligible effect on data analysis due to their small size or would form a cluster of abnormal results but be excluded by ap-plication of the LAVE method. From this perspective, our international collaborative study is thefirst comprehensible one which uncovered ethnic differences in“health-associated”RVs in a global scale.
As for representation of ethnic groups within each country, the sam-pling scheme is far from ideal for multiracial countries like the US and the UK with coverage of just three cities (Rochester, MN; Salt Lake
HDL-C
mmol/L
HDL-C
mmol/L
HDL-C
mmol/L
HDL-C
mmol/L
JPN
Y=
-0.050
X+2.6
CHN
Y=
-0.025
X+1.8
USA
Y=
-0.024
X+1.9
RUS
Y=
-0.016
X+1.7
ARG
Y=
-0.015
X+1.6
IND
Y=
-0.014
X+1.5
ZA/NAf
Y=
-0.010
X+1.6
PHL
Y=
-0.010
X+1.4
SAU
Y=
-0.009
X+1.4
ZA/Af
Y=
-0.009
X+1.5
TUR
Y=
-0.008
X+1.3
PAK
Y=
-0.004
X+1.3
r= -0.39
r= -0.30
r= -0.34
r= -0.30
r= -0.24
r= -0.25
r= -0.15
r= -0.16
r= -0.19
r= -0.16
r= -0.13
r= -0.05
BMI
kg/m
2BMI
kg/m
2BMI
kg/m
2(-0.063 ~ -0.037) (-0.029 ~ -0.02) (-0.030 ~ -0.017)
(-0.023 ~ -0.010) (-0.022 ~ -0.008) (-0.021~ -0.007)
(-0.022 ~ 0.001) (-0.018 ~ -0.002) (-0.013 ~ -0.004)
(-0.015 ~ -0.002) (-0.011 ~ -0.005) (-0.013 ~ 0.005)
[image:10.595.77.512.50.568.2]City, UT; Davis, CA) in the US and one (Leeds) in the UK. We need to ac-cept that the RVs just represent the Caucasian population, which consti-tutes a vast majority. On the other hand, in South Africa, the sampling was separately conducted in three ethnic groups: African, Caucasian, and mixed origin (Chinese, Indian, etc.). Due to a lack of sufficient data for the third group and similarity of the last two, the data analyses for South Africa were done in two ethnic groups: African and Non-African as representative of the country.
For other countries, ethnic compositions are regarded as repre-sentative of each country because of the following reasons. In Tur-key and China, the sampling was carried out nationwide and no
regional differences were noted as a whole[15,17]. In Saudi Arabia, Japan, and Russia, the sampling was done in geographically distinct major cities but all subjects were from a single ethnic group. In the Philippines, Pakistan, India, and Argentina, only individual cities were covered but the population sampled was representative of each country.
Among the multitude of biological SVs evaluated in this study gen-der, age and BMI are the three most important ones. Age-related chang-es in RVs proved to be a universal phenomenon regardlchang-ess of the countries as shown inFig. 3-1. With the availability of a large number of RVs from 12 countries, it became possible to compile all of them
JPN
Y=
0.114
X-3.45
IND
Y=
0.113
X-2.30
CHN
Y=
0.109
X-2.92
USA
Y=
0.105
X-2.97
RUS
Y=
0.105
X-2.81
SAU
Y=
0.102
X-2.29
ZA/Af
Y=
0.077
X-1.10
ZA/NAf
Y=
0.073
X-1.51
TUR
Y=
0.061
X-1.08
PHL
Y=
0.061
X-1.26
CRP
mg/L
CRP
mg/L
CRP
mg/L
CRP
mg/L
BMI
kg/m
2r=0.35
r=0.26
r=0.42
r=0.40
r=0.47
r=0.36
r=0.27
r=0.20
r=0.20
r=0.25
BMI
kg/m
2BMI
kg/m
2(0.065 ~ 0.162) (0.072 ~ 0.153) (0.088 ~ 0.130)
(0.078 ~ 0.132) (0.082 ~ 0.127) (0.083 ~ 0.121)
(0.051 ~ 0.104) (0.027 ~ 0.119) (0.020 ~ 0.101)
(0.019 ~ 0.102)
Fig. 5 (continued).
[image:11.595.87.518.50.563.2]and delineate gender and age-specific profiles by three steps: (1) align-ment of values either to assigned values or to China, (2) removal of po-tentially abnormal values by applying the LAVE method, and (3) adjusting RVs to those of China based on the difference in medians
[image:12.595.98.494.53.661.2]between China and the country concerned as shown in Suppl. Fig. 3. Thefigures are of great relevance in interpreting the RVs appropriately in consideration of gender and age. From thefigures, it is apparent that almost all analytes have specific profiles of its own.
Fig. 6.BMI-adjusted comparison among the ethnic groups. Distributions of RVs for male TG (the top panel) and female HDL-C (the bottom panel) after alignment to the assigned values
The majority of the analytes show gender-differences in RVs. The most prominent ones were observed for UA, Cre, HDL-C, ALT, GGT, CK, and IgM, whereas moderate degrees of gender-differences were ob-served in Alb, urea, TG, IP, Fe, AST, ALP, C3, and Tf. It is notable that fe-males generally have much more pronounced age-related changes in RVs than males, especially after menopause as indicated by generally higher partial correlation coefficients for age (Suppl. Fig. 4-1). This is es-pecially true for urea, UA, IP, AST, ALT, ALP, LDH, GGT, CK, IgM, and Tf (all Pb0.0001 by pairedt-test). In contrast, Alb showed more prominent re-duction with age in males (Pb0.0001) than in females.
The third important biological SV is BMI. It showed obvious associa-tion with RVs for many analytes, especially those representing the sta-tuses of nutrition and inflammation as shown in Suppl. Fig. 4-2. It is of note that BMI-related changes in RVs of ALP and AMY were more prom-inent in females (Pb0.001 andPb0.005, respectively). This is attributed to an easily noticeable linear relationship of BMI with RVs of liver ALP (ALP2) and pancreatic AMY only in females as reported by Shimizu and Ichihara[16]. Contrastingly, the associations of BMI with ALT and GGT (Pb0.001), and AST (Pb0.01) were more prominent in males (Pb0.001). No gender difference in BMI related changes was observed for HDL-C and UA.
The most impressivefindings of this study regarding biological sources of variations are between ethnic differences in BMI-related changes in RVs as shown inFig. 5and in Suppl. Fig. 1. Thesefigures show different slopes for the regression lines between BMI (x) and RVs (y) among the countries—e.g.,: for ALT, HDL-C, TG, and UA. The lines were very steep for some countries (implying a slight change in BMI results in a large change in test values). In sharp contrast, the lines were veryflat for other countries (no change of values by the change of BMI). As an exceptional case, CRP showed fairly consistent re-lationships with BMI among the countries.
However, it should be noted that these ethnic differences in the slope of the BMI–RV relationship cannot be predicted from rpcomputed by MRA, because rpjust indicates how tight the linear relationship
between BMI and RVs is and thus does not always indicate the steepness of the linear relationship.
This fact clearly indicates that comparisons of between-country dif-ferences of the RVs requires country by country adjustment according to the BMI-RV relationship. However, in a practical sense, the BMI adjusted comparison shown in Suppl. Fig. 3 indicates that the adjustment result-ed in almost negligible changes in SDR for between-ethnic group differences.
With this confirmation, we can now turn to discuss the results shown inFig. 3and Suppl. Fig. 1-1 and 1-2 of thefirst part of the report of this study[8]. Judging from thosefigures, the most important findings are the lack of practically important degrees of between-ethnic group differences (SDRb0.3) in males for UA, TC, TG, IP, Fe, AST, LDH, ALP, GGT, IgA, IgM, and Tf, and in females for TG, IP, LDH, ALP, IgM, and Tf. This information points to the feasibility of sharing RVs around the world for those commonly tested analytes, although extreme environmental, geographical or dietary factors might have to be considered in some situations. In any case, since this is an interim re-port of the worldwide campaign, we plan to derive globally applicable common RIs after results fromfive other countries become available in 2016.
On the other hand, we identified obvious between ethnic group dif-ference (SDR≥0.4) in males for TP, Alb urea, TBil, HDL-C, Mg, CRP, IgG, C3, Insulin, Vit. B12, and folate, and in females for TP, Alb, Cre, TBil, HDL-C, Mg, ALT, GGT, CRP, IgG, C3, C4, PTH, Vit. B12, and folate. Among those analytes, the underlined ones have been already documented in the 2009 East and Southeast Asian multicenter study for derivation of com-mon RIs[2,3]. Thesefindings were confirmed by ourfindings in the global study.
For CRP, there have been many epidemiological reports on between ethnic differences in serum CRP because it has been implicated as a risk factor for cardiovascular diseases[24,25,32–36]. In most reports, South Asians from India, Bangladesh, Pakistan, and African American have higher levels of CRP even after adjustment for BMI[33,35]. In contrast,
A:
LAVE(−)
B:
LAVE(+)
C:
Aligned to CHN
A:
LAVE(−)
B:
LAVE(+)
C:
Aligned to CHN
[image:13.595.73.530.54.321.2]100 1.7
Fig. 7.Effect of the LAVE method and adjustment for between-country differences on the gender- and age-related profiles of RVs. Gender and age-related scattergrams of RVs for TG and
ALP were drawn in three ways. Plotted in Graph A (blue: males; red: females) are the RVs for all the ethnic groups which were made traceable to the RMPs based on the assigned values in the panel;i.e., all the RVs of each ethnic group were aligned to the assigned values of the serum panel. In Graph B, RVs made traceable to RMPs were plotted only when test results of other related analytes were within the respective RIs. In Graph C, RVs of each ethnic groups after applying the LAVE method were aligned to those of China (CHN) by adjusting for the difference of the medians from that of China. The horizontal broken lines are shown as a guide for ease of comparison.
CRP is low in Chinese and Japanese living in the USA[25,32]. Socioeco-nomic status is implicated as an additional factor for the elevated CRP in the multiracial community[24]. In the 2009 Asian study, healthy vol-unteers from Vietnam, Malaysia, and Indonesia had significantly higher values, and Japanese and Koreans had much lower values[2]. Since IgG, C3, and C4 were also higher in South Asian, the elevated CRP was attrib-uted to increased activity of infectious agents in the area near the equa-tor. In this study, we confirmed higher CRP levels in African and South African populations in contrast to the non-African population in both genders. Higher CRP was also observed in Pakistan, India, and Turkey, while lower CRP was observed in China and Japan. With regard to the slope of BMI vs CRP, it is very impressive to note that between-ethnic group differences in the slope were very small compared with those ob-served for other analytes considered to be nutritional risk factors: UA, ALT, TG, HDL-C, and GGT. Therefore, elevated CRP can be interpreted without adjustment for BMI.
Regarding ALT, the Asian study showed no ethnic difference, but this study revealed very low ALT levels in South African populations, which led to higher SDR for between ethnic group differences in ALT. However, removal of the African group lowered the SDR. It has been already well documented that African Americans have very low ALT and thus are less susceptible to non-alcoholic fatty liver disease[28,36–38]. In fact, no as-sociation was found between BMI and ALT in this study for the African group in South Africa (Fig. 5).
The same phenomenon was observed for LDL-C: The Asian study showed no ethnic difference but this study showed very low LDL-C in the African group in South Africa. Removal of the African group again led to SDRb0.3 in both genders.
For HDL-C, a strong ethnic difference was confirmed in this study with tendency of very high level (especially among women) in Japan and China, but very low levels were recorded in volunteers from India, Pakistan, Turkey and South Africa (African population). The same trend of low HDL-C has been documented in South Asians[26,30,31].
5. Conclusion
Analyses of between-ethnic group differences in laboratory tests have been heretofore performed primarily as a part of epidemiological studies for prevention of common diseases. However, volunteers for these studies were recruited by use of population based sampling with-out attention being paid to the status of“healthiness”. Therefore, a sub-stantial number of individuals with latent diseases was included. On the other hand, in reference interval studies, it is mandatory to choose indi-viduals who are as healthy as possible. In this regard, the current study provided a great opportunity to elucidate“health”related RVs and allowed us an opportunity to compare them between ethnic groups as well as between gender, age, BMI, and other SVs.
Regarding gender and age-related changes in RVs, we have elucidat-ed them from a large number of healthy subjects after adjusting for be-tween-country differences and removal of individuals with latent diseases by use of the LAVE method. It became obvious that each analyte has its own specific gender and age-related profiles which may be more important in clinical practice thanfixed RIs derived without consider-ation of gender or age.
BMI was confirmed to have close associations with RVs of many analytes as has been previously reported in many epidemiological stud-ies. However, the most impressivefinding of this study was the be-tween-ethnic group differences in the steepness of relationships between BMI and RVs for UA, HDL-C, ALT, and GGT, which are important in order to understand why some ethnic groups have susceptibility to nutritionally related diseases.
Regarding the peculiar trends of RVs representing African popula-tion in South Africa, we need to confirm thefindings by integrating data from Kenya and Nigeria which will become available in 2016.
Supplementary data to this article can be found online athttp://dx. doi.org/10.1016/j.cca.2016.09.015.
Research funding
A Scientific Research Fund (No. 24256003: 2012-2014) provided by the Japan Society for the Promotion of Science (JSPS) was used to par-tially support local studies (to cover breakfast after sampling for volun-teers, personnel fee for recruitment and sampling, consumables such as sampling equipment) in India, Saudi Arabia, Philippines, US, and Argentina.
Conflict of interest statement
The authors state that there are no conflicts of interest with regard to publication of this article.
Acknowledgements
We are grateful to the collaborators who coordinated the local study, especially,
Dr. Ling Qiu (Peking Union Medical College, Beijing, China), Prof. Rajiv Erasmus (University of Stellenbosch and National Health Labora-tory Services, Tygerberg, South Africa), Dr. Anwar Borai (King Saud bin Abdulaziz University for Health Sciences, Jeddah, Saudi Arabia), Dr. Svetlana Evgina (Beckman Coulter LLC, Moscow, Russia), Dr. Irina Skibo (Helix Medical Laboratories, St. Petersburg), Dr. Tester Ashavaid (P. D. Hinduja National Hospital and Medical Research Center, Mumbai, India), Prof. Dilshad Khan (National University of Medical Sciences, Rawalpindi, Pakistan), Prof. Laura Schreier (Pharmacy and Biochemistry, University of Buenos Aires, Argentina), Reynan Roll (West Visayas State University Medical Center, Iloilo, Philippines), Ms. Ashley Bunker (ARUP Laboratories, Salt Lake City, UT, USA), Mr. Reo Kawano (Clinical Research Center, Yamaguchi University Hospital, Ube, Japan), Dr. David Armbruster (Abbott Laboratories, Abbott Park, IL, USA), and Kazuo Mori (Beckman Coulter Japan, Tokyo, Japan). Finally, we are grateful to Professor Andrew M. Johnson for his detailed scientific editing of this manuscript.
References
[1] K. Ichihara, Y. Itoh, C.W. Lam, et al., Sources of variation of commonly measured serum analytes in 6 Asian cities and consideration of common reference intervals, Clin. Chem. 54 (2008) 356–365.
[2] K. Ichihara, F. Ceriotti, T.H. Tam, et al., The Asian project for collaborative derivation of reference intervals: (1) strategy and major results of standardized analytes, Clin. Chem. Lab. Med. 51 (2013) 1429–1442.
[3] K. Ichihara, F. Ceriotti, K. Mori, Y. Huang, et al., The Asian project for collaborative derivation of reference intervals: (2) results of non-standardized analytes and trans-ference of retrans-ference intervals to the participating laboratories on the basis of cross-comparison of test results, Clin. Chem. Lab. Med. 51 (7) (2013) 1443–1457. [4] K. Ichihara, J.C. Boyd, An appraisal of statistical procedures used in derivation of
ref-erence intervals, Clin. Chem. Lab. Med. 48 (2010) 1537–1551.
[5] K. Ichihara, Statistical considerations for harmonization of the global multicenter study on reference values, Clin. Chim. Acta 432 (2014) 108–118.
[6] Y. Ozarda, K. Ichihara, J.H. Barth, et al., Protocol and standard operating procedures for common use in a worldwide multicenter study on reference values, Clin. Chem. Lab. Med. 51 (2013) 1027–1040.
[7] K. Ichihara, Y. Ozarda, G. Klee, et al., Utility of a panel of sera for the alignment of test results in the worldwide multicenter study on reference values, Clin. Chem. Lab. Med. 51 (2013) 1007–1025.
[8] Ichihara K, Ozarda Y, Barth JH, et al. (in press) A global multicenter study on refer-ence values: 1. Assessment of methods for derivation and comparison of referrefer-ence intervals. Clin. Chim. Acta.
[9] IFCC, CLSI, EP28-A3c Document. Defining, Establishing and Verifying Reference In-tervals in the Clinical Laboratory: Approved Guideline, 3rd ed.28 No. 30. [10] P. Rustad, P. Felding, L. Franzsonc, et al., The Nordic Reference Interval Project 2000:
recommended reference intervals for 25 common biochemical properties, Scand. J. Clin. Lab. Invest. 64 (2004) 271–284.
[11] F. Ceriotti, J. Henny, J. Queraltó, et al., Common reference intervals for aspartate ami-notransferase (AST), alanine amiami-notransferase (ALT) andγ-glutamyl transferase (GGT) in serum: results from an IFCC multicenter study, Clin. Chem. Lab. Med. 48 (2010) 1593–1601.
[13]K. Ichihara, K. Saito, Y. Itoh, Sources of variation and reference intervals for serum cystatin C in a healthy Japanese adult population, Clin. Chem. Lab. Med. 45 (2007) 1232–1236.
[14] Y. Ozarda, K. Ichihara, D. Aslan, et al., A multicenter nationwide reference intervals study for common biochemical analytes in Turkey using Abbott analyzers, Clin. Chem. Lab. Med. 52 (2014) 1823.
[15] A. Borai, K. Ichihara, A. Masoud, et al., Establishment of reference intervals of clinical chemistry analytes for adult population in Saudi Arabia: a study conducted as a part of the IFCC global study on reference values, Clin. Chem. Lab. Med. 54 (2016) 843–855.
[16] Y. Shimizu, K. Ichihara, Sources of variation analysis and derivation of reference in-tervals for ALP, LDH, and amylase isozymes using sera from the Asian multicenter study on reference values, Clin. Chim. Acta 446 (2015) 64–72.
[17] L. Xia, L. Qiu, X. Cheng, et al., Nationwide multicenter reference interval study for 28 common biochemical analytes in China, Medicine 95 (2016), e2915.
[18] S. Masuda, K. Ichihara, H. Yamanishi, et al., Evaluation of menstrual cycle-related changes in 85 clinical laboratory analytes, Ann. Clin. Biochem. 53 (2016) 365–376.
[19] P. Rustad, P. Felding, A. Lahti, P.P. Hyltoft, Descriptive analytical data and conse-quences for calculation of common reference intervals in the Nordic Reference In-terval Project 2000, Scand. J. Clin. Lab. Invest. 64 (2004) 343–369.
[20] S. Yusuf, S. Hawken, S. Ôunpuu, et al., Obesity and the risk of myocardial infarction in 27 000 participants from 52 countries: a case-control study, Lancet 366 (2005) 1640–1649.
[21] S. Yusuf, S. Hawken, S. Ôunpuu, T. Dans, Effect of potentially modifiable risk factors associated with myocardial infarction in 52 countries (the INTERHEART study): case-control study, Lancet 364 (2004) 937–952.
[22] M.J. McQueen, S. Hawken, X. Wang, et al., Lipids, lipoproteins, and apolipoproteins as risk markers of myocardial infarction in 52 countries (the INTERHEART study): a case-control study, Lancet 372 (2008) 224–233.
[23]D.E. Alley, T.E. Seeman, J. Ki Kim, A. Karlamangla, P. Hu, E.M. Crimmins, Socioeco-nomic status and C-reactive protein levels in the US population: NHANES IV, Brain Behav. Immun. 20 (2005) 498–504.
[24]T. Seemana, S.S. Merkina, E. Crimminsb, B. Koretza, S. Charettea, A. Karlamanglaa, Education, income and ethnic differences in cumulative biological risk profiles in a national sample of US adults: NHANES III (1988–1994), Soc. Sci. Med. 66 (2008) 72–87.
[25] M.A. Albert, R.J. Glynn, J. Buring, P.M. Ridker, C-reactive protein levels among women of various ethnic groups living in the United States (from the Women's Health Study), Am. J. Cardiol. 93 (2004) 1238–1242.
[26] S.S. Anand, S. Yusuf, V. Vuksan, et al., Differences in risk factors, atherosclerosis, and cardiovascular disease between ethnic groups in Canada: the Study of Health As-sessment and Risk in Ethnic groups (SHARE), Lancet 356 (2000) 279–284. [27]R.B. D'Agostino Sr., S. Grundy, L.M. Sulivan, P. Wilson, CHD risk prediction group.
Validation of the Framingham coronary heart disease prediction scores: results of a multiple ethnic groups investigation, JAMA 286 (2001) 180–187.
[28]J.D. Browning, L.S. Szczepaniak, R. Dobbins, P. Nuremberg, Prevalence of hepatic steatosis in an urban population in the United States: impact of ethnicity, Hepatology 40 (2004) 1387–1395.
[29] F. Cappuccio, D. Cook, R. Atkinson, et al., Prevalence, detection, and management of cardiovascular risk factors in different ethnic groups in south London, Heart 78 (1997) 555–563.
[30]M.W. France, S. Kwok, P. McElduff, C.J. Seneviratne, Ethnic trends in lipid tests in general practice, Q. J. Med. 96 (2003) 919–923.
[31]R. Bhopal, N. Unwin, M. White, et al., Heterogeneity of coronary heart disease risk factors in Indian, Pakistani, Bangladeshi and European populations: cross-sectional study, BMJ 319 (1999).
[32]A. Kelley-Hedgepeth, D.M. Lloyd-Jones, A. Colvin, Ethnic differences in C-reactive protein concentrations, Clin. Chem. 54 (2008) 1027–1037.
[33] S.S. Anand, F. Razak, Q. Yi, et al., C-reactive protein as a screening test for cardiovas-cular risk in a multiethnic population, Arterioscler. Thromb. Vasc. Biol. 24 (2004) 1509–1515.
[34] N.J. Timpson, D.A. Lawlor, R.M. Harbord, C-reactive protein and its role in metabolic syndrome: mendelian randomisation study, Lancet 366 (2005) 1954–1959. [35]A. Nazmi, C.G. Victora, Socioeconomic and racial/ethnic differentials of C-reactive
protein levels: a systematic review of population-based studies, BMC Public Health 7 (2007) 212.
[36] J.J. Pan, M.B. Fallon, Gender and racial differences in nonalcoholic fatty liver disease, World J. Hepatol. 6 (2014) 274–283.
[37] S.R. Mohanty, T.N. Troy, D. Huo, B.L. O'Brien, D.M. Jensen, J. Hart, Influence of ethnic-ity on histological differences in non-alcoholic fatty liver disease, J. Hepatol. 50 (2009) 797–804.
[38] R. Guerrero, G.L. Vega, S.M. Grundy, J.D. Browning, Ethnic differences in hepatic steatosis: an insulin resistance paradox? Hepatology 49 (2009) 791–801.