This is a repository copy of
Conceptual design of the early implementation of the NEutron
Detector Array (NEDA) with AGATA
.
White Rose Research Online URL for this paper:
http://eprints.whiterose.ac.uk/101631/
Version: Accepted Version
Article:
Hüyük, Tayfun, Di Nitto, Antonio, Jaworski, Grzegorz et al. (23 more authors) (2016)
Conceptual design of the early implementation of the NEutron Detector Array (NEDA) with
AGATA. European Physical Journal A : Hadrons and Nuclei. 55. ISSN 1434-601X
https://doi.org/10.1140/epja/i2016-16055-8
[email protected]
Reuse
This article is distributed under the terms of the Creative Commons Attribution-NonCommercial-NoDerivs
(CC BY-NC-ND) licence. This licence only allows you to download this work and share it with others as long
as you credit the authors, but you can’t change the article in any way or use it commercially. More
information and the full terms of the licence here: https://creativecommons.org/licenses/
Takedown
If you consider content in White Rose Research Online to be in breach of UK law, please notify us by
Conceptual design of the early implementation of the NEutron
Detector Array (NEDA) with AGATA
Tayfun H¨
uy¨
uk
Instituto de F´ısica Corpuscular, CSIC - Universidad de Valencia,
E-46980 Paterna (Valencia), Spain
Antonio Di Nitto
Istituto Nazionale di Fisica Nucleare, Sezione di Napoli, I-80126 Napoli, Italy
Johannes Gutenberg-Universit¨at Mainz, D-55099 Mainz, Germany
Grzegorz Jaworski
Istituto Nazionale di Fisica Nucleare, Laboratori Nazionali di Legnaro,
I-35020 Legnaro (PD), Italy
Andr´es Gadea
Instituto de F´ısica Corpuscular, CSIC - Universidad de Valencia,
E-46980 Paterna (Valencia), Spain
Jos´e Javier Valiente-Dob´on
Istituto Nazionale di Fisica Nucleare, Laboratori Nazionali di Legnaro,
I-35020 Legnaro (PD), Italy
Johan Nyberg
Department of Physics and Astronomy, Uppsala University, SE-75120 Uppsala, Sweden
Marcin Palacz
Heavy Ion Laboratory, University of Warsaw, 02-093 Warsaw, Poland
P¨ar-Anders S¨oderstr¨om
RIKEN Nishina Center, 351-0198 Saitama, Japan
Ramon Jose Aliaga-Varea
Instituto de F´ısica Corpuscular, CSIC - Universidad de Valencia,
E-46980 Paterna (Valencia), Spain
I3M, Universidad Polit´ecnica de Valencia, E-46022 Valencia, Spain
Giacomo de Angelis
Ay¸se Ata¸c
Department of Physics, Faculty of Sciences, Ankara University, 06100 Ankara, Turkey
The Royal Institute of Technology, SE-10691 Stockholm, Sweden
Javier Collado
Department of Electronic Engineering, University of Valencia,
E-46100 Burjassot (Valencia), Spain
Cesar Domingo-Pardo
Instituto de F´ısica Corpuscular, CSIC - Universidad de Valencia,
E-46980 Paterna (Valencia), Spain
Francisco Javier Egea
Department of Electronic Engineering, University of Valencia,
E-46100 Burjassot (Valencia), Spain
Nizamettin Erduran
Faculty of Engineering and Natural Sciences, Istanbul Sabahattin
Zaim University, 34303 Istanbul, Turkey
Sefa Ert¨
urk
Department of Physics, Faculty of Science and Arts,
University of Nigde, 51240 Ni˘gde, Turkey
Gilles de France
GANIL, CEA/DSAM and CNRS/IN2P3, F-14076 Caen, France
Rafael Gadea
I3M, Universidad Polit´ecnica de Valencia, E-46022 Valencia, Spain
Vicente Gonz´alez
Department of Electronic Engineering, University of Valencia,
E-46100 Burjassot (Valencia), Spain
Vicente Herrero-Bosch
I3M, Universidad Polit´ecnica de Valencia, E-46022 Valencia, Spain
Ay¸se Ka¸ska¸s
Department of Physics, Faculty of Sciences, Ankara University,
06100 Ankara, Turkey
Victor Modamio
Istituto Nazionale di Fisica Nucleare, Laboratori Nazionali di Legnaro,
I-35020 Legnaro (PD), Italy
Marek Moszynski
Enrique Sanchis
Department of Electronic Engineering, University of Valencia,
E-46100 Burjassot (Valencia), Spain
Andrea Triossi
Istituto Nazionale di Fisica Nucleare, Laboratori Nazionali di Legnaro,
I-35020 Legnaro (PD), Italy
Robert Wadsworth
Department of Physics, University of York,
Heslington, YO10 5DD York, United Kingdom
June 20, 2016
Abstract
The NEutron Detector Array (NEDA) project aims at the construction of a new high-efficiency compact neutron detector array to be coupled with largeγ-ray arrays such as AGATA. The application of NEDA ranges from its use as selective neutron multiplicity filter for fusion-evaporation reaction to a large solid angle neutron tagging device. In the present work, possible configurations for the NEDA coupled with the Neutron Wall for the early implementation with AGATA has been simulated, using Monte Carlo techniques, in order to evaluate their perfor-mance figures. The goal of this early NEDA implementation is to improve, with respect to previous instruments, efficiency and capability to select multiplicity for fusion-evaporation reac-tion channels in which 1, 2 or 3 neutrons are emitted. Each NEDA detector unit has the shape of a regular hexagonal prism with a volume of about 3.23 litres and it is filled with the EJ301 liquid scintillator, that presents good neutron-γdiscrimination properties. The simulations have been performed using a fusion-evaporation event generator that has been validated with a set of experimental data obtained in the58
Ni + 56
Fe reaction measured with the Neutron Wall detector array.
1
Introduction
Contemporary nuclear physics experiments aim to investigate the structure of exotic nuclei lying far from the valley ofβstability. One of the most successful methods for producing such exotic nuclei is to use fusion-evaporation reactions with stable or radioactive beams and stable targets. The most exotic neutron-deficient nuclei are produced in extremely weak reaction channels after the emission of two or more neutrons from the compound nuclei. In order to perform high resolutionγ-ray spectroscopy of such exotic systems, as for instance in the case of92
Pd [1], the identification of the reaction channel requires, in addition to the high efficiency and selectivity, the determination of the neutron multiplicity. In neutron detectors like NEutron Detector Array (NEDA), one of the major critical issues in the determination of the neutron multiplicity is the scattering of neutrons between the different detectors of the array. The neutron scattering gives rise to signals in more than one detector, creating an ambiguity in the actual number of neutrons detected (neutron cross-talk). One important goal in the design of new neutron detection filters, such as NEDA, is to minimise the neutron cross-talk and to increase the efficiency for detecting 2 or 3 neutrons compared to existing arrays, e.g. the Neutron Wall [2, 3] and the Neutron Shell [4].
ex-pended recently in studying digital timing [7], fast digital data acquisition cards [8] and digital pulse shape discrimination [9, 10].
The size of the single detector unit and the scintillation material used for the neutron de-tection are important factors in order to optimise the performance of the full array. A detailed study, using Monte Carlo simulations of a detector unit filled with liquid scintillator, reported the optimum size that is sufficient for the detection of neutrons typically emitted in fusion-evaporation reactions [11]. The outcome of that work was used to decide the dimensions of a single NEDA detector.
This paper is organised as follows: In Sec. 2 the description of the NEDA detectors will be presented in more detail. In Sec. 3, the simulations to evaluate the performance of the first implementation of NEDA together with the Neutron Wall will be discussed. The geometry will be defined in Sec. 4. The simulations performed to determine the neutron efficiency for the cases of isotropic emission from the252
Cf source and for a fusion-evaporation reaction, are presented and discussed in the same section.
2
Design of the NEDA detectors
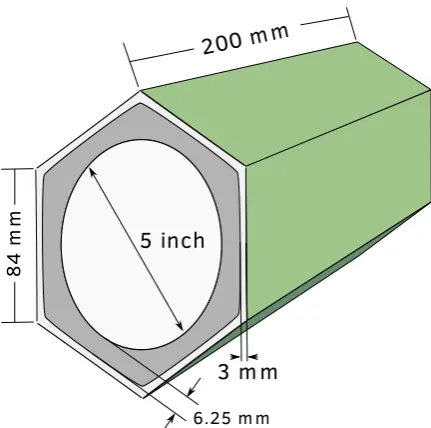
NEDA is conceptually designed as a flexible array with identical detector units able to adapt to different experimental setups. It is expected to be coupled with complementary Ge detector instrumentation like AGATA [12], EXOGAM2 [13] or GALILEO [14]. A regular hexagon was chosen as the starting point for the design of the NEDA geometry since it is the most suitable polygon for both clustering detectors and coupling to a circularly shaped photomultiplier tube (PMT), minimising the uncovered area by the PMT. NEDA detectors will have the shape of a uniform hexagonal prism, see Fig. 1. The optimum depth of the detector units, evaluated usingGeant4simulations, is 20 cm as discussed in Ref. [11]. The side length of the hexagon is
84 mm, suitable for the largest commonly available photomultiplier tubes with 5 inch diameter. The volume of each detector is 3.23 litres to be filled with EJ301 liquid scintillator. An aluminium canning with a thickness of 3 mm is used in order to provide sufficient mechanical stability of the detector.
The broad experimental conditions expected for NEDA, using both stable and radioactive high intensity beams, require a modular concept of the overall design. In addition to modularity, three basic conditions are to be considered for the design of the array, that have implications in the design of the detectors:
1. Efficiency: to be maximised within the geometrical coverage.
2. Target-to-detector distance: large enough for neutron-γdiscrimination by Time-Of-Flight (TOF)
3. Granularity: to maximize the efficiency for the reaction channels with neutron multiplicity is at least 1.
The possibility to have a flexible array that can change the distance between the target and the detectors, make this array more adaptable to the needs of the different physics cases. It allows to improve the neutron-γ discrimination based on TOF measurements, but also to increase the neutron energy resolution. Clearly, increasing the distance to the target would require a sizeable number of additional detectors for the same angular coverage.
3
Monte Carlo simulations and analysis procedure
200
m m
8
4
m
m
5 inch
6.25 m m
[image:6.595.189.405.103.317.2]3 m m
Figure 1: Schematic picture of the NEDA detector unit (color online).
ASP was chosen since it is compatible with the existing simulations of AGATA and otherγ-ray detector arrays. With the ASP, it is possible to implement different geometrical configurations into the simulations and to select a number of essential parameters, e.g. detector material, source position, angular distribution of emitted particles, etc. The performance of the proposed array has been simulated for a252
Cf source that emits neutrons isotropically and for the fusion-evaporation reaction58
Ni +56
Fe in which the neutrons are distributed according to the reaction kinematics. InGeant4the physical conditions of the simulations are mimicked by the so called
“event generator”, which will be introduced in the next subsection.
3.1
Event generators
As mentioned before, two different event generators have been used, one corresponding to a252
Cf source emitting neutrons isotropically and the other to a realistic fusion-evaporation reaction. The neutron energy distribution of a252
Cf source was produced by the built-in event generator ofGeant4an by using the expression (see Eq. 1) deduced in Ref. [17] with T = 1.42 MeV and E given in MeV.
N(E) =E1/2
e−E/T. (1)
involving nuclei far from stability. The validation of this second event generator will be discussed in terms of neutron efficiency and angular distribution in the following subsection.
3.2
Verification of the fusion-evaporation reaction event
genera-tor
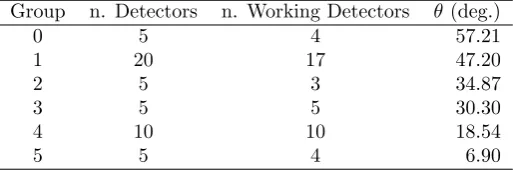
The modeling of a fusion-evaporation reaction is complex and depends on several parameters that are not always known. In order to validate our simulations, the event generator has been verified by comparing a Neutron Wall measurement with a simulation of the same setup. A representation of theGeant4model of the Neutron Wall system is shown in Fig. 2. In order to get a realistic comparison between the real data and the simulations, most of the materials between the target and the Neutron Wall were included, namely two concentric beam pipes of stainless steel with a thickness of 2 mm and a length of 250 mm together with a standard CF100 vacuum flange which were used as a beam dump in the experiment (see inset in Fig. 2). The energy loss inside the target was also taken into account. A data set measured with the Neutron Wall in which a58
Ni beam at 220 MeV impinging on a56
Fe target with a thickness of 10 mg cm−2
, was used for comparison. The choice of this reaction was motivated by the existence of a data set used earlier for the characterisation of the Neutron Wall detector array [3]. Moreover, the characteristics of this reaction are quite similar to those that we intend to use in future experiments with NEDA.
In the experiment, the Neutron Wall was coupled to the EUROBALLγ-ray spectrometer [22]. The trigger condition required at least two Compton-suppressed γ-rays in the HPGe detectors and there was no trigger condition on the Neutron Wall. The experimental energy threshold of the neutron detectors were determined using the calibration runs performed with a207
Biγ-ray source collected just before the experiment. The thresholds were determined for each Neutron Wall detector. The average value of the thresholds of the 43 operational detectors was determined to be 150 keVee. In order to validate the event generator we will make a comparison of the experimental TOF distributions measured in the aforementioned experiment for the various polar angles of the Neutron Wall with theGeant4simulations.
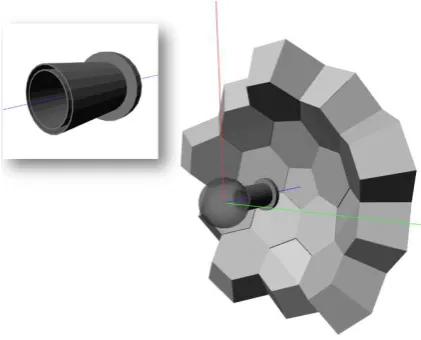
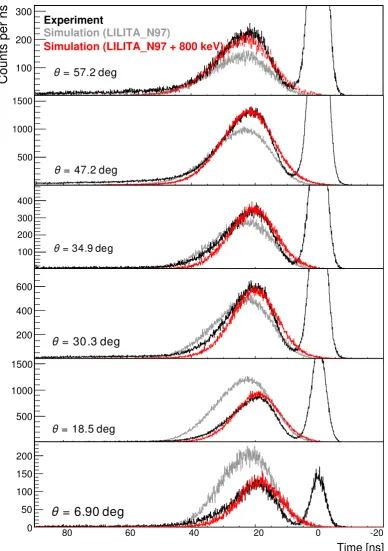
[image:7.595.168.425.527.612.2]Figure 3 shows the measured and simulated TOF spectra for the six differentθangles of the Neutron Wall, see Table 1. The experimental data were collected using a common stop for the neutron detectors, therefore the time axis runs from right to left. The center of theγ-ray time distribution has been taken as time reference (t = 0 ns in the spectra). The rescaling between experimental and simulated data was performed using the ratio between the total number of neutrons in the experimental and simulated TOF spectra.
Table 1: Grouping of the Neutron Wall detectors according to their polar angleθ.
Group n. Detectors n. Working Detectors θ(deg.)
0 5 4 57.21
1 20 17 47.20
2 5 3 34.87
3 5 5 30.30
4 10 10 18.54
5 5 4 6.90
The simulated spectra are obtained: i) using the measured experimental thresholds andii)
Figure 2: View of the Neutron Wall (light grey) with the beam pipe and beam dump after the target (dark grey) as modelled by Geant4. The inset in the upper left corner shows in some detail the materials used in the beam pipe and beam dump. The target is positioned in the center of the spherical reaction chamber.
fromA/12 toA/6 were considered in theLILITA N97code. The best agreement was obtained with a = A/8. Prescriptions with a dependency of the parameter a and of the symmetry energy on the neutron-proton mass asymmetry were not considered, because their effects are negligible on the inclusive neutron energy spectra and angular distributions. Nevertheless, these dependencies may be important for the determination of the neutron energy spectra for very exotic nuclei and the cross sections of the evaporation residues are predicted to be more affected [23]. However, these are beyond the scope of this publication and will be studied in a future work.
Large discrepancies between experimental and simulated data with plain results ofLILITA N97 are shown in Fig. 3. The discrepancy is especially large for the detectors at forward angles (θ <20◦). The reason for this is the simulated neutrons (grey spectra) have lower mean
ener-gies than the experimental ones (black spectra) as can be seen in Fig. 3 where the maximum of the experimental distribution is shifted to lower TOF values. Furthermore, the ratio between detected -simulated and experimental- number of neutrons is rather different at the smaller and larger polar angles. The ring at 6.9◦ shows the largest disagreement. In order to improve the
is quite good and therefore we conclude that the event generator can be used to determine the performance figures of NEDA for the fusion-evaporation reaction.
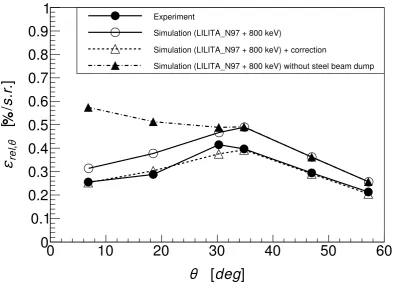
Figure 4 shows the experimental and simulated neutron differential detection efficiency as a function of the polar angleθ for the Neutron Wall. This relative neutron detection efficiency was calculated according the expression:
εrel,θ=ε1n
Nθ
NNW
1 Ωθ
, (2)
where ε1n is the efficiency to detect at least one-neutron, NNW the number of detected
neutrons in the whole array, Nθ the number of detected neutrons in the ring at angleθ and
Ωθ the solid angle covered by the detectors at that angle. The solid angle correction in Eq. 2
is necessary since the detector volume at every polar angle varies, and this effect needs to be excluded for a clearer comparison.
In the case of fusion-evaporation reactions, one would expect a monotonic decrease of the neutron efficiency as a function of theθ angle due to the neutron angular distribution in the laboratory reference system. However, as a result of the neutron scattering with the material of the beam dump shown in Fig. 2, there is a clear reduction of the relative efficiency at the forward angles both experimentally and in the simulations. The simulated and experimental curves show the same behaviour as a function ofθ. The experimental data points are, however, lower than the simulated ones by a constant factor for the whole angular range. The origin of this mismatch might be due to several factors, e.g. from different events close in time (pile-up) depending on the structure of the beam pulses as well as from the same event in case of multiple hits ofγ-rays in high multiplicity cascades, causing sum up of the signals, which makes neutrons undistinguishable fromγ-rays.
In order to obtain an acceptable level of agreement between simulations and experiment, a correction factor with a value of 0.772(1) has been introduced. This factor was calculated using the experimental neutron detection efficiency of the full Neutron Wall, reported to be 26(6) % in Ref. [3], and the simulated neutron efficiency, which was 33.7(1) % according to the present work. Figure 4 shows a perfect overlap for the whole angular range when the correction factor is used.
3.3
Handling of the scattered events
As mentioned before, in a neutron detector array with a compact geometry, such as NEDA, the probability of neutron cross-talk between detectors is rather large. In the Neutron Wall detector system the simulated neutron cross-talk is estimated to be 12% in fair agreement with the previous estimates [2, 3]. This leads to an ambiguity regarding the real number of neutrons interacting in the array. In order to decrease this ambiguity and to optimise the two- and three-neutron efficiency, a method based on the correlation between the detector centroids (∆r) and the TOF (∆t) difference of two fired detectors in the array is commonly used [3, 24]. Each pair of coincident neutron signals is evaluated to determine whether they are produced by two different neutrons or by the scattering of a single one (See Fig. 5). If the difference ∆t is large enough to cover the distance ∆r, assuming a realistic range for the neutron energy, the two signals are assigned to the neutron cross-talk category, i.e. a single neutron was detected. Otherwise, they are assigned to the real two neutron events. This procedure can be extended to all possible combinations of two pairs of detectors fired in each event.
Counts per ns
100 200 300Experiment
Simulation (LILITA_N97)
Simulation (LILITA_N97 + 800 keV)
θ
= 57.2 deg
500 1000 1500
θ
= 47.2 deg
100 200 300 400
θ
= 34.9 deg
80
− −60 −40 −20 0 20
200 400 600
θ
= 30.3 deg
80
− −60 −40 −20 0 20
500 1000 1500
θ
= 18.5 deg
Time [ns]
80
− −60 −40 −20 0 20
0 50 100 150 200
θ
= 6.90 deg
20 40
60
[image:10.595.85.474.110.662.2]80 0 -20
Figure 3: Simulated and experimental TOF spectra for the six different θ angles of the Neutron Wall. TOF increases from right to left. Gamma rays were not included in the simulations. The large Gaussian-shaped peak in the experimental spectra, centered at time 0 ns and with a width of σ = 2.21 ns, is due to γ rays. For the comparison of the simulated and experimental data, the former were smeared with a Gaussian distribution with the same width as the γ-ray peak. The initial simulated TOF spectra are shown in grey colour. The simulated TOF spectra after the center-of-mass energy of the evaporated neutrons was increased by 800 keV are shown in red colour.
θ
[
deg
]
0
10
20
30
40
50
60
ε
r
l
,
θ
[
/
s
.
r
.]
0
0.1
0.2
0.3
0.4
0.5
0.6
0.7
0.8
0.9
1
Experiment
Simulation (LILITA_N97 + 800 keV)
Simulation (LILITA_N97 + 800 keV) + correction
Simulation (LILITA_N97 + 800 keV) without steel beam dump
[image:11.595.85.481.237.522.2]%
r
1
2
1
r'
t
t'
r
2
1
1
[image:12.595.188.404.99.315.2]t
Figure 5: Schematic view of the Neutron Wall, showing two real neutron events with an associated timet1 andt2and a scattered eventt′1. The differencet1−t2is smaller than a scatter eventt1−t′1, in average, for the vast majority of events.
for a given neutron energy spectrum the form of the gate is independent of the geometry. It can be seen that the gate is not symmetric around the ∆t = 0. This is because detectors are sorted with a criterion that the interaction which left more energy in the detector should be the one that occurs first. Thus the positive ∆t values are more frequent than the negative ones. A few events can be observed inside the gate. These events are due to neutrons with a very large energy. They correspond to events with velocities larger than the one defined by the gate, therefore they cannot be discriminated from the real events. This leakage, which is almost negligible, is only about 0.05 %.
4
Early implementation of NEDA to be coupled with
AGATA: Design and results of the simulations
An early implementation of NEDA, together with the Neutron Wall, is proposed to be coupled to AGATA at GANIL. The use of the Neutron Wall detectors in combination with NEDA detectors has been considered in order to maximise the number of detectors and therefore the efficiency of the setup. The coupling of both arrays will provide the best achievable performance compared to the case of the Neutron Wall standalone. Two configurations have been proposed that are shown in Fig. 7. The reason to consider these two configurations are related to the geometry of the Neutron Wall detectors - these are more compact in the configuration shown in Fig. 7-a and in a “ring” at ninety degrees in the configuration shown in Fig. 7-b. The basic properties of both configurations, together with those of the Neutron Wall alone are listed in Table 2.
In the setup shown in Fig. 7-a, the Neutron Wall is translated 180 mm away from its nominal position in the downstream beam direction, i.e. the front faces of the pentagonal detectors are at 690 mm from the target position. The 50 NEDA detector units are placed at 510 mm, 17 are at 60.5◦, 16 are at 74◦, and 17 are at 87.5◦with respect to the beam direction, in order to
r [mm]
∆
0
200
400
600
800
1000
t [ns]
∆
-80
-60
-40
-20
0
20
40
60
80
[image:13.595.87.472.164.398.2]2D gate
scattered neutrons
Figure 6: ∆r-∆t plot for simulated one neutron events from the fusion-evaporation reaction, de-scribed in the text. The two dimensional gate shown with a dashed line corresponds to the position where the real detection of two- and three-neutron events would be located.
Table 2: Summary of the basic properties of the Neutron Wall and the NW + NEDA.
Geometry Granularity Solid angle Volume/unit Total volume Radial distance to target
[sr] [litres] [litres] [m]
Neutron Wall (NW) 50 ≈1.00π (∗) 149.5 0.51
NW + NEDA NWNEDA 5050 ≈1.63π 3.23(∗) 311.0 0.510.69
NW-ring + NEDA NEDA 51 ≈1.60π 3.23 308.7 (
∗∗)
NW-ring 45 3.20 0.51
(∗) Volume of each segment of the Neutron Wall detectors is 1.1 l for the segments of the pentagonal detector
and 3.2 l for the segments of the hexagonal detectors.
[image:13.595.85.513.545.613.2](a) (b)
Figure 7: The proposed geometries of the NEDA array - left-hand-side in (a), right-hand-side in (b) - coupled to the Neutron Wall - right-hand-side in (a), left-hand-side in (b) - for the AGATA campaign at GANIL (color online). See text for details.
Fig. 7-b, the hexagonal units of the Neutron Wall are placed atθ angles between 60◦and 90◦.
The target-to-detector distance of the Neutron Wall is kept at its original position, i.e. 510 mm. The 51 NEDA unitary cells are placed at betweenθ= 0◦andθ = 60◦, covering a solid angle of
about≈0.7πsr in the forward position. The central detector unit of NEDA is placed at 570 mm
from the target position.
Tables 3 and 4 show the simulated one-, two- and three-neutron efficiencies for neutrons emitted from a252
Cf source and from the fusion-evaporation reaction58
Ni +56
Fe, respectively. The efficiencies are calculated according to the following expression:
εmn=
N≥m
Nemitted
, (3)
whereN≥mis the number of events that includes neutrons identified with multiplicity at least
m. This specific definition of efficiency assumes that multiplicities bigger than the number of
neutrons emitted m is only due to scattered neutrons which is preferred in the experiments
aiming nuclei far from stability in the proton rich side of the Segr´e chart. The numbers listed have been determined using the 2-dimensional gate described before. The final values of the efficiencies have been scaled by the correction factor that has been explained in Sec. 3.2, in such a way thatε′
mn=εmnfm, where m is the multiplicity of neutrons andf stands for the
[image:14.595.164.428.562.614.2]correction factor.
Table 3: One-, two- and three-neutron detection efficiencies obtained from simulations of a 252 Cf source for the different detector configurations. Errors quoted are statistical.
Geometry ε′
1n [%] ε′2n[%] ε′3n [%]
Neutron Wall (NW) 8.81 (6) 0.50 (4) 0.021 (13) NW + NEDA 13.55 (5) 1.371 (23) 0.125 (12) NW-ring + NEDA 14.68 (5) 1.743 (21) 0.182 (11)
According to the results of the simulations, this early NEDA - Neutron Wall implementation will provide a substantial improvement in terms of efficiency. The numbers listed in Table 3 show the results of the simulations using a252
Cf source. The fission of252
Cf results in emission of fast neutrons - which are in the same energy range as the neutrons emitted from a fusion-evaporation reaction. The average multiplicity of neutrons from spontaneous fissions of the252
Table 4: One-, two- and three-neutron efficiencies obtained from simulations of a fusion-evaporation reaction 58
Ni +56
Fe at 220 MeV for the different detector configurations. Errors quoted are statis-tical.
Geometry ε′
1n[%] ε′2n[%] ε′3n [%]
Neutron Wall (NW) 26.00 (5) 3.93 (10) 0.55 (14) NW + NEDA 28.70 (5) 6.37 (11) 1.66 (12) NW-ring + NEDA 31.30 (5) 7.62 (11) 1.89 (11)
3.10(0.18) according to Ref. [25], which makes it interesting for the verification of the neutron multiplicity counting. The results show the advantage of the configurations, in particular, the efficiency increment in the cases where the NEDA detectors are used, especially for two- and three-neutron multiplicities. For an isotropic distribution of neutrons, the increase of efficiency should be proportional to the increase in solid angle coverage, but the configurations involving the NEDA detectors show better performance figures. The results of the fusion-evaporation simulations in Table 4, show that the two-neutron efficiency for the NW + NEDA and NW-ring + NEDA configuration is predicted to be a factor 1.63(5) and 1.95(1), respectively, larger than what is obtained with NW alone. For the three-neutron efficiency the increase is a factor of 3.0(1.7) and 3.4(1.9) for NW + NEDA and NW-ring + NEDA, respectively, compared to NW alone. The NEDA detectors have a larger intrinsic neutron detection efficiency due to their larger depth (20 cm compared to 15 cm for NW). The measured number of photoelectrons per MeV is about 3 times larger for the NEDA detectors compared to the NW detectors [7], which will provide a better neutron-γdiscrimination performance. Therefore, in order to benefit from the better performance of the NEDA detectors compared to the NW detectors, the best configuration is the one with the NEDA detectors placed at the forward angles, NW-ring + NEDA shown in Fig. 7-b, where the energy and intensity of the neutrons is largest.
5
Summary
The identification of rare neutron-deficient evaporation residues produced by fusion-evaporation reactions requires a high efficiency for detection of multiple neutrons. This can be achieved by using a detector array with a large solid angle coverage, high granularity and high efficiency. The optimisation of these quantities drove the design of the new NEutron Detector Array, NEDA. The conceptual design of an early implementation of NEDA together with the Neutron Wall, to be coupled to AGATA at GANIL has been described in this work. Two configurations have been discussed: one consists of 50 NEDA detectors and 50 Neutron Wall detectors covering 1.63πsr solid angle and the other consists of 51 NEDA detectors and 45 Neutron Wall detectors covering 1.6πsr solid angle. The performance figures of these two configurations were studied by using a fusion-evaporation event generator that has been discussed an validated in this paper with experimental data. The results of the present work show that the proposed NW-ring + NEDA setup will provide a sizeable improvement compared to the Neutron Wall alone for the detection of multiple neutrons emitted in fusion-evaporation reactions.
6
Acknowledgements
National Science Centre under contracts: 801/N-COPIN/2010/0 (COPIN/IN2P3 collabora-tion), UM0-2014/14/M/ST2/00738 (COPIN-INFN collaboracollabora-tion), UM0-2013/08/M/ST2/0025 (LEA-COPIGAL collaboration), the Scientific and Technological Council of Turkey (Proj. no. 106T055 and 114F473), and the UK STFC (ST/L005727/1).
References
[1] B. Cederwallet al., Nature469(06 January 2011) 68-71.
[2] ¨O. Skeppstedtet al., Nuclear Instruments & Methods In Physics Research Section A421
(1999) 531-541.
[3] J. Ljungvall et al., Nuclear Instruments & Methods In Physics Research Section A 528
(2004) 741-762.
[4] D. Sarantiteset al., Nuclear Instruments & Methods In Physics Research Section A530
(2004) 473-492.
[5] F.J. Egea Canetet al., IEEE Transactions on Nuclear Science62Issue 3 (2015) 1056-1062. [6] F.J. Egea Canetet al., IEEE Transactions on Nuclear Science62Issue 3 (2015) 1063-1069. [7] V. Modamioet al., Nuclear Instruments & Methods In Physics Research Section A 775
(2015) 71-76.
[8] F. J. Egeaet al., IEEE Transactions on Nuclear Science60(2013) 3526-3531.
[9] P.-A. S¨oderstr¨om et al., Nuclear Instruments & Methods In Physics Research Section A
594(1) (2008) 79-89.
[10] X. Luoet al., Nuclear Instruments & Methods In Physics Research Section A767(2014) 83-91
[11] G. Jaworskiet al., Nuclear Instruments & Methods In Physics Research Section A 673
(2012) 64-72.
[12] S. Akkoyun et al., Nuclear Instruments & Methods In Physics Research Section A 668
(2012) 26-58.
[13] J. Simpson, et al. Acta Physica Hungarica: Heavy Ion Physica11(2000) 159-188. [14] J.J. Valiente-Dobon et al., Annual Report 2014 (2015) 95-96.
[15] S. Agostinelliet al., Nuclear Instruments & Methods In Physics Research Section A506
(2003) 250-303.
[16] E. Farneaet al., Nuclear Instruments & Methods In Physics Research Section A621(2010) 331-343.
[17] P.R.P. Coelhoet al. Nuclear Instruments & Methods In Physics Research Section A280
(1989) 270-272.
[18] J. Gomez del Campo and R.G. Stockstad, Oak Ridge National Laboratory Report No. TM7295 (1981), unpublished.
[19] A. Di Nittoet al., Eur. Phys. J. A47, (2011) 83-97.
[20] R. Moroet al., Eur. Phys. J. A48, (2012), 159-167.
[21] A.J. Koning and J.P. Delaroche, Nucl. Phys. A713, (2003), 231-310. [22] J. Simpson, Z. Phys. A358(1997) 139-143.
[23] A. Di Nittoet al., J. Phys. Conf. Ser.267(2011) 012053
[24] J. Cederk¨allet al., Nuclear Instruments & Methods In Physics Research Section A 385
(1997) 166-170.