This is a repository copy of
Effects of Dry and Wet Sieving of Soil on Identification and
Interpretation of Microbial Community Composition
.
White Rose Research Online URL for this paper:
http://eprints.whiterose.ac.uk/115313/
Version: Supplemental Material
Article:
Blaud, A., Menon, M. orcid.org/0000-0001-5665-7464, van der Zaan, B. et al. (2 more
authors) (2016) Effects of Dry and Wet Sieving of Soil on Identification and Interpretation
of Microbial Community Composition. Advances in Agronomy, 142. pp. 119-142. ISSN
0065-2113
https://doi.org/10.1016/bs.agron.2016.10.006
Article available under the terms of the CC-BY-NC-ND licence
(https://creativecommons.org/licenses/by-nc-nd/4.0/)
[email protected] https://eprints.whiterose.ac.uk/
Reuse
This article is distributed under the terms of the Creative Commons Attribution-NonCommercial-NoDerivs (CC BY-NC-ND) licence. This licence only allows you to download this work and share it with others as long as you credit the authors, but you can’t change the article in any way or use it commercially. More
information and the full terms of the licence here: https://creativecommons.org/licenses/
Takedown
If you consider content in White Rose Research Online to be in breach of UK law, please notify us by
1
Supplementary information
Effects of dry- and wet-sieving of soil on identification and interpretation of
microbial community composition
Aimeric Blaud
a, 1*, Manoj Menon,
a, 2, Bas van der Zaan
b, Georg J. Lair
c , d, Steve Banwart
a, 3a
Department of Civil and Structural Engineering, Kroto Research Institute, The University of
Sheffield, Broad Lane, Sheffield S3 7HQ, United Kingdom.
b
Deltares, Subsurface and Groundwater Systems, Princetonlaan 6-8, 3508 Al Utrecht, the
Netherlands.
c
University of Natural Resources and Life Sciences (BOKU), Institute of Soil Research,
Vienna, Peter-Jordan-Str. 82, 1190 Vienna, Austria.
d
University of Innsbruck, Institute of Ecology, Sternwartestr. 15, 6020 Innsbruck, Austria.
*Corresponding Author.
E-mail address:
[email protected]
1
Current address: Agroecology Department, Rothamsted Research, Harpenden, Hertfordshire
AL5 2JQ, UK.
2
Current address: Department of Geography, The University of Sheffield, Sheffield, S10
2TN, UK.
3
Current address: School of Earth and Environment, University of Leeds, Leeds, LS2 9JT,
2
Table S1. Description of the primers used to target each community and the annealing
temperature of each Q-PCR assays.
Target
gene Primer Sequence 5'-3'
Annealing
temp. (°C)
and time (s)
References
Bacterial 519F GCCAGCAGCCGCGGTAAT
58 (30 s)
Lane, 1991
16SrRNA 907R CCGTCAATTCCTTTGAGTTT Stubner and Meuser, 2000
Archaeal Arch 0025F CTGGTTGATCCTGCCAG
58 (30 s)
Vetriani et al., 1999
16SrRNA Arch 364R ACGGGGCGCACGAGGCGCGA Vetriani et al., 1999
Fungal ITS1f TCCGTAGGTGAACCTGCGG
50 (45 s)
Gardes and Bruns, 1993
ITS 5.8s CGCTGCGTTCTTCATCG Vilgalys and Hester, 1990
nifH nifHF AAAGGYGGWATCGGYAARTCCACCAC
62.5 (60 s)
Rösch and Bothe, 2005
nifHRb TGSGCYTTGTCYTCRCGGATBGGCAT Rösch and Bothe, 2005
amoA amoA_F GGHGACTGGGAYTTCTGG
55.3 (30 s)
Holmes et al., 1995
Bacteria amoA_R CCTCKGSAAAGCCTTCTTC Okano et al., 2004
amoA amoAF STAATGGTCTGGCTTAGACG
55 (35 s)
Francis et al., 2005
Archaea amoAR GCGGCCATCCATCTGTATGT Francis et al., 2005
narG NARG F TCGCCSATYCCGGCSATGTC
63 (30 s)
López-Gutiérrez et al., 2004
NARG R GAGTTGTACCAGTCRGCSGAYTCSG López-Gutiérrez et al., 2004
nirS NIRS4Q F GTSAACGYSAAGGARACSGG
63 (30 s)
Braker et al., 1998
NIRS6Q R GASTTCGGRTGSGTCTTSAYGAA Braker et al., 1998
nosZ nosZ1840_F CGCRACGGCAASAAGGTSMSSGT
67 (30 s)
Henry et al., 2006
[image:3.595.43.556.125.681.2]3
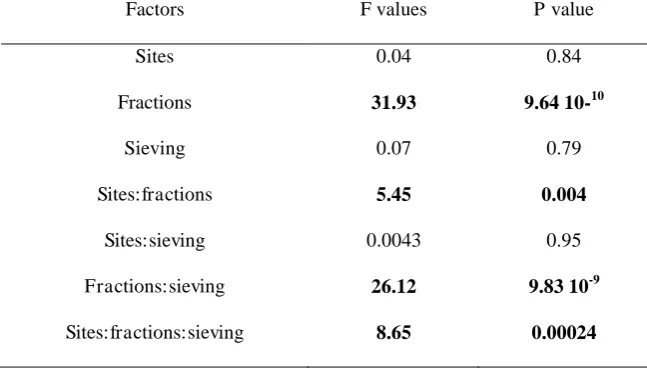
Table S2. Overview table of the ANOVA of the aggregate distribution with sites, soil
fractions and sieving methods as factors. Significant P values (P < 0.05) are shown in bold.
Factors F values P value
Sites 0.04 0.84
Fractions 31.93 9.64 10-10
Sieving 0.07 0.79
Sites:fractions 5.45 0.004
Sites:sieving 0.0043 0.95
Fractions:sieving 26.12 9.83 10-9
4
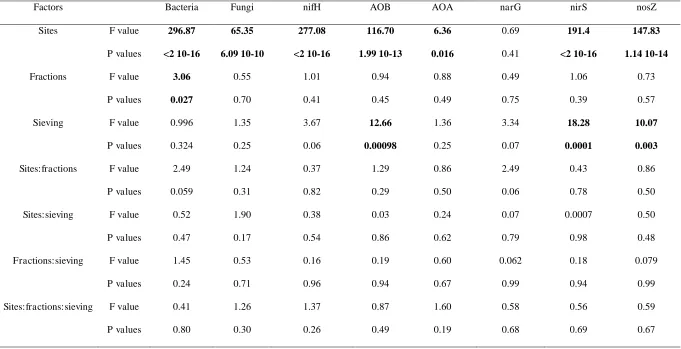
Table S3. Overview table of the ANOVA of the relative abundance of microbial genes, with sites, soil fractions and sieving methods as factors.
Significant P values (P < 0.05) are shown in bold.
Factors Bacteria Fungi nifH AOB AOA narG nirS nosZ
Sites F value 296.87 65.35 277.08 116.70 6.36 0.69 191.4 147.83
P values <2 10-16 6.09 10-10 <2 10-16 1.99 10-13 0.016 0.41 <2 10-16 1.14 10-14
Fractions F value 3.06 0.55 1.01 0.94 0.88 0.49 1.06 0.73
P values 0.027 0.70 0.41 0.45 0.49 0.75 0.39 0.57
Sieving F value 0.996 1.35 3.67 12.66 1.36 3.34 18.28 10.07
P values 0.324 0.25 0.06 0.00098 0.25 0.07 0.0001 0.003
Sites:fractions F value 2.49 1.24 0.37 1.29 0.86 2.49 0.43 0.86
P values 0.059 0.31 0.82 0.29 0.50 0.06 0.78 0.50
Sites:sieving F value 0.52 1.90 0.38 0.03 0.24 0.07 0.0007 0.50
P values 0.47 0.17 0.54 0.86 0.62 0.79 0.98 0.48
Fractions:sieving F value 1.45 0.53 0.16 0.19 0.60 0.062 0.18 0.079
P values 0.24 0.71 0.96 0.94 0.67 0.99 0.94 0.99
Sites:fractions:sieving F value 0.41 1.26 1.37 0.87 1.60 0.58 0.56 0.59
5
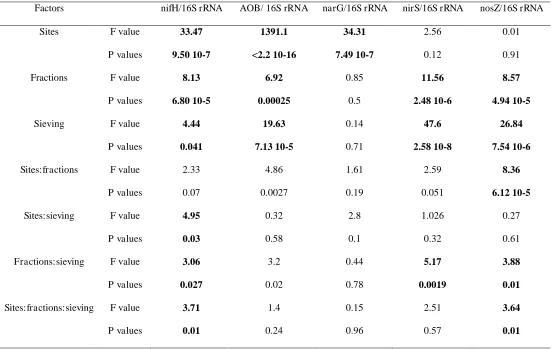
Table S4. Overview table of the ANOVA of the microbial gene express as percentage of the bacterial 16S rRNA gene copies, with sites, soil
fractions and sieving methods as factors. Significant P values (P < 0.05) are shown in bold.
Factors nifH/16S rRNA AOB/ 16S rRNA narG/16S rRNA nirS/16S rRNA nosZ/16S rRNA
Sites F value 33.47 1391.1 34.31 2.56 0.01
P values 9.50 10-7 <2.2 10-16 7.49 10-7 0.12 0.91
Fractions F value 8.13 6.92 0.85 11.56 8.57
P values 6.80 10-5 0.00025 0.5 2.48 10-6 4.94 10-5
Sieving F value 4.44 19.63 0.14 47.6 26.84
P values 0.041 7.13 10-5 0.71 2.58 10-8 7.54 10-6
Sites:fractions F value 2.33 4.86 1.61 2.59 8.36
P values 0.07 0.0027 0.19 0.051 6.12 10-5
Sites:sieving F value 4.95 0.32 2.8 1.026 0.27
P values 0.03 0.58 0.1 0.32 0.61
Fractions:sieving F value 3.06 3.2 0.44 5.17 3.88
P values 0.027 0.02 0.78 0.0019 0.01
Sites:fractions:sieving F value 3.71 1.4 0.15 2.51 3.64
6
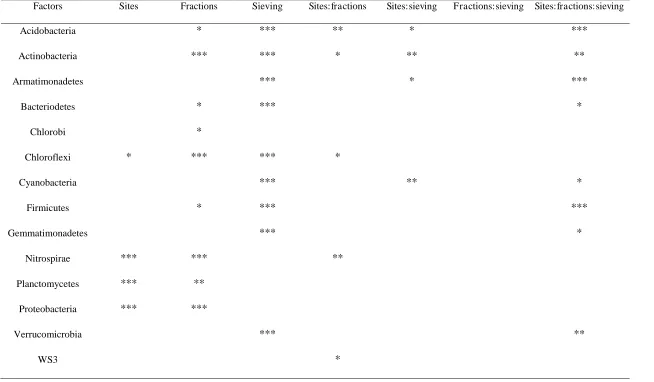
Table S5: Overview table of the ANOVA of the relative abundance of bacterial phylum, with sites, soil fractions and sieving methods as factors.
Significant P values (P < 0.05) are shown: * P < 0.05; ** P < 0.01; *** P < 0.001.
Factors Sites Fractions Sieving Sites:fractions Sites:sieving Fractions:sieving Sites:fractions:sieving
Acidobacteria
*
***
**
*
***
Actinobacteria
***
***
*
**
**
Armatimonadetes
***
*
***
Bacteriodetes
*
***
*
Chlorobi
*
Chloroflexi
*
***
***
*
Cyanobacteria
***
**
*
Firmicutes
*
***
***
Gemmatimonadetes
***
*
Nitrospirae
***
***
**
Planctomycetes
***
**
Proteobacteria
***
***
Verrucomicrobia