Sensitivity of Quantitative Myocardial Dynamic
Contrast-Enhanced MRI to Saturation Pulse Efficiency,
Noise and T
1
Measurement Error: Comparison of
Nonlinearity Correction Methods
David A.
Broadbent
AQ4
,
1,2,3John D.
Biglands
,
1,2,3David P.
Ripley
,
1,3David M.
Higgins
,
4John P.
Greenwood
,
1,3Sven
Plein
,
1,3and
David L.
Buckley
1,3*
Purpose:To compare methods designed to minimize or cor-rect signal nonlinearity in quantitative myocardial dynamic contrast-enhanced (DCE) MRI.
Methods:DCE-MRI studies were simulated and data acquired in eight volunteers. Signal nonlinearity was corrected using either a dual-bolus approach or model-based correction using proton-density weighted imaging (conventional or dual-sequence acquisition) or T1data (native or bookend). Scanning
of healthy and infarcted myocardium at 3 Tesla was simulated, including noise, saturation imperfection and T1 measurement
error. Data were analyzed using model-based deconvolution with a one-compartment (mono-exponential) model.
Results: Substantial variation between methods was demon-strated in volunteers. In simulations the dual-bolus method proved stable for realistic levels of saturation efficiency but dem-onstrated bias due to residual nonlinearity. Model-based meth-ods performed ideally in the absence of confounding error sources and were generally robust to noise or saturation imper-fection, except for native T1based correction which was highly
sensitive to the latter. All methods demonstrated large variation in accuracy above an over-saturation level where baseline signal was nulled. For the dual-sequence approach this caused sub-stantial bias at the saturation efficiencies observed in volunteers. Conclusion:The choice of nonlinearity correction method in myocardial DCE-MRI impacts on accuracy and precision of estimated parameters, particularly in the presence of nonideal saturation. Magn Reson Med 000:000–000, 2015. VC 2015
Wiley Periodicals, Inc.
Key words: cardiovascular magnetic resonance; perfusion; myocardial blood flow; simulation; quantification; nonlinearity correction
INTRODUCTION
Dynamic contrast enhanced (DCE) cardiac MRI is an established method for visually identifying regional blood flow reduction. Quantitative assessment of DCE-MRI data may also be used to estimate myocardial blood flow (MBF) (1–3) and other physiological para-meters (4,5). Data are typically acquired using a satura-tion recovery (SR) gradient echo sequence (6) with temporal resolution equal to the subject’s heart-rate. Physiological parameters can be determined through deconvolution, using relative concentration-time courses in the myocardium and feeding blood supply (arterial input function (AIF) typically taken from blood in the left ventricle, LV).
Signal enhancement is approximately proportional to contrast agent concentration [(CA)] for low concentra-tions and/or sequences with low T1 sensitivity (7), and could be used in quantitative analysis under such condi-tions. In practice peak concentrations in the AIF are con-siderably larger than in the myocardium, leading to a challenge for quantitative analysis. Protocols that gener-ate sufficient contrast-to-noise ratio (CNR) in myocar-dium will not yield a linear relationship between signal intensity (SI) and concentration for the AIF. Several methods have been proposed to address this issue, including modeling the SI-concentration relationship (8–11) or separating the AIF and tissue curve acquisition using the same (dual-sequence) (12) or an additional administration (dual-bolus) (13–15).
In these methods perfect magnetization saturation throughout the LV is generally assumed. However, even with pulses optimized for high-field cardiac MRI, a small fraction of equilibrium magnetization may remain after saturation. This may be aligned with the equilibrium state or be inverted, and has been reported at around 2–3% using the BIR-4 pulse train (16–18). Although fur-ther improvement in saturation pulse efficiency (SE) may arise this is likely to be limited by SAR and B1 con-straints. It has been identified that residual magnetiza-tion could bias DCE-MRI SI (17) (particularly for native tissue), and hence cause inaccuracy in quantification (9,18). While baseline subtraction can account for some degree of saturation imperfection in signal based analysis this may not be robust at higher levels, and the effect on baseline signal could adversely affect model-based approaches. However, the magnitude of potential errors
1
Division of Biomedical Imaging, University of Leeds, Leeds, United Kingdom.
2
Department of Medical Physics and Engineering, Leeds Teaching Hospi-tals NHS Trust, Leeds, United Kingdom.
3
Multidisciplinary Cardiovascular Research Centre, University of Leeds, Leeds, United Kingdom.
4
Philips Healthcare, Guildford, United Kingdom.
Grant sponsor: National Institute for Health Research; Grant number: DRF-2012-05-155; Grant sponsor: Heart Research UK; Grant number: RG2643/ 14/16; Grant sponsor: British Heart Foundation Senior Fellowship; Grant number: FS/10/62/28409.
*Correspondence to: David L. Buckley, Medical Physics, University of Leeds, Leeds, LS2 9JT, UK. E-mail: d.l.buckley@leeds.ac.uk
AQ2 AQ3
Received 30 January 2015; revised 19 March 2015; accepted 20 March 2015
DOI 10.1002/mrm.25726
Published online 00 Month 2015 in Wiley Online Library (wileyonlinelibrary. com).
in physiological parameters has not previously been assessed.
In this work, a novel application of bookend (native and postcontrast) T1 data to estimate and account for imperfect saturation is introduced and assessed along-side established methods. Bookend T1 measurements have been used to correct errors arising from various sources in breast DCE-MRI using nonmagnetization pre-pared sequences (19,20), but have not been applied to SR sequences in myocardial DCE-MRI. This study aimed to assess the impact of imperfect saturation, noise and T1 measurement error on quantitative myocardial DCE-MRI using different nonlinearity correction methods through simulation and volunteer scanning.
METHODS
Simulation Study
Simulations were performed in MATLAB (Mathworks, Natick, MA). All optimizations were performed using a constrained least-squares based minimization algorithm (fmincon). A population representative AIF was gener-ated with a form and mean parameters described previ-ously (21). This is derived for a 0.1 mmol/kg dose administered at 3 ml/s yielding peak blood [CA] of
6.04 mM, so was scaled to a peak blood [CA] of 3.02 mM to reflect the 0.05 mmol/kg dose administered in the vol-unteer study described below (ground truth concentration curves are presented in Supporting Figure S1, which is available online). Longitudinal relaxivity (r1) of 4.5 L/ mmol/s for Gd-BT-DO3A (Gadovist) at 3T (22,23) was assumed. Tissue concentration curves were generated by converting the AIF to concentration in plasma using a heamatocrit value of 0.46 (24) and convolving with a one-compartment (mono-exponential) (25) residue function. “Ground truth” MBF and distribution volume (vd) were selected from published sources (5,26). SI curves (assum-ing signal is determined entirely by the center of k-space) were simulated with a range of SE values based on Eq. [1] [Larsson et al (11), modified to allow arbitrary magnetiza-tion preparamagnetiza-tion] and the parameters in Table1 [based on T1 local practice and published values (27)].
SIðtÞ ¼S0f Tð 1;SEÞwheref Tð 1;SEÞ ¼1SEeTSR1ð Þtank01þb1a
nk01 1a : [1]
Here a¼eTRR1ð Þt cosð Þ,a b¼1eTRR1ð Þt and R 1 is longitudinal relaxation rate (1/T1). S0is the SI that would be acquired from a single readout pulse applied at equi-librium (incorporating T2*decay, receiver gain and proton density), a is the readout pulse flip angle and nk0 is the number of RF pulses before the acquisition of the central k-space data. SE of 1 corresponds to perfect saturation while 0 represents no preparation and 2 perfect inversion. Magnitude signal was recorded, reflecting standard prac-tice, and Rician noise added where required. R1increases linearly from the native value (R1,n) with the change (DR1) being proportional to [CA] and r1(Eq. [2]):
R1¼R1;nþ½CA r1: [2]
Deconvolution of resulting data with a one-compartment model was performed to estimate MBF and vd using the nonlinearity correction methods described below, and results were compared with ground truth.
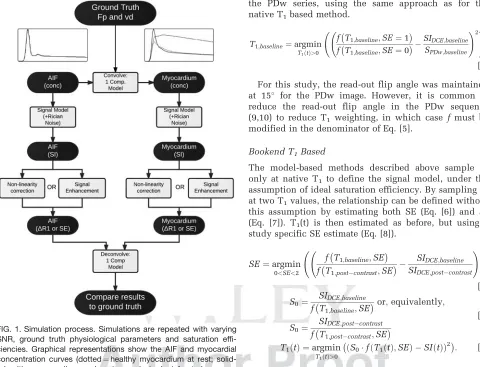
Figure1 summarizes the process. F1
To assess errors introduced directly through deconvo-lution (due to factors including optimizer termination tolerances and discrete temporal sampling) noise-free concentration curves were analyzed. Additionally decon-volution was performed using signal enhancement data to assess errors incurred without nonlinearity correction.
Model-Based Nonlinearity Correction Methods
Model-based approaches involve the use of additional data and imaging parameters to constrain a signal model for the acquired data. This model is used to convert SI data intoDR1throughout the DCE-MRI acquisition before deconvolution. These techniques can be sensitive to fac-tors that lead to the signal not being fully described by the model, including imperfections in SE, B1 homogene-ity, readout flip angle accuracy and slice profile.
Native T1Based
[image:2.612.63.302.107.459.2]SI can be converted to DR1using measured or assumed baseline T1 (8), a method that has also been used in
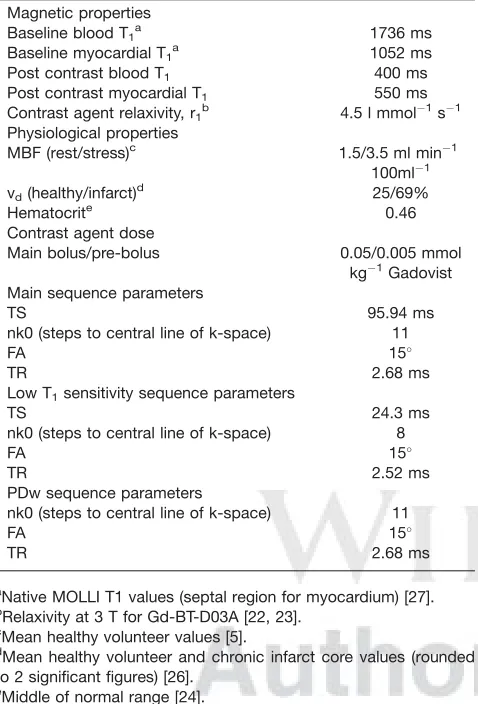
Table 1
Parameters Used for Simulations: Imaging Parameters Are Repre-sentative of Local Practice
Magnetic properties
Baseline blood T1a 1736 ms
Baseline myocardial T1 a
1052 ms Post contrast blood T1 400 ms
Post contrast myocardial T1 550 ms
Contrast agent relaxivity, r1b 4.5 l mmol1s1
Physiological properties
MBF (rest/stress)c 1.5/3.5 ml min1 100ml1 vd(healthy/infarct)d 25/69%
Hematocrite 0.46
Contrast agent dose
Main bolus/pre-bolus 0.05/0.005 mmol kg1Gadovist Main sequence parameters
TS 95.94 ms
nk0 (steps to central line of k-space) 11
FA 15
TR 2.68 ms
Low T1sensitivity sequence parameters
TS 24.3 ms
nk0 (steps to central line of k-space) 8
FA 15
TR 2.52 ms
PDw sequence parameters
nk0 (steps to central line of k-space) 11
FA 15
TR 2.68 ms
a
Native MOLLI T1 values (septal region for myocardium) [27].
b
Relaxivity at 3 T for Gd-BT-D03A [22, 23].
c
Mean healthy volunteer values [5].
d
Mean healthy volunteer and chronic infarct core values (rounded to 2 significant figures) [26].
e
DCE-MRI using inversion recovery sequences (3,28,29). In the model (Eq. [1]), S0is initially unknown and SE is assumed to be ideal. S0is determined using baseline SI and an independently derived native T1 (Eq. [3]) and is assumed to be constant throughout the acquisition, allowing estimation of T1(t) throughout the remainder of the DCE-MRI acquisition (Eq. [4]).
S0¼
SIDCE;baseline f T 1;baseline;SE¼1
[3]
T1ð Þ ¼t argmin
T1ð Þt>0
S0f Tð 1ð Þt ;SE¼1Þ SI tð Þ
ð Þ2
: [4]
Native Proton Density Weighted (PDw) Based
An alternative model-based method to determine S0uses the acquisition of a proton density weighted (PDw) image (without saturation preparation) before DCE-MRI acquisition (9,10). In the absence of T1 weighting S0 would be sampled directly by that acquisition. In prac-tice, residual T1 weighting is present in the PDw sequence (due to the read-out pulses). Estimates of base-line T1(Eq. [5]) and subsequently S0and T1(t) are, there-fore, estimated using baseline DCE data and SI data from
the PDw series, using the same approach as for the native T1based method.
T1;baseline¼argmin T1ð Þt>0
f T1;baseline;SE¼1
f T1;baseline;SE¼0
SIDCE;baseline
SPDw;baseline !2!
:
[5]
For this study, the read-out flip angle was maintained at 15 for the PDw image. However, it is common to reduce the read-out flip angle in the PDw sequence (9,10) to reduce T1 weighting, in which case f must be modified in the denominator of Eq. [5].
Bookend T1Based
The model-based methods described above sample SI only at native T1 to define the signal model, under the assumption of ideal saturation efficiency. By sampling SI at two T1values, the relationship can be defined without this assumption by estimating both SE (Eq. [6]) and S0 (Eq. [7]). T1(t) is then estimated as before, but using a study specific SE estimate (Eq. [8]).
SE¼argmin 0<SE<2
f T 1;baseline;SE f T 1;postcontrast;SE
SIDCE;baseline SIDCE;postcontrast
!2!
[6]
S0¼
SIDCE;baseline f T1;baseline;SE
or;equivalently;
S0¼
SIDCE;postcontrast f T 1;postcontrast;SE
[7]
T1ð Þ ¼t argmin
T1ð Þt>0
S0f Tð 1ð Þt ;SEÞ SI tð Þ
ð Þ2
: [8]
To perform this method a T1 measurement and DCE-MRI sequence are acquired at a delayed postcontrast time, as well as before contrast administration. Ideally the postcontrast data would be acquired while T1is sta-ble, but this is not achievable in practice as T1will vary due to distribution and clearance of the contrast agent. However, steps can be taken to approximate this includ-ing samplinclud-ing postcontrast T1 and SI as close together (temporally) as possible at a time where T1varies slowly (once equilibrium has been reached between blood and interstitium and variation is driven predominantly by renal clearance). Measuring SI both sides of T1(or vice-versa) and interpolating to account for temporal variation could further reduce the impact of [CA] variation.
Dual Sampling Methods
The following methods allow independent measurement of an AIF that is minimally affected by nonlinearity. These can be used in isolation or in combination with model-based correction.
Dual-Bolus
[image:3.612.64.544.75.442.2]The dual-bolus approach (13–15) exploits the approxi-mately linear response of SI to [CA] at the relatively low concentrations encountered in the myocardium from a standard dose, and in the AIF from a smaller “prebolus” dose administered before the main bolus. Signal FIG. 1. Simulation process. Simulations are repeated with varying
SNR, ground truth physiological parameters and saturation effi-ciencies. Graphical representations show the AIF and myocardial concentration curves (dotted¼healthy myocardium at rest;
enhancement data from the prebolus AIF is scaled by the bolus:prebolus dose ratio and analyzed with the tissue response from the main bolus. As linearity of SI response is assumed, no conversion to [CA] is required.
This method was simulated by prepending the concen-tration curves in the first stage of the simulation with prebolus data of equal duration with concentrations scaled by one-tenth. In practice, residual contrast agent from the prebolus will affect the tissue curve. The details of this depend on physiological parameters and the delay between administrations. Additionally changes in AIF shape may occur between contrast agent administra-tions due to factors such as altered contrast agent volume or viscosity (depending on whether the prebolus is administered as a smaller or diluted dose) or cardiac out-put variation (30). For simplicity, it is assumed in these simulations that the prebolus is cleared entirely before main bolus administration, and that the shape of the pre-bolus and pre-bolus AIF and myocardial concentration curves are identical except for scaling.
Dual-Sequence
The model-based methods described above can be com-bined with a dual-sequence acquisition in which the AIF is acquired using a sequence with reduced T1sensitivity interleaved with the higher sensitivity sequences for myocardial curve acquisition (12). This allows both curves to be acquired with a more linear signal response to [CA], while not introducing the additional procedural steps or concerns regarding bolus shape differences of the dual-bolus approach. For this study, myocardial SI curves were generated using the same pulse sequence parameters used for the other methods. SI curves for the AIF were generated using the parameters described in the “Low T1 sensitivity sequence parameters” section of Table 1. The latter is designed to result in a linear relationship between SI and T1 over a wider range of concentrations, although yields reduced CNR and resolution.
The initial application of the dual-sequence approach (12) was for estimation of relative blood flow (myocardial perfusion reserve), for which differences in T1sensitivity between the sequences cancel out allowing use of signal enhancement data. For quantification of absolute param-eters, the differences must be accounted for and so signal enhancement cannot be used. For this simulation, PDw model-based conversion is employed using appropriate signal models for each sequence. CalculatedDR1is used in the deconvolution as for the other model-based approaches. Additionally, spatial resolution of the low T1sensitivity sequence is typically lower, which results in greater signal-to-noise ratio (SNR). In the simulations, the noise standard deviation was halved for the low T1 sensitivity sequence compared with the standard sequence, based on the approximate SNR difference expected for the protocol on which these simulations were based.
Simulations Performed
Using each of the methods described above, MBF and vd were estimated and compared with ground truth for a
range of conditions (healthy myocardium at rest and under pharmacologically induced stress and chronically infarcted myocardium). In general, MBF will be lower for infarcted myocardium at rest (one study reported regional blood flow in chronic infarct regions as being 16% lower than for remote myocardium) (31). For sim-plicity, and to allow comparison of results following alteration of individual parameters, the value of MBF used for infarct simulation was equal to that used for healthy myocardium. Similarly vd was not altered between rest and stress. Parameter values used are pre-sented in Table 1.
Simulations were performed in the absence of and including Rician noise with standard deviation equal to 0.5% of S0. For healthy resting myocardium, this corre-sponds to peak myocardial SNR of 14 which is similar to the data acquired in the volunteer study and that reported elsewhere (32). Simulations with noise were repeated 1000 times and mean and standard deviation of fitted parameters recorded. SE was varied in increments of 0.005 from 0.9–1.1, and at finer increments (0.0025) in the central part of this range (0.97–1.03). SE is defined such that residual longitudinal magnetization after satu-ration equals (1-SE)*M0 (where M0 is equilibrium mag-netization) with positive values being aligned with the equilibrium state and negative values representing inverted magnetization. Methods which use T1 values were repeated assuming measurement errors of 5% (both under- and overestimation).
Volunteer Study
administration followed by a contrast enhanced T1 map (4-3-2 MOLLI with 1 beat recovery period). Myocardial and LV blood-pool contours were drawn (QMass, Medis, the Netherlands), the former covering the full circumfer-ential extent (excluding papillary muscles), on a mid-ventricular slice to extract signal-time data which were analyzed in the same way as the simulated data.
RESULTS
Simulation Study
Simulated signal-time curves are presented in Support-ing Figures S2 and S3 and the AIF and myocardial data used for deconvolution in each method in Supporting Figures S4–S9. Deconvolving noise-free concentration curves directly yielded negligible errors (<0.0002%). Analyzing signal enhancement data without nonlinearity correction (Fig.
F2 2) yielded 30–50% overestimation of
MBF and errors in vdbetween5% andþ10% (for ideal saturation and in the absence of noise). Errors in all parameters were generally insensitive to SE up to a threshold SE of 1.06 above which errors varied substantially.
Effect of Saturation Efficiency
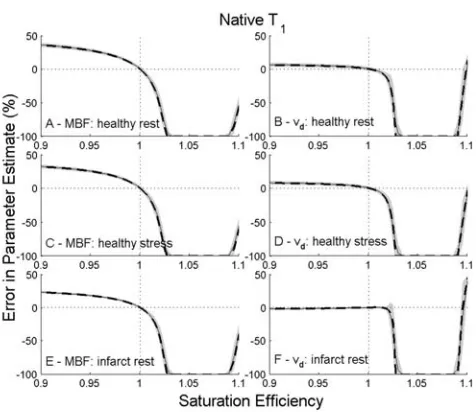
Simulations performed without noise demonstrated vari-ation in behavior of different nonlinearity correction methods (Figures
F3-F7 3–7, dashed lines). With perfect satura-tion, model-based approaches yielded errors <0.001% throughout. The dual-bolus method demonstrated sys-tematic underestimation of MBF and vdof up to 16 and 10%, respectively.
As SE errors are introduced further differences in behavior between methods are revealed. Model-based
[image:5.612.314.552.69.275.2]and dual-bolus acquisition based methods both show low sensitivity to small levels of over or under-saturation, except for the model-based approach using native T1 and baseline SI alone. The latter demonstrates a very strong dependence on SE with substantial errors being introduced for levels of over- or under-saturation within the reported performance of optimized RF pulses (16–18). In this method, the estimated value of S0 is
FIG. 2. Errors in estimated parameters for healthy myocardium at rest (A¼MBF andB¼vd) and under stress (C¼MBF andD¼vd)
and for infarcted myocardium at rest (E¼MBF and F¼vd) for
deconvolution using signal-enhancement data without correction for nonlinearity. Solid lines show results in the absence of noise. Dashed lines and shading show mean results6one standard deviation for data with simulated noise.
FIG. 3. Errors in estimated parameters for healthy myocardium at rest (A¼MBF andB¼vd) and under stress (C¼MBF andD¼vd)
and for infarcted myocardium at rest (E¼MBF and F¼vd) for
deconvolution using native T1 based correction. Solid lines show
results in the absence of noise. Dashed lines and shading show mean results6one standard deviation for data with simulated noise.
FIG. 4. Errors in estimated parameters for healthy myocardium at rest (A¼MBF andB¼vd) and under stress (C¼MBF andD¼vd)
and for infarcted myocardium at rest (E¼MBF and F¼vd) for
[image:5.612.64.298.76.271.2]proportional to baseline SI, which decreases approxi-mately linearly with increasing SE. A degree of oversatu-ration is reached whereupon this method breaks down as the estimated S0decreases below the peak SI. As this level is approached, the estimated physiological parame-ters decrease rapidly to zero.
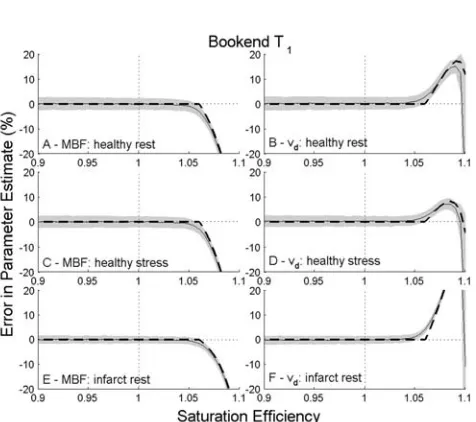
The methods that are more robust to small SE errors (model-based corrections using PDw, including dual-sequence, or bookend T1data) are also robust across the
range of under-saturation levels tested. However, as increasing levels of over-saturation are introduced into the simulations threshold points are encountered where errors in derived physiological parameters change sub-stantially. These thresholds are identified as the SE at which baseline signal is nulled due to the partial inver-sion of longitudinal magnetization by the saturation pulse. For most methods, this occurs around SE of 1.06. An earlier threshold, SE¼1.015, is encountered for the dual-sequence approach as the low T1 sensitivity sequence used to derive the AIF encounters baseline sig-nal nulling at a lower SE. The dual-sequence method also demonstrates some SE dependency below this threshold value (increasing underestimation of parame-ters with under-saturation) which is present but negligi-ble (except native T1based correction) in other methods.
Effect of Image Noise
Simulations including noise (solid lines and shading in Figures 2–7) showed similar overall patterns to the noise-free simulations. However, the variation in bias around the threshold SE values described above is less sharp. This is due to the asymmetric nature of the Rician noise distribution at low SNR leading to noise induced bias as the threshold value is approached. Inclusion of noise also allows assessment of relative precision of the methods (the vertical extent of the shaded areas in Fig-ures 2–7 is equal to twice the co-efficient of variation), with precision being poorest for dual-bolus due to the reduced CNR in the low-dose AIF. This technique also demonstrates the largest noise induced bias (identifiable where the solid lines deviate from the dashed lines in the figures). Results for resting MBF from all methods with ideal saturation and realistic levels of saturation imperfection (SE¼0.975 and 1.025) are compared in
[image:6.612.63.301.58.269.2]Figure8. F8
FIG. 5. Errors in estimated parameters for healthy myocardium at rest (A¼MBF andB¼vd) and under stress (C¼MBF andD¼vd)
and for infarcted myocardium at rest (E¼MBF and F¼vd) for
deconvolution using bookend T1 based correction. Solid lines
[image:6.612.314.550.69.269.2]show results in the absence of noise. Dashed lines and shading show mean results6one standard deviation for data with simu-lated noise.
FIG. 6. Errors in estimated parameters for healthy myocardium at rest (A¼MBF andB¼vd) and under stress (C¼MBF andD¼vd)
and for infarcted myocardium at rest (E¼MBF and F¼vd) for
deconvolution using the dual-bolus method. Solid lines show results in the absence of noise. Dashed lines and shading show mean results6one standard deviation for data with simulated noise.
FIG. 7. Errors in estimated parameters for healthy myocardium at rest (A¼MBF and B¼vd) and under stress (C¼MBF and D¼vd)
and for infarcted myocardium at rest (E¼MBF andF¼vd) for
[image:6.612.63.299.493.684.2]Effect of Errors in Measured T1
In simulations of T1 measurement dependent model-based methods, errors in T1were found to introduce sys-tematic errors in estimated physiological parameters. For model-based correction using native T1alone, underesti-mation of T1led to a decrease in estimated S0for a given SE and consequently lower estimates of physiological parameters.
For the bookend method, the direction of bias on phys-iological results depended on the T1 measurement in error. Underestimation of native T1led to a slight overes-timation of S0 and SE. This resulted in small (<1%) increases in estimated physiological parameters. For overestimation of native T1, the converse was true. Phys-iological parameter estimates were more sensitive to the same (relative) error in post contrast T1 (errors <4%) with the direction of bias reversed compared with errors in native T1. Some SE dependence was observed with the underestimation of SE being more severe at lower values of SE. The effects of errors in measured native and postcontrast T1were combined when errors in both in the same direction were simulated. As the bookend method is more sensitive to errors in postcontrast T1the overall errors in estimated physiological parameters were in the same direction as, but smaller in magnitude to, those introduced by errors in postcontrast T1alone.
Volunteer Study
For the volunteer study, no gold standard data were acquired so only relative results can only be compared with each other. Example signal data are available in Supporting Figure S10 and all T1 values in Supporting
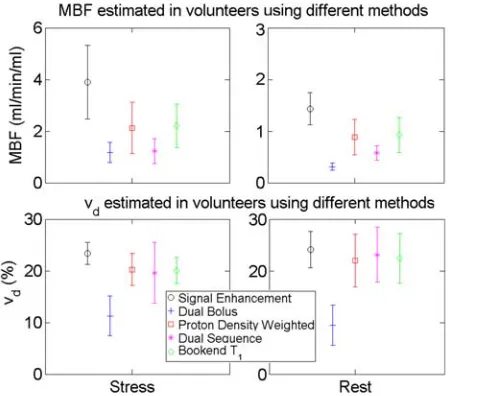
Table S2. Oversaturation was consistently measured using the bookend T1based method (SE¼1.005–1.0375). Nonlinearity correction was successful except for native T1based correction for which peak signal exceeded esti-mated S0values for 10/16 cases (including all cases with SE>1.02). Tracer kinetic model fitting was successful in all but four dual-bolus datasets (all rest) in which MBF estimates were stable but estimates of vd were unstable due to low SNR in the prebolus AIF. Systematic differen-ces in mean MBF and vd were observed between meth-ods (Fig. 9) with all nonlinearity correction methods F9 yielding lower estimates of both parameters than decon-volution of signal enhancement data. Dual-bolus and dual-sequence methods yielded lower MBF estimates than the bookend T1 and native PDw based methods, while estimates of vd were lower for the dual-bolus approach compared with the other three methods.
DISCUSSION
Use of signal enhancement data without model-based correction led to overestimation of MBF as expected (13,36) as well as systematic errors in vd. A similar pat-tern was observed in volunteer data, with elevated parameter estimates in vivo compared with estimates obtained with nonlinearity correction. Errors arising from the direct use of signal enhancement data are well-understood (1) and quantitative analysis using normal clinical contrast agent doses without nonlinearity correc-tion would not normally be performed. The dual-bolus scheme simulations have shown this technique to be partially effective in reducing these errors in comparison to a single bolus method, although systematic errors still arise (due to residual nonlinearity) and precision is reduced due to low SNR in the prebolus AIF. In the C
[image:7.612.321.562.469.667.2]O L O R
FIG. 8. Box-and-whisker plots comparing nonlinearity correction methods for realistic levels of saturation efficiency and SNR (note difference in y-axis range for methods with high (left) and low (right) bias). Outliers (shown as individual points) are identified as data more than two times the inter-quartile range above/below the upper/lower quartiles. Results from methods where median errors exceed 5% are shown in plot A and those from methods where with smaller errors are shown in plot B. The native T1 based
method failed for approximately a quarter (223/1000) of the simu-lated experiments at SE¼1.025, as the peak AIF SI exceed the estimated S0.
C O L O R FIG. 9. Mean parameter estimates for volunteers (error bars show one standard deviation) showing systematic differences in results dependent on analysis method used. Data for the native T1based
method is not presented as this conversion failed in the majority of cases due to peak AIF signal exceeding estimated S0. Data for
resting vd are based on four of the volunteers, because in the
volunteer dual-bolus data resting MBF measurements were lower than expected from the simulation results, potentially due to residual contrast agent (which was not simulated) affecting the low dose AIF. Other work has suggested that model-based correction alongside dual-bolus acquisition may improve accuracy by accounting for nonlinearity in the myocardial data (10).
In a typical myocardial DCE-MRI sequence, baseline signal is generated from longitudinal magnetization which has only recovered to a small fraction of the equi-librium value. For example, assuming ideal saturation and the parameters used these simulations, baseline sig-nal will be approximately 5% and 10% of S0for blood and myocardium, respectively. Consequently, a small amount of residual magnetization after saturation has a substantial impact on baseline SI, as has been previously identified (17). Results from this study have shown that such biases influence the results of model-based nonli-nearity correction methods, and consequently the accu-racy of quantitative DCE-MRI analysis.
For native T1 based correction, 1% saturation imper-fection in the simulation leads to approximately 17% change in baseline blood SI compared with ideal satura-tion. This leads to equal errors in estimated S0, which propagate into large errors in estimated physiological parameters. Conversion failure caused by the peak AIF SI exceeding calculated S0has been observed in previous in vivo work using the native T1approach (5) as well as in this volunteer study.
The use of PDw images resulted in only very slight SE dependence for SE<1.06. The observed SE dependence was greater when used in conjunction with the dual-sequence technique, although still substantially lower than for the native T1-based approach. The initial estima-tion of baseline T1 in the PDw based method is extremely sensitive to noise or imperfect saturation induced bias in baseline SI (SE of 1.02 led to 52% error in estimated baseline T1). However, to a first-order approximation (ignoring the effect of the readout RF pulses) this bias would be completely reversed when cal-culating S0. The effects of the readout train introduce only a slight bias in S0,so the technique is largely robust to moderate saturation imperfections.
Similarly the use of the bookend T1 method to esti-mate SE on a per-study basis can largely remove the gross errors observed in the presence of small levels of over- or undersaturation using the native T1 approach, by accounting for the saturation imperfection. As for the simulation studies, comparable results between bookend T1and PDw based correction methods (for conventional acquisition) were observed in the volunteer data.
Any T1 based method is, however, susceptible to errors in the values of T1 used. Variation in results of quantitative analysis of DCE-MRI data (using a nonsatu-ration prepared sequence for imaging the female pelvis) as a result of variations in assumed or measured T1 has been reported previously (37). The results of the simula-tion study show that the bookend T1 technique is more susceptible to errors in postcontrast T1 than native T1 measurement. It is known that many myocardial T1 mapping techniques exhibit some systematic bias (for example underestimation in MOLLI based techniques)
(38). In practice, correction of known biases in T1 estima-tion before use in signal nonlinearity correcestima-tion may improve quantification accuracy.
Image noise can have a biasing effect on baseline SI when the SNR is sufficiently low that the distribution of SI values is asymmetrical. In the presence of noise, low SI values are, on average, higher than would be pre-dicted in the absence of noise. For the native T1 based method, an increased baseline SI leads to an increased calculated S0. Conversely, an increased baseline SI in the bookend T1based method leads to a decrease in cal-culated S0. These deviations can be observed in the pre-sented data for SE above around 1.03, where the oversaturation leads to SNR of around 2 or less in base-line of the AIF. This corresponds approximately to the SNR at which the Rician distribution loses symmetry (39) leading to biases in estimated physiological parame-ters that are not predicted in noiseless data.
For model based approaches, the noise sensitivity of the conversion process increases at higher concentrations as the SI-[CA] gradient decreases. Preliminary simula-tions with higher concentration AIF data (double and tri-ple that used in the main study) have shown that the precision of MBF and vd may initially improve with increased dose (due to higher SNR in SI data) but then deteriorate (due to increased noise sensitivity in the con-version process). The contrast agent administration pro-tocol (dose and dose rate) should thus be optimized to provide optimal precision of physiological parameter estimates. Despite this, low bias and good precision (both <5% at ideal saturation) were maintained even with 9mM peak concentration. In the volunteer data, both dual-sampling methods resulted in better or compa-rable coefficient of variation than bookend T1 or PDw based conversion for MBF estimation but poorer or com-parable coefficient of variation for vd. As MBF estimation is dominated by the early phases of the data and vd esti-mation by the later phases, these observations may be explainable by the observations above. Noise sensitivity during conversion of the early, high concentration, phases of the AIF in single-sampling techniques may limit precision of MBF estimation, while for vd estima-tion the inherently low SNR in the latter phases of the AIF in dual-sampling methods may dominate.
In addition to the errors discussed above, all methods break down above a threshold SE value. For the native T1based method, this occurs when the value of S0 calcu-lated assuming ideal saturation is lower than the peak SI encountered in the AIF. In this scenario, no positive T1 can thus describe these peak SI values for the defined model. For other model-based methods, the threshold is reached at a point where the baseline SI, which is partly inverted in the case of oversaturation, is nulled at the time of image readout. Above this threshold, negative baseline SI values are reconstructed as positive values, leading to substantial errors in the determined signal model parameters. In the case of the PDw based meth-ods, precision also worsens substantially at and around this threshold value (Figures 4 and 7).
when modern saturation pulses designed for cardiac applications (with efficiencies around 0.97–1.03) are used. However, for the dual-sequence method the reduced T1 sensitivity of the sequence used to measure the AIF also leads to a reduced threshold value, 1.015 in this simulation. Such levels of oversaturation are possi-ble, even with optimized saturation pulses such as BIR-4 or the hybrid adiabatic-rectangular pulse train (16,17). The mean SE observed in the volunteers in this study exceeded this threshold which could explain the rela-tively low MBF estimates by the dual-sequence method in comparison to the other model-based approaches. At SE of 1.03, errors in MBF for the standard dose dual-sequence simulation in the absence of noise were less than 9%, but errors in vd were more substantial (up to 44%). The threshold SE value at which bias arises will depend on multiple parameters, primarily TS and native T1. For absolute quantification using the dual-sequence approach, caution should be adopted when choosing an optimal TS for the low T1 sensitivity sequence. While shorter values (potentially achieved through alternative k-space trajectories) will reduce sensitivity, they may also lead to bias due to corruption of the baseline data as described above.
The discussion has been limited so far to considera-tions of errors introduced by image noise and imperfect saturation. For model-based approaches using independ-ent T1data (native or bookend), inaccuracy of those data could also introduce errors. Physiological parameter esti-mates were observed to show some sensitivity to simu-lated T1 errors although the biases introduced into the parameter estimates was small.
Limitations
Several limitations apply to this study. Only a single set of imaging parameters were evaluated whereas sensitiv-ities to various factors will vary between differing imple-mentations of the techniques. The analysis was limited to assessing variation of errors with SE and T1 measure-ment accuracy although additional sources of error that were not simulated (e.g., ineffective spoiling, inflow arte-fact (40), nonuniform sensitivity, slice profile, B1 inho-mogeneity and variations in bolus shape) could influence results. For correction of myocardial data, it was assumed that SI differences compared with blood arise solely through differences in T1. Variations in fac-tors contributing to S0 (including T2*, proton density and coil sensitivity) were not included. Similarly, the T2* shortening effects of contrast agent were not mod-elled, although this has been shown to be negligible at the short TE values used in DCE sequences (41). Contrast agent relaxivity was assumed to be identical in blood and myocardium and protons in both intra- and extracel-lular spaces were assumed to experience the effects of the contrast agent equally (i.e., fast water exchange was assumed) (42). While water exchange effects may lead to bias in absolute quantification of DCE-MRI data, this would be due to distortion of the tissue response curve. As all methods investigated in this study use the same tissue data, we would thus expect any bias due to water exchange to be consistent across the methods. The
simulations were limited to a single AIF shape, a single set of native T1values, SNR and three sets of physiologi-cal parameters using a basic one-compartment model that is a simplified representation of the myocardium (which can be more fully described by two-region mod-els) (5,43). Nonlinearity effects may be expected to vary with field strength and peak concentrations occurring in the LV blood pool and myocardium and noise induced bias may be more severe at lower SNR, particularly a lower field strengths.
In view of these limitations, the exact behavior of each method may exhibit substantial dependence on the pro-tocol implemented, equipment used and characteristics of the subject. However, the results presented demon-strate fundamental patterns of behavior that should be considered when performing quantitative myocardial DCE-MRI.
Finally, while sequence parameters were matched as far as possible between the simulation and volunteer study some protocol differences did exist. Notably the simulation study assumed each DCE sequence was com-menced with no contrast agent present, whereas in the volunteer protocol with multiple dual-bolus perfusion series this is not generally true.
CONCLUSIONS
Performance characteristics of nonlinearity correction methods for myocardial DCE-MRI, including a novel application of bookend T1data, have been assessed. The potential for substantial systematic errors to be intro-duced through application of nonlinear correction tech-niques at SNR values and SE values consistent with optimized saturation pulses and current technology, which yield good image quality for visual analysis, have been shown. Consequently caution should be adopted when comparing quantitative DCE-MRI results from studies using different nonlinearity correction methods, protocols or hardware.
The use of native T1based corrections has been shown to be very sensitive to imperfect saturation so should be avoided. The possibility that over-saturation consistent with the expected performance of RF saturation pulse trains optimized for cardiac MRI could lead to systematic errors in the dual-sequence approach has also been dem-onstrated and so this approach should be implemented with caution. Model-based methods using bookend T1 measurement or proton density weighted images were most robust to moderate levels of imperfection in SE, and may be preferable to approaches using independent sampling of the AIF.
ACKNOWLEDGMENTS
of this manuscript. The authors declare that they have no competing interests.
REFERENCES
1. Jerosch-Herold M. Quantification of myocardial perfusion by cardio-vascular magnetic resonance. J Cardiovasc Magn Reson 2010;12:57. 2. Selvanayagam J, Jerosch-Herold M, Porto I, Sheridan D, Cheng A,
Petersen S, Searle N, Channon K, Banning A, Neubauer S. Resting myocardial blood flow is impaired in hibernating myocardium. Circu-lation 2005;112:3289–3296.
3. Fritz-Hansen T, Hove J, Kofoed K, Kelbaek H, Larsson H. Quantifica-tion of MRI measured myocardial perfusion reserve in healthy humans: a comparison with positron emission tomography. J Magn Reson Imaging 2008;27:818–824.
4. Pack N, Dibella E, Wilson B, McGann C. Quantitative myocardial dis-tribution volume from dynamic contrast-enhanced MRI. Magn Reson Imaging 2008;26:532–542.
5. Broadbent D, Biglands J, Larghat A, Sourbron S, Radjenovic A, Greenwood J, Plein S, Buckley D. Myocardial blood flow at rest and stress measured with dynamic contrast-enhanced MRI: comparison of a distributed parameter model with a fermi function model. Magn Reson Med 2013;70:1591–1597.
6. Kellman P, Arai A. Imaging sequences for first pass perfusion–a review. J Cardiovasc Magn Reson 2007;9:525–537.
7. Utz W, Niendorf T, Wassmuth R, Messroghli D, Dietz R, Schulz-Menger J. Contrast-dose relation in first-pass myocardial MR perfu-sion imaging. J Magn Reson Imaging 2007;25:1131–1135.
8. Biglands J, Magee D, Boyle R, Larghat A, Plein S, Radjenovic´ A. Eval-uation of the effect of myocardial segmentation errors on myocardial blood flow estimates from DCE-MRI. Phys Med Biol 2011;56:2423– 2443.
9. Cernicanu A, Axel L. Theory-based signal calibration with single-point T1 measurements for first-pass quantitative perfusion MRI stud-ies. Acad Radiol 2006;13:686–693.
10. Hsu L-Y, Kellman P, Arai A. Nonlinear myocardial signal intensity correction improves quantification of contrast-enhanced first-pass MR perfusion in humans. J Magn Reson Imaging 2008;27:793–801. 11. Larsson H, Fritz-Hansen T, Rostrup E, Søndergaard L, Ring P,
Henriksen O. Myocardial perfusion modeling using MRI. Magn Reson Med 1996;35:716–726.
12. Gatehouse P, Elkington A, Ablitt N, Yang G-Z, Pennell D, Firmin D. Accurate assessment of the arterial input function during high-dose myocardial perfusion cardiovascular magnetic resonance. J Magn Reson Imaging 2004;20:39–45.
13. Kostler H, Ritter C, Lipp M, Beer M, Hahn D, Sandstede J. Prebolus€
quantitative MR heart perfusion imaging. Magn Reson Med 2004;52: 296–299.
14. Christian T, Rettmann D, Aletras A, Liao S, Taylor J, Balaban R, Arai A. Absolute myocardial perfusion in canines measured by using dual-bolus first-pass MR imaging. Radiology 2004;232:677–684. 15. Hsu L-Y, Rhoads K, Holly J, Kellman P, Aletras A, Arai A.
Quantita-tive myocardial perfusion analysis with a dual-bolus contrast-enhanced first-pass MRI technique in humans. J Magn Reson Imaging 2006;23:315–322.
16. Kim D, Gonen O, Oesingmann N, Axel L. Comparison of the effec-tiveness of saturation pulses in the heart at 3T. Magn Reson Med 2008;59:209–215.
17. Kim D, Oesingmann N, McGorty K. Hybrid adiabatic-rectangular pulse train for effective saturation of magnetization within the whole heart at 3 T. Magn Reson Med 2009;62:1368–1378.
18. Kim D, Cernicanu A, Axel L. B0 and B1-insensitive uniform T1-weighting for quantitative, first-pass myocardial perfusion magnetic resonance imaging. Magn Reson Med 2005;54:1423–1429.
19. Cron GO, Santyr G, Kelcz F. Accurate and rapid quantitative dynamic contrast-enhanced breast MR imaging using spoiled gradient-recalled echoes and bookend T(1) measurements. Magn Reson Med 1999;42: 746–753.
20. Cron G, Kelcz F, Santyr G. Improvement in breast lesion characteriza-tion with dynamic contrast-enhanced MRI using pharmacokinetic modeling and bookend T1 measurements. Magn Reson Med 2004;51: 1066–1070.
21. Parker G, Roberts C, Macdonald A, Buonaccorsi G, Cheung S, Buckley D, Jackson A, Watson Y, Davies K, Jayson G. Experimentally-derived functional form for a population-averaged high-temporal-resolution
arterial input function for dynamic contrast-enhanced MRI. Magn Reson Med 2006;56:993–1000.
22. Pintaske J, Martirosian P, Graf H, Erb G, Lodemann K-P, Claussen C, Schick F. Relaxivity of Gadopentetate Dimeglumine (Magnevist), Gadobutrol (Gadovist), and Gadobenate Dimeglumine (MultiHance) in human blood plasma at 0.2, 1.5, and 3 Tesla. Invest Radiol 2006; 41:213–221.
23. Pintaske J, Martirosian P, Graf H, Erb G, Lodemann K-P, Claussen C, Schick F. Erratum - Relaxivity of Gadopentetate Dimeglumine (Magnevist), Gadobutrol (Gadovist), and Gadobenate Dimeglumine (MultiHance) in human blood plasma at 0.2, 1.5, and 3 Tesla. Invest Radiol 2006;41:869–869.
24. Mehta A, Hoffbrand V. Haematology at a glance. 4th ed. Sussex, UK: Wiley Blackwell; 2014.
25. Vallee JP, Sostman HD, MacFall JR, Wheeler T, Hedlund LW, Spritzer CE, Coleman RE. MRI quantitative myocardial perfusion with compartmental analysis: a rest and stress study. Magn Reson Med 1997;38:981–989.
26. Kellman P, Wilson J, Xue H, Bandettini W, Shanbhag S, Druey K, Ugander M, Arai A. Extracellular volume fraction mapping in the myocardium, part 2: initial clinical experience. J Cardiovasc Magn Reson 2012;14:64.
27. Dabir D, Child N, Kalra A, et al. Reference values for healthy human myocardium using a T1 mapping methodology: results from the Inter-national T1 Multicenter Cardiovascular Magnetic Resonance Study. J Cardiovasc Magn Reson 2014;16:69.
28. Larsson HB, Fritz-Hansen T, Rostrup E, Søndergaard L, Ring P, Henriksen O. Myocardial perfusion modeling using MRI. Magn Reson Med 1996;35:716–726.
29. Fritz-Hansen T, Rostrup E, Larsson H, Søndergaard L, Ring P, Henriksen O. Measurement of the arterial concentration of Gd-DTPA using MRI: a step toward quantitative perfusion imaging. Magn Reson Med 1996;36:225–231.
30. Husso M, Sipola P, Kuittinen T, Manninen H, Vainio P, Hartikainen J, Saarakkala S, T€oyr€as J, Kuikka J. Assessment of myocardial perfu-sion with MRI using a modified dual bolus method. Physiol Meas 2014;35:533–547.
31. Su M-Y, Lee B-C, Wu Y-W, Yu H-Y, Chu W-C, Tseng W-Y. Perfusion of residual viable myocardium in nontransmural infarct zone after intervention: MR quantitative myocardial blood flow measurement. Radiology 2008;249:820–828.
32. Cheng A, Pegg T, Karamitsos T, Searle N, Jerosch-Herold M, Choudhury R, Banning A, Neubauer S, Robson M, Selvanayagam J. Cardiovascular magnetic resonance perfusion imaging at 3-Tesla for the detection of coronary artery disease. J Am Coll Cardiol 2007;49: 2440–2449.
33. Karamitsos T, Ntusi N, Francis J, Holloway C, Myerson S, Neubauer S. Feasibility and safety of high-dose adenosine perfusion cardiovas-cular magnetic resonance. J Cardiovasc Magn Reson 2010;12:66. 34. Ogg RJ, Kingsley RB, Taylor JS. WET, a T1- and B1-insensitive
water-suppression method for in vivo localized 1H NMR spectroscopy. J Magn Reson B 1994;104:1–10.
35. Kellman P, Wilson J, Xue H, Ugander M, Arai A. Extracellular vol-ume fraction mapping in the myocardium, part 1: evaluation of an automated method. J Cardiovasc Magn Reson 2012;14:63.
36. Groothuis J, Kremers F, Beek A, Brinckman S, Tuinenburg A, Jerosch-Herold M, van Rossum A, Hofman M. Comparison of dual to single contrast bolus magnetic resonance myocardial perfusion imag-ing for detection of significant coronary artery disease. J Magn Reso-nan Imaging 2010;32:88–93.
37. Heye T, Boll D, Reiner C, Bashir M, Dale B, Merkle E. Impact of pre-contrast T10 relaxation times on dynamic pre-contrast-enhanced MRI pharmacokinetic parameters: T10 mapping versus a fixed T10 refer-ence value. J Magn Reson Imaging 2014;39:1136–1145.
38. Kellman P, Hansen M. T1-mapping in the heart: accuracy and preci-sion. J Cardiovasc Magn Reson 2014;16:2.
39. Gudbjartsson H, Patz S. The rician distribution of noisy mri data. Magn Reson Med 1995;34:910–914.
40. Garpebring A, Wirestam R,Ostlund N, Karlsson M. Effects of inflow€
and radiofrequency spoiling on the arterial input function in dynamic contrast-enhanced MRI: a combined phantom and simula-tion study. Magn Reson Med 2011;65:1670–1679.
42. Donahue KM, Weisskoff RM, Burstein D. Water diffusion and exchange as they influence contrast enhancement. J Magn Reson Imaging 1997;7:102–110.
43. Pack N, DiBella E. Comparison of myocardial perfusion estimates from dynamic contrast-enhanced magnetic resonance imaging with four quantitative analysis methods. Magn Reson Med 2010;64:125–137.
SUPPORTING INFORMATION
AQ1 Additional Supporting Information may be found in the online version of this article.
SUP. FIG. S1. Ground truth concentration-time curves used in the simulations.
SUP. FIG. S2. AIF signal-time curves generated in the simulations assuming ideal saturation efficiency. The red line shows the standard AIF (normal acquisition, full dose), blue shows the reduced dose pre-bolus for the dual-bolus method and magenta shows the AIF from the full dose acquired using the lower sensitivity sequence for the dual-sequence method. Shad-ing indicates one standard deviation of signal values at each time point.
SUP. FIG. S3. Myocardial signal-time curves generated in the simulations assuming ideal saturation efficiency. Each line shows a different tissue sta-tus. The same myocardial signal data (full dose, standard acquisition sequence) is used for each method. Shading indicates one standard devia-tion of signal values at each time point.
SUP. FIG. S4. Signal enhancement-time curves used for deconvolution without nonlinearity correction (assuming ideal saturation efficiency). Each coloured line shows a different tissue status and the black line shows the AIF. Shading indicates one standard deviation of signal values at each time point.
SUP. FIG. S5. Estimated concentration -time curves used for deconvolution converted using native signal and T1 (assuming ideal saturation efficiency).
Each coloured line shows a different tissue status and the black line shows the AIF (blood concentration). Shading indicates one standard deviation of signal values at each time point.
SUP. FIG. S6. Estimated concentration -time curves used for deconvolution converted using native signal from the saturation recovery sequence and the proton density weighted sequence (assuming ideal saturation effi-ciency). Each coloured line shows a different tissue status and the black line shows the AIF (blood concentration). Shading indicates one standard deviation of signal values at each time point.
SUP. FIG. 7. Estimated concentration -time curves used for deconvolution converted using bookend signal and T1 (assuming ideal saturation effi-ciency). Each coloured line shows a different tissue status and the black line shows the AIF (blood concentration). Shading indicates one standard deviation of signal values at each time point.
SUP. FIG. 8. Signal enhancement-time curves used for deconvolution for the dual-bolus method (assuming ideal saturation efficiency). Each coloured line shows a different tissue status and the black line shows the AIF (scaled by the bolus:pre-bolus ratio). Shading indicates one standard deviation of signal values at each time point.
SUP. FIG. 9. Estimated concentration -time curves used for deconvolution estimated using the dual-sequence method and converted using native sig-nal from the saturation recovery sequence and the proton density weighted sequence (assuming ideal saturation efficiency). Each coloured line shows a different tissue status and the black line shows the AIF (blood concentra-tion). Shading indicates one standard deviation of signal values at each time point.
SUP. FIG. 10. example signal-time data from one volunteer.
Supporting Table S1 - Imaging parameters for the volunteer study.