http://eprints.whiterose.ac.uk/103745/ Version: Accepted Version
Article:
Hao, Y., Kang, J. orcid.org/0000-0001-8995-5636 and Wörtche, H. (2016) Assessment of the masking effects of birdsong on the road traffic noise environment. Journal of the Acoustical Society of America, 2 (140). pp. 978-987. ISSN 0001-4966
https://doi.org/10.1121/1.4960570
eprints@whiterose.ac.uk https://eprints.whiterose.ac.uk/
Reuse
Unless indicated otherwise, fulltext items are protected by copyright with all rights reserved. The copyright exception in section 29 of the Copyright, Designs and Patents Act 1988 allows the making of a single copy solely for the purpose of non-commercial research or private study within the limits of fair dealing. The publisher or other rights-holder may allow further reproduction and re-use of this version - refer to the White Rose Research Online record for this item. Where records identify the publisher as the copyright holder, users can verify any specific terms of use on the publisher’s website.
Takedown
If you consider content in White Rose Research Online to be in breach of UK law, please notify us by
Journal of the Acoustical Society of America, Volume 140 (2), August 2016, 978 987 Page
Assessment of the masking effects of birdsong on the
road traffic noise environment
Yiying Haoa, Jian Kanga*, Heinrich Wörtcheb
a
School of Architecture, University of Sheffield, Western Bank, Sheffield S10 2TN, United Kingdom
b
INCAS3, Assen, Dr. Nassaulaan 9, 9401 HJ Assen, The Netherlands
* Corresponding author
This study aims to explore how the soundscape quality of traffic noise environments can be improved by the masking effects of birdsong in terms of four soundscape characteristics, i.e., Perceived Loudness, Naturalness, Annoyance and Pleasantness. Four factors that may influence the masking effects of birdsong (i.e., distance of the receiver from a sound source, loudness of masker, occurrence frequencies of masker, and visibility of sound sources) were examined by listening tests. The results show that the masking effects are more significant in the road traffic noise environments with lower sound levels (e.g. <52.5 dBA), or of distance from traffic (e.g. >19 m). Adding birdsong can indeed increase the Naturalness and Pleasantness of the traffic noise environment at different distances of the receiver from a road. Naturalness, Annoyance and Pleasantness, but not Perceived Loudness, can be altered by increasing the birdsong loudness (i.e., from 37.5 to 52.5 dBA in this study). The Pleasantness of traffic noise environments increases significantly from 2.7 to 6.7, when the occurrence of birdsong over a period of 30 s is increased from 2 to 6 times. The visibility of the sound source also influences the masking effects, but its effect is not as significant as the effects of the three other factors.
PACS numbers: 43.50.Ba, 43.50.Fe, 43.50.Qp, 43.66.Dc,
2016 Journal of the Acoustical Society of America
Date Received: 20 August 2014 Date Accepted: 14 July 2016 Publish online: 12 August 2016
I.INTRODUCTION
Journal of the Acoustical Society of America, Volume 140 (2), August 2016, 978 987 Page assessments, integrated studies of soundscape and landscape have also been conducted recently.
16,17,18,19
Great attention has long been paid to research on auditory masking, but the scope of masking is mainly limited to the domains of acoustics and psychoacoustics. Although early studies of masking were mainly developed based on experiments using pure tones, 20 the definition and understanding of masking have recently become rather diverse. Masking is defined from the viewpoint of both the acoustic properties of sound and human hearing.21,22,23,24,25,26 Among the definitions, two main categories of masking, namely “energetic masking” and “informational masking”, have been widely accepted and investigated. 27,28,29,30
However, in real-life soundscapes, the roles of sound source perception and cognition are highly relevant to masking effects.31 Thus, it is essential to study masking in soundscapes with commonly recognised sound sources in daily life (e.g., traffic noise and bird chirping). It has also been observed that the masking capability of natural sounds is lower than that predicted by Moore et al.’s model of energetic masking. 32,33Context plays a vital role in determining masking effects;32 hence, informational masking that considers the effects of different contexts28 should be an important concern in soundscape studies, in addition to energetic masking. Indeed, masking is explained as a hearing phenomenon through which soundscape characteristics are altered by the presence of interfering sound event(s) in specific contexts. The contexts are derived from real-life sound environments, such as the variable distances between receivers and sound sources as a result of urban planning4,34, different occurrence frequencies of sound events (e.g., bird chirping varying by time of day and bird density35,36,37), and direct visibility of sound sources.
This study therefore aims to explore how four key factors, namely the distance of the receiver from a sound source, the loudness of the masker, the occurrence frequencies of the masker and the visibility of the sound sources, may affect the masking effects of birdsong on road traffic noise, which was accomplished by carrying out a series of listening tests. Two common sounds, road traffic noise and birdsong, were selected as the target and masker, respectively, because they have considerable interactions in urbanised areas38 and because birdsong has been demonstrated to be the most preferred natural sound in the traffic noise environment.14,17
II. METHODOLOGY
Based on the analysis of recordings of typical real sound environments dominated by road traffic noise and birdsong, listening tests were designed using a series of reproduced acoustic stimuli.
A. Sound recordings
Journal of the Acoustical Society of America, Volume 140 (2), August 2016, 978 987 Page simultaneous multi-channel recordings were collected at distances of 1, 4, 9, 19 and 50 m from the side of Crookes Valley Road during summer 2013 rush hours. Furthermore, photographs were captured from the locations where the microphones were installed, facing the road, to record the scenes where the sound events occurred. To record the temporal changes in both road traffic noise and birdsong, single-channel sound recordings were performed on a pathway at a distance of 2 m from the road side of Hoofdlaan during sunny and windless weekdays in September 2013. The recordings started at sunrise (approximately 07.30) and ended at sunset (approximately 19.30)39, considering the effect of daytime on bird chirping behaviour35. Six five-minute sound recordings collected each hour over the 12 hours of daytime were ultimately collected.
Journal of the Acoustical Society of America, Volume 140 (2), August 2016, 978 987 Page (a) (b)
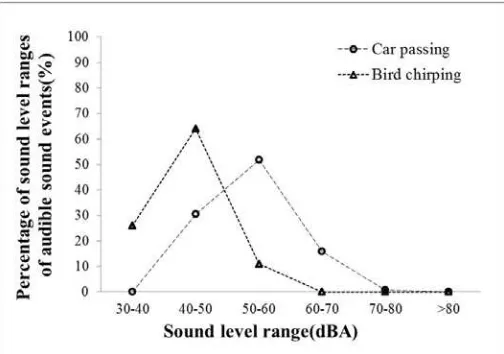
[image:5.612.181.433.282.459.2]Fig. 1. Examples of annotated sound events of the recordings: (a) car passing; (b) bird chirping.
Fig. 2. Time percentage of each sound level range of cars passing over their total time history.
[image:5.612.186.434.498.687.2]Journal of the Acoustical Society of America, Volume 140 (2), August 2016, 978 987 Page Table 1. Frequencies of the sound events of cars passing and birds chirping over 5 minutes.
Sound event
Period of time
07.30-08.30 08.30-09.30 09.30-10.30 10.30-11.30 11.30-12.30 12.30-13.30 13.30-14.30 14.30-15.30 15.30-16.30 16.30-17.30 17.30-18.30 18.30-19.30 Cars passing
14 18 13 8 18 13 16 18 20 22 24 16
Birds chirping
23 25 30 19 29 25 25 4 6 7 1 1
B. Acoustic stimuli
Four stimuli groups, Groups A, B, C and D, were reproduced to examine the four previously mentioned factors: the distance of the receiver from a road, loudness of masker, occurrence frequencies of masker and visibility of sound sources, respectively. The acoustic stimuli were constructed based on the recorded audio using Adobe Audition CS6. The length of the acoustic stimuli was confirmed to be 30 s according to the study on the time scales of participants’ constant assessments conducted by Pheasant et al.,16 although different lengths of acoustic stimuli were used in previous listening experiments on masking and soundscape.14,16,17 The audio clips of birds chirping were cut from the single-channel sound recordings at Hoofdlaan when the background noise was lower than 36.2 dBA. To make the acoustic stimuli more realistic, multiple patterns of bird chirping recordings from common urban passerine bird species in Europe42,43 were included, e.g., Great Tit, Common Blackbird and Sparrow. The frequencies of birds chirping mainly fell within the range 2-10 kHz. The audio clips of cars passing were cut directly from the recordings captured by the two main roads.
Group A is composed of 10 acoustic stimuli to explore how the distance of the receiver from a road influences the masking effects. Five acoustic stimuli, constituting Subgroup I, were the original recordings gathered at distances of 1, 4, 9, 19 and 50 m from Crookes Valley Road, which remain the different loudness and spectral. The other five acoustic stimuli, constituting Subgroup II, were reproduced by adding the same birds chirping at 52.5 dBA, which were audible for 8 s in each stimulus.
Group B, in which 20 acoustic stimuli were included, was formed to investigate how the loudness of the masker influenced the masking effects. Two audio clips of birds chirping (8 s, 4 events) at 52.5 dBA (high) and 37.5 dBA (low) were combined with 10 audio clips of cars passing at different sound pressure levels of noisy traffic (i.e., 57.5, 60, 62.5, 65, and 67.5 dBA) and quieter traffic (i.e., 42.5, 45, 47.5, 50, and 52.5 dBA), respectively, where a 2.5-dBA step was used to represent the differences in masking effects within a sound level range of 10 dBA
1,14
.
Journal of the Acoustical Society of America, Volume 140 (2), August 2016, 978 987 Page were combined with two audio clips of cars passing at 62.5 (high) and 47.5 dBA (low). The occurrence frequency of cars passing was set to a constant value of 2 based on the above-discussed sound analysis.
In Group D, the five acoustic stimuli that were used in Subgroup II of Group A were played back with the pictures captured at the sound recording locations. Ultimately, forty-five 30-s acoustic stimuli dominated by the sound events of cars passing and birds chirping were reproduced.
Additionally, twenty 30-s acoustic stimuli of daily-life urban sounds at SPLs < 70dBA, including construction, aircraft, human voices, steps, wind rustling leaves and fountains, were added to the stimuli of the four groups in random orders to weaken the subjects’ consciousness of the particular purpose of the experiment on traffic noise and birdsong.
C. Participants and evaluation procedure
Thirty subjects participated in the experiment, including 12 women and 18 men, aged 18-35 years. The number of participants was initially determined based on previous related studies17,44 and further examined by statistical analysis. The hearing threshold levels of all participants were tested using an audiometer for all frequencies (125, 250, 500, 1000, 2000, 3000, 4000, 6000 and 8000 kHz), and it was found that all participants had normal hearing. A different 30-s audio clip, which was directly cut from one sound recording from Hoofdlaan, was played to the 30 participants to test their capability for sound source recognition. The audio clip included traffic noise, birdsong, dog barking and human voice. All of the participants recognised and indicated that they heard traffic noise and birdsong after listening.
The 65 acoustic stimuli were arranged in a random order and divided into three groups to provide breaks to avoid listener fatigue. The order in which the stimuli were presented to the participants was randomized to minimize order effects. The acoustic stimuli and the pictures were presented through headphones (Sennheiser HD 558) and a projector (Hitachi ED–X33), respectively. The calibration was carried out by using a dummy head (Neumann KU100) before the experiment. The participants were seated in a chair comfortably in an anechoic chamber. The background noise level was approximately 25.0 dBA.
The participants were required to score the sounds after the end of each sound in terms of four adjectives describing the soundscape characteristics, “Loud”, “Natural”, “Annoying” and “Pleasant”, on a scale of 0–10, with 0 representing “Not at all” and 10 “Extremely”, based on the basic box diagram from ISO W54. The adjectives have been identified as the characteristics of soundscape quality in previous studies, one of the most commonly used of which is pleasantness13,14,45. For the perceptual assessment of traffic noise, perceived annoyance is an important and frequently examined characteristic1,4,46,47. Considering the significant roles of perceived loudness in the masking study14,32,33 and naturalness in human relaxation9,48,49, the two characteristics were also included.
D. Data analysis
Journal of the Acoustical Society of America, Volume 140 (2), August 2016, 978 987 Page by the participants in the evaluation.
X X (1)
where s = stimuli, q = questions, Xs,q,p = initial answer of the person p for the stimulus s and the
question q, Xnorm,s,q,p = normalized answer of the person p for the stimulus s and the question q,
X = sum of squares of all the answers for person p, X = average of the sum of squares for all subjects, and X = X .
To test the concordance between the subjects on the evaluation of soundscape, an analysis of two-way mixed intra-class correlation (ICC) with a 95% confidence interval was employed. The average intra-class correlation coefficients of Perceived Loudness, Naturalness, Annoyance and Pleasantness were 0.969, 0.946, 0.962 and 0.872, respectively, which indicate high agreement in the judgements of the four characteristics and the sufficiency of the number of participants. The high average intra-class correlation coefficients also reflect the reliability of the judgements on the evaluation of soundscape as a result of little order effect. The average intra-class correlation coefficients of Pleasantness were lower than those of the three other characteristics, demonstrating that the participants showed a lower degree of consistency when evaluating Pleasantness.
A one-way analysis of variance (ANOVA) was conducted to examine the statistically significant mean differences among the acoustic stimuli caused by the four factors (i.e. distance, loudness, occurrence frequency and visibility) in terms of the scores of the four characteristics. Wilcoxon-signed rank tests were further performed to examine the differences between each pair of acoustic stimuli.
III. RESULTS
Table 2 illustrates all the mean scores of the psychological evaluation of the four soundscape characteristics of the road traffic noise environments.
A. Effects of distance of the receiver from a sound source on masking
Five acoustic stimuli of traffic noise at distances of 1, 4, 9, 19 and 50 m from the road (at 69.8, 65.3, 62.3, 56.0 and 47.0 dBA) with and without birdsong at 52.5 dBA in Group A were examined to determine how the distances influenced the masking effects. The one-way ANOVA shows the statistically significant mean differences among the five acoustic stimuli without birdsong in Perceived Loudness [F (4, 145) = 88.99, p = 0.000], Naturalness [F (4, 145) = 19.09,
p = 0.000], Annoyance [F (4, 145) = 26.51, p = 0.000] and Pleasantness [F (4, 145) = 7.33, p
=0.000], and five acoustic stimuli with birdsong in Perceived Loudness [F (4, 145) = 123.07, p = 0.000], Naturalness [F (4, 145) = 61.57, p = 0.000], Annoyance [F (4, 145) = 100.04, p = 0.000] and Pleasantness [F (4, 145) = 67.84, p =0.000]. The results demonstrate that adding birdsong can indeed alter the soundscape characteristics of the road traffic noise environment.
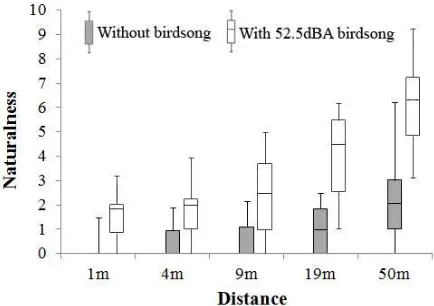
Journal of the Acoustical Society of America, Volume 140 (2), August 2016, 978 987 Page quieter at greater distances. The first row of Table 2 illustrates the mean values of the four characteristics of the road traffic noise environment at the five distances from the road without and with birdsong at 52.5 dBA. The results of the Wilcoxon-signed rank tests reveal that none of the five stimuli have significant differences (p < 0.05) in Perceived Loudness when adding birdsong, but all have significant differences in Naturalness.
[image:9.612.70.564.283.683.2]As shown in Table 2, the Perceived Loudness of the traffic noise environment is similar between the with- and without-birdsong conditions, with a maximum mean value difference of 1.2 at 50 m. However, Naturalness is largely increased when birdsong is added, especially when the road traffic noise fluctuates less and becomes quieter at 19 and 50 m. For example, with birdsong, Naturalness increases by 3.2 at 19 m and by 3.9 at 50 m (see Table 2). Fig. 4 further shows the statistical distribution of the evaluation scores of Naturalness with and without birdsong at the five distances, indicating the high agreement in evaluation of Naturalness.
Table 2. Mean values of the psychological evaluations of the four characteristics.
Perceived Loudness Naturalness Annoyance Pleasantness
Distance of the perceiver receiver from a sound source (m) (Group A) No birdsong 52.5dBA birdsong No birdsong 52.5dBA birdsong No birdsong 52.5dBA birdsong No birdsong 52.5dBA birdsong
N* Y* N Y N Y N Y
1 9.1 8.8 8.9 0.3 1.5 1.8 8.4 8.2 7.9 0.4 0.5 0.9
4 7.7 7.4 8.2 0.3 1.9 2.1 7.3 6.9 6.8 0.7 1.0 1.6
9 6.8 6.6 7.0 0.5 2.3 3.1 6.9 6.0 6.5 1.1 1.3 2.6
19 5.6 5.3 5.4 0.9 4.1 4.5 5.4 4.2 4.8 1.2 2.4 4.0
50 3.6 2.4 2.7 2.4 6.3 6.5 4.1 1.7 1.8 1.9 5.5 6.7
Traffic noise (dBA) (Group B) 37.5dBA birdsong 52.5dBA birdsong 37.5dBA birdsong 52.5dBA birdsong 37.5dBA birdsong 52.5dBA birdsong 37.5dBA birdsong 52.5dBA birdsong
42.5 2.6 2.4 6.2 5.9 1.9 1.9 4.3 5.0
45.0 3.5 2.8 6.1 5.9 2.3 2.1 5.0 5.1
47.5 3.6 3.0 6.0 6.1 2.7 2.3 5.3 5.6
50.0 3.9 3.3 5.1 6.4 4.2 3.0 3.9 4.9
52.5 4.4 3.4 4.0 6.2 5.2 3.9 2.7 4.0
57.5 6.0 5.7 3.7 4.2 4.8 5.9 1.8 2.1
60.0 6.7 6.4 3.4 3.7 5.4 6.3 1.5 1.4
62.5 7.4 7.0 3.1 3.4 5.6 6.3 1.4 1.4
65.0 7.9 7.7 2.9 3.2 6.4 6.9 1.3 1.1
67.5 8.1 7.8 2.0 2.1 7.3 7.3 1.2 1.1
Occurrence frequencies of birdsong (Group C) 47.5dBA traffic noise 62.5dBA traffic noise 47.5dBA traffic noise 62.5dBA traffic noise 47.5dBA traffic noise 62.5dBA traffic noise 47.5dBA traffic noise 62.5dBA traffic noise
2 2.7 5.3 4.7 3.0 2.3 5.4 2.7 1.5
3 2.7 5.1 5.1 3.1 2.0 5.0 4.9 1.5
4 2.6 5.2 5.8 3.2 2.1 4.8 5.1 1.6
5 2.7 5.1 6.2 3.4 1.7 4.6 5.5 2.2
6 2.8 5.2 6.4 3.8 1.3 4.2 6.7 2.4
* N means audio only; Y means with view.
without-Journal of the Acoustical Society of America, Volume 140 (2), August 2016, 978 987 Page birdsong conditions occur only at the distances farther than 19 m. With birdsong, the Annoyance of the traffic noise environment decreases by 1 at 19 m and 2.3 at 50 m, as shown in Table 2. Pleasantness can be significantly increased by adding birdsong; for example, at a distance of 50 m, the Pleasantness of the traffic noise environment is only 1.9, whereas it increases to 5.5 when birdsong is mixed (see Table 2).
Fig. 4. Box-and-Whisker Plots of the psychological evaluations of Naturalness of the road traffic noise environments at distances of 1, 4, 9, 19 and 50 m from the road without birdsong and with birdsong at 52.5 dBA, showing the statistical distribution of the evaluation scores.
B. Effects of birdsong loudness on masking
The second row of Table 2 shows the mean scores of the psychological evaluation of the four soundscape characteristics of the road traffic noise environments with birdsong at 52.5 and 37.5 dBA in Group B. Based on the sound analysis of the sound recordings in Section 2.1, the road traffic noise environments are classified into relatively quiet (i.e., 42.5-52.5 dBA) and noisy (i.e., 57.5-67.5 dBA) environments. Table 2 shows that, in general, the score differences under the two conditions (i.e., birdsong at 52.5 and 37.5 dBA) become larger with the increase in loudness of traffic noise from 42.5 dBA and then become smaller with the increase in loudness after the sound level reaches 52.5 dBA. The effects of masker loudness on masking will be discussed in both quiet and noisy traffic noise environments, respectively.
1. Quiet traffic noise environment
Journal of the Acoustical Society of America, Volume 140 (2), August 2016, 978 987 Page To assess whether significant differences in the masking effects exist between 52.5 dBA birdsong and 37.5 dBA birdsong, Wilcoxon-signed rank tests were conducted. The results reveal that the five acoustic stimuli of quiet traffic noise are not statistically significantly different in Perceived Loudness (p > 0.05), although the mean value differences are not small, 1.0 at 52.5 dBA and 0.6 at 50 dBA (see Table 2), which indicates that when the traffic noise is less than 52.5 dBA, louder birdsong does not affect Perceived Loudness. However, in the Wilcoxon-signed rank tests, the acoustic stimuli of traffic noise at 50.0 and 52.5 dBA are significantly different in Naturalness, Annoyance and Pleasantness, which indicates that when the traffic noise increases, louder birdsong can effectively improve the soundscape quality.
Fig. 5-7 illustrates the statistical distribution of the evaluation scores of Naturalness, Annoyance and Pleasantness with 37.5 and 52.5dBA birdsong. As shown in Table 2, with 52.5 dBA birdsong, Naturalness changes minimally when the traffic noise increases, but with 37.5 dBA birdsong, Naturalness decreases sharply when the traffic noise is louder than 47.5 dBA (see Fig. 5). Annoyance due to traffic noise is significantly higher with 37.5 dBA birdsong than with 52.5 dBA birdsong when the traffic noise is louder than 50 dBA (see Table 2 & Fig. 6). For example, the level of Annoyance is 5.2 with 37.5 dBA birdsong and 3.9 with 52.5 dBA birdsong when the traffic noise is 52.5 dBA (see Table 2). Pleasantness increases slightly and then decreases significantly above 47.5 dBA, with either 37.5 or 52.5 dBA birdsong, and it is always higher when birdsong is louder (see Table 2 & Fig. 7). The increase in Pleasantness below 47.5 dBA might be caused by the failure in sound source recognition when the traffic noise is too low.
It appears that birdsong loudness has stronger effects on the evaluation of the four characteristics in the traffic environment at 50.0 and 52.5 dBA than the other sound levels.
[image:11.612.84.286.426.565.2]Fig. 5. Box-and-Whisker Plots of the psychological evaluations of Naturalness of the road traffic noise environments at 42.5, 45, 47.5, 50, and 52.5dBA with 37.5 and 52.5dBA birdsong, showing the statistical distribution of the evaluation scores.
Journal of the Acoustical Society of America, Volume 140 (2), August 2016, 978 987 Page Fig. 7. Box-and-Whisker Plots of the psychological evaluations of Pleasantness of the road traffic noise environments at 42.5, 45, 47.5, 50, and 52.5dBA with 37.5 and 52.5dBA birdsong, showing the statistical distribution of the evaluation scores.
2. Noisy traffic noise environment
To further explore the effects of masker loudness on masking when the noise is loud, five acoustic stimuli of loud road traffic noise (57.5, 60.0, 62.5, 65.0 and 67.5 dBA) were combined with birdsong at 52.5 and 37.5 dBA. The one-way ANOVA shows the significant mean differences among the five acoustic stimuli with 52.5dBA birdsong in Perceived Loudness [F (4, 145) = 16.00, p = 0.000], Naturalness [F (4, 145) = 5.06, p = 0.001], Annoyance [F (4, 145) = 4.88, p = 0.001] and Pleasantness [F (4, 145) = 3.97, p =0.004], and five acoustic stimuli with 37.5dBA birdsong in Perceived Loudness [F (4, 145) = 16.39, p = 0.000], Naturalness [F (4, 145) = 5.05, p = 0.001], Annoyance [F (4, 145) = 21.76, p = 0.000] and Pleasantness [F (4, 145) = 9.89, p =0.000].
For all four characteristics, the five acoustic stimuli show no significant differences between 52.5 and 37.5 dBA birdsong in the Wilcoxon-signed rank tests. As shown in Table 2, the mean values are rather similar between the two sound pressure levels of birdsong, which indicates birdsong loudness has little effect on the masking effects when the traffic noise is louder than 57.5 dBA. It is interesting to note that the mean values of Annoyance are higher with 52.5 dBA birdsong than with 37.5 dBA when the traffic noise is noisy.
Moreover, to elucidate the relationships between the four characteristics, a two-tailed bivariate analysis and linear regressions between each pair of characteristics were conducted with the mean values reported in Table 2. The results show that Annoyance has a significant positive relationship with Perceived Loudness (p<0.01, R2 = 0.904) and a negative relationship with Naturalness (p<0.01, R2 = 0.883). Pleasantness has a significant negative relationship with Perceived Loudness (p<0.01, R2 = 0.905) and a positive relationship with Naturalness (p<0.01, R2 = 0.905).
C. Effects of occurrence frequencies of birdsong on masking
Journal of the Acoustical Society of America, Volume 140 (2), August 2016, 978 987 Page noise environment (i.e., 62.5 dBA). Table 2 shows that, generally, compared with the quiet traffic noise environment, the occurrence frequencies of birdsong appear to have a weaker influence on the masking effects in the noisy traffic noise environments.
1. Quiet traffic noise environment
To study the effects of occurrence frequencies on the masking effects when the noise is relatively
quiet, five acoustic stimuli of 42.5 dBA birdsong (2, 3, 4, 5 and 6 repetitions) combined with 47.5 dBA traffic noise in Group C were examined. The one-way ANOVA shows significant differences in the masking effects among the five acoustic stimuli in Naturalness [F (4, 145) = 7.17, p = 0.000], Annoyance [F (4, 145) = 2.52, p = 0.044] and Pleasantness [F (4, 145) = 23.36,
p =0.000] but not for Perceived Loudness (p = 0.587), which indicates that the occurrence frequency of birdsong indeed influences the masking effects in terms of the soundscape characteristics, excluding Perceived Loudness.
Table 2 demonstrates that when the occurrence frequency increases from 2 to 6 repetitions, Naturalness increases steadily from 4.7 to 6.4, Annoyance decreases slightly from 2.3 to 1.3, and Pleasantness increases significantly from 2.7 to 6.7. Compared with the Naturalness and Annoyance, the occurrence frequency of birdsong has a greater effect on Pleasantness. It is interesting to note that when the occurrence frequency increases from 2 to 3, Pleasantness increases sharply from 2.7 to 4.9 (see Table 2), which could be attributed to the fact that three times the amount of birdsong is necessary to make the birdsong much more noticeable.
2. Noisy traffic noise environment
Five acoustic stimuli of birdsong (2, 3, 4, 5 and 6 repetitions) combined with noisy traffic noise at 62.5 dBA were also examined. The one-way ANOVA only shows the significant mean differences among the five acoustic stimuli in Pleasantness [F (4, 145) = 2.91, p =0.024], but the differences between the occurrence frequencies are small, with a maximum value of 0.9 between 2 and 6 repetitions (see Table 2). Therefore, when the traffic noise is noisy, the occurrence frequency of birdsong has little effect on the masking effects. Fig. 8 further illustrates the statistical distribution of the evaluation scores of Pleasantness with birdsong (2, 3, 4, 5 and 6 repetitions) in both quiet and noisy traffic noise environments, showing a significant and highly-concordant increase of scores of Pleasantness as the sound level of traffic noise decreases from 62.5 to 47.5 dBA.
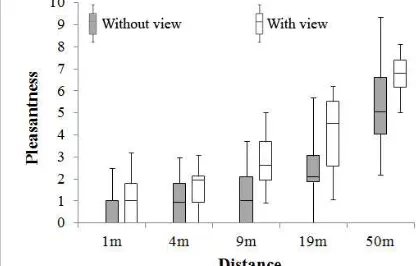
D. Effects of visibility of sound sources on masking
To initially investigate the effects of visibility of sound source on masking, five acoustic stimuli of traffic noise and birdsong in Group A were played with and without the pictures of in-situ scenes. The one-way ANOVA shows significant differences in masking effects among the five stimuli with the pictures of in-situ scenes in Perceived Loudness [F (4, 145) = 130.46, p = 0.000], Naturalness [F (4, 145) = 34.54, p = 0.000], Annoyance [F (4, 145) = 64.02, p = 0.000] and Pleasantness [F (4, 145) = 34.07, p =0.000]. In Wilcoxon-signed rank tests, only Pleasantness of the traffic noise at distances of 9, 19 and 50 m have significant differences between the with- and
without-views conditions (p < 0.05).
Journal of the Acoustical Society of America, Volume 140 (2), August 2016, 978 987 Page noise and birdsong environment at distances of 1, 4, 9, 19 and 50 m with and without the pictures of in-situ scenes being played. As shown in Table 2, Pleasantness showed an increase of 1.3 at a distance of 9 m, an increase of 1.6 at 19 m and an increase of 1.2 at 50 m when the in-situ scenes were played. Fig. 9 further illustrates the statistical distribution of the evaluation scores of Pleasantness with and without the in-situ scenes.
[image:14.612.300.510.167.300.2]Fig. 8. Box-and-Whisker Plots of the psychological evaluations of Pleasantness of the road traffic noise environments with different occurrence frequencies of birdsong (2, 3, 4, 5 and 6 times), showing the statistical distribution of the evaluation scores.
Fig. 9. Box-and-Whisker Plots of the psychological evaluations of Pleasantness of the road traffic noise environments at distances of 1, 4, 9, 19 and 50 m from the road with and without view of in-situ scene, showing the statistical distribution of the evaluation scores
IV.DISCUSSIONS AND CONCLUSIONS
This study aimed to explore how four factors, namely the distance from a sound source, loudness of a masker, occurrence frequencies of a masker, and visibility of sound sources, influence the masking effects of birdsong on the road traffic noise environment using psychological listening experiments. The study firstly examined the factors that were raised from landscape, urban planning and avian behaviour in real situations. A key finding is that in terms of human auditory, significant informational masking exists between narrow-band (birdsong) and wide-band sounds (traffic noise) with meaning in daily life, and it is significantly influenced by the contextual factors. The results of the study can be used in optimising soundscapes including traffic noise environments.
Journal of the Acoustical Society of America, Volume 140 (2), August 2016, 978 987 Page In agreement with the distances from a road, when birdsong loudness increases (i.e., from 37.5 to 52.5 dBA), the masking effects become more significant in terms of Naturalness, Annoyance and Pleasantness. It is surprising that when the birdsong is 52.5dBA, the Perceived Loudness of the quiet traffic noise environment is slightly lower than that when the birdsong is 37.5dBA, although they are not significantly different statistically. This phenomenon may be explained by examining the responses of an interview session after the experiment: when people heard birdsong, they described the sound environment with words as “natural” and “pleasant” rather than “loud”, suggesting that naturalness and pleasantness may distract people’s attention from loudness. Louder birdsong was evaluated to have higher naturalness and pleasantness50, which may result in less attention on loudness. Irrespective of masker loudness, Annoyance due to the traffic noise environment increases and Pleasantness decreases sharply when the traffic noise is louder than 47.5 dBA. Annoyance increases with an increase in the sound pressure level of birdsong when the traffic noise is loud (higher than 57.5 dBA). Therefore this data suggests that adding natural masking sounds alone without attenuating traffic noise level is ineffective in improving soundscape quality.
The occurrence frequency of birdsong, similarly to birdsong loudness, influences the masking effects in terms of all soundscape characteristics except for Perceived Loudness. In relatively quiet traffic noise environments (47.5 dBA), when the occurrence frequency increases from 2 to 6 times, Naturalness increases steadily from 4.7 to 6.4, Annoyance decreases slightly from 2.3 to 1.3, and Pleasantness increases significantly from 2.7 to 6.7. The occurrence frequency of birdsong has a greater effect on Pleasantness than Naturalness and Annoyance. When the traffic noise is noisy (62.5 dBA), the occurrence frequency of birdsong has little influence on the masking effects. Visibility of sound sources influences the masking effects of birdsong, but this influence is not as great as that of the three other factors. It appears that the assessments of Pleasantness (at 9, 19 and 50 m) are more strongly affected by the visibility of sound sources, which may be attributed to the increased spatial awareness51 gained by adding visual information. The visibility of sound sources hardly affects masking in terms of Perceived Loudness, Naturalness and Annoyance.
The relationships among the four soundscape characteristics were also examined by statistical analysis. For the soundscape dominated by road traffic noise investigated in this study, Annoyance was determined to have a significant positive relationship with Perceived Loudness and a negative relationship with Naturalness, whereas Pleasantness was observed to have a significant negative relationship with Perceived Loudness and a positive relationship with Naturalness. As stated by De Coensel et al14, one possible explanation is that lower amount of attention paid to the traffic noise caused by adding natural sounds leads to a reduction of perceived loudness and significant improvement of soundscape pleasantness.
Journal of the Acoustical Society of America, Volume 140 (2), August 2016, 978 987 Page In accordance with the previous study , monaural recordings of birdsong were employed in the study, because the four factors that are the only variables in each comparable group should be examined in the controlled contexts. When compared with monaural recordings, binaural recordings include more uncontrolled spatial information (e.g. directions of high frequency sound-birdsong). Single recordings that were played back in the experiment had acceptable realism, which can be validated in the interview after the experiment50. To do further study on the examination of influence of spatial information on the masking effects, binaural recording will be considered. Birdsong is effective at masking quiet traffic noise, so further studies will also investigate what sounds can more effectively mask loud traffic noise.
ACKNOWLEDGEMENTS
This project is supported by the Northern Netherlands Provinces and funded by the European Union, European Fund for Regional Development and the Dutch Ministry of Economic Affairs, Peaks in the Delta.
REFERENCES
1
J. Y. Jeon, P. J. Lee, J. You, and J. Kang, “Perceptual assessment of quality of urban soundscapes with combined noise sources and water sounds,” Journal of the Acoustical Society of America127(3), 1357-66 (2010).
2
J. D. Krijnders, M. E. Niessen, and T. C. Andringa, “Sound event recognition through expectancy-based evaluation of signal-driven hypotheses,” Pattern Recognition Letters 2010 31(12), 1552-1559 (2010).
3
C. Guastavino, “Categorization of environmental sounds Canadian,” Journal of Experimental Psychology61 (1), 54-63(2007).
4
J. Kang, Urban Sound Environment (Taylor Francis, London, 2007), pp. 43-106.
5
B. Schulte-Fortkamp and K. Voigt, “Why soundscape? The new approach to ‘measure’ quality of life,” Journal of the Acoustical Society of America131(4), 3437 (2012).
6
A. L. Brown and A. Muhar, “An approach to the acoustic design of outdoor space,” Journal of Environmental Planning and Management47(6), 827–842 (2004).
7
D. Dubois, C. Guastavino, and M. Raimbault, “A Cognitive approach to urban soundscapes: Using verbal data to access everyday life auditory categories,” Acta Acustica united with Acustica, 92(6), 865-874 (2006).
8
C. Guastavino, “The ideal urban soundscape: Investigating the sound quality of French cities,”
Acta Acustica united with Acustica92, 945-951(2006).
9
Journal of the Acoustical Society of America, Volume 140 (2), August 2016, 978 987 Page V. Best, E. Ozmeral, F. J. Gallun, K. Sen, and B.G. Shinn-Cunningham, “Spatial unmasking of birdsong in human listeners: Energetic and informational factors,” Journal of the Acoustical Society of America118(6), 3766–3773 (2005).
11
W. Halfwerk and H. Slabbekoorn, “A behavioural mechanism explaining noise-dependent frequency use in urban birdsong,” Animal Behaviour78(6), 1301–1307 (2009).
12
G. C. Cardoso and J. W. Atwell, “On the relation between loudness and the increased song frequency of urban birds,” Animal Behaviour82(4), 831-836 (2011).
13
M. Rådsten-Ekman, Ö. Axelsson, and M. E. Nilsson, “Effects of sounds from water on perception of acoustic environments dominated by road-traffic noise,” Acta Acustica united with Acustica99(2), 218-225(8) (2013).
14
B. De Coensel, S. Vanwetswinkel, and D. Botteldooren, “Effects of natural sounds on the perception of road traffic noise,” Journal of the Acoustical Society of America129(4), pp.EL148-EL153 (2011).
15
Ö. Axelsson, M. E. Nilsson, B. Hellström, and P. Lundén, “A field experiment on the impact of sounds from a jet-and-basin fountain on soundscape quality in an urban park,” Landscape and Urban Planning123, 49–60 (2014).
16
R. Pheasant, K. Horoshenkov, G. Watts, and B. Barrett, “The acoustic and visual factors influencing the construction of tranquil space in urban and rural environments tranquil spaces-quiet places?,” Journal of the Acoustical Society of America123 (3), 1446–1457 (2008).
17
J. Y. Hong and J. Y. Jeon, “Designing sound and visual components for enhancement of urban soundscapes,” Journal of the Acoustical Society of America, 134 (3), 2026-2036 (2013).
18
L. Maffei, M. Masullo, F. Aletta, and M. Di Gabriele, “The influence of visual characteristics of barriers on railway noise perception,” Science of the Total Environment 445-446, 41-47 (2013).
19
J. Liu, J. Kang, T. Luo, and H. Behm, “Landscape effects on soundscape experience in city parks,” Science of the Total Environment454-455, 474-481 (2013).
20
W. P. Tanner, “What is masking,” Journal of the Acoustical Society of America 30, 919–921 (1958).
21
B. C. J. Moore, “Mechanisms of masking,” Journal of the Acoustical Society of America 57, 391-399 (1975).
22
B. C. J. Moore, Hearing (Academic Press, New York, 1995) pp, 161-177.
23
E. Zwicher, and H. Fastl, Psychoacoustics- Facts and Models (2nd edition) (Springer, New York, 1999), pp.61-110.
24
B. U. Seeber, “Masking and critical bands,” D. Havelock, S. Kuwano, M. Vorländer, ed.
Journal of the Acoustical Society of America, Volume 140 (2), August 2016, 978 987 Page N. I. Durlach, “Auditory masking: Need for improved conceptual structure,” Journal of the Acoustical Society of America120, 1787-1790 (2006).
26
G. Kidd, Jr., C. R. Mason, V. M. Richards, F. J. Gallun, and N. I. Durlach, “Informational masking,” W.A. Yost, R. F. Richard, A. N. Popper, ed, Auditory Perception of Sound Sources, (Springer, New York, 2008), pp. 143-189.
27
N. I. Durlach, C. R. Mason, G. Kidd, Jr., T. L. Arbogast, H. S. Colburn, and B. G. Shinn-Cunningham, “Note on informational masking (L),” Journal of the Acoustical Society of America
113, 2984–2987 (2003).
28
C. S. Watson, “Some Comments on informational masking,” Acta Acustica united with Acustica91, 502–512 (2005).
29
D. S. Brungart, B. D. Simpson, M. A. Ericson, and K. R. Scott, “Informational and energetic masking effects in the perception of multiple simultaneous talkers,” Journal of the Acoustical Society of America110, 2527–2538 (2001).
30
T. L. Arbogast, C. R.Mason, and Jr., G. Kidd, “The effect of spatial separation on informational and energetic masking of speech,” Journal of the Acoustical Society of America 112 (5 Pt 1), 2086–2098 (2002).
31
W. A. Yost, “Perceiving sound sources,” W. A. Yost, A. N. Popper, and R. R. Fay, ed.,
Auditory Perception of Sound Source (Springer, New York, 2008), pp. 1-12.
32
M. E. Nilsson, J. Alvarsson, and M. Rådsten-Ekman, “Loudness of fountain and road traffic sounds in a city park,” in Proceedings of the 17th International Congress on Sound and Vibration, Krakow, Poland (2009), pp. 1-7.
33
K. Bolin, M. E. Nilsson, S. Khan, “The potential of natural sounds to mask wind turbine noise,”
Acta Acustica united with Acustica96(1), 131-137 (2010).
34
D. Raydan and K. Steemers, “Environmental urban design,” M. Santamouris ed.,
Environmental Design of Urban Buildings: An Integrated Approach (Earthscan, London, 2006), pp. 1-35.
35
J. M. McNamara, R. H. Mace, A. I. Houston, “Optimal daily routines of singing and foraging in a bird singing to attract a mate,” Behavioral Ecology and Sociobiology20(6), 399-405 (1987).
36
B. Ambuel and S. A. Temple, “Area-dependent changes in the bird communities and vegetation of Southern Wisconsin forests,” Ecology64(5), 1057-1068 (1983).
37
G. S. Mills, J. B. Dunning, Jr. and J. M. Bates, “The Relationship between Breeding Bird Density and Vegetation,” The Wilson Bulletin103(3), 468-479 (1991).
38
W. Yang and J. Kang, “Soundscapes and sound preferences in urban squares,” Journal of Urban Design10(1), 69–88 (2005).
39
Journal of the Acoustical Society of America, Volume 140 (2), August 2016, 978 987 Page T. Matsui, S. Furukawa, T. Takashima, I. Uchiyama and K. Hiramtasu, “Time-component matrix chart as a tool for designing sonic environment having a diversity of sound sources,” in
Proceedings of Euronoise, Edinburgh, UK (2009), pp. 1-4.
41
K. Hiramatsu, S. Furukawa, T. Matsui and I. Uchiyama, “A physical expression of soundscape by means of Time Component Matrix Chart,” in Proceedings of Inter-noise2008, Shanghai, China, (2008).
42
P. Clergeau, J. P. L. Savard, G. Mennechez and G. Falardeau, “Bird abundance and diversity along an urban–rural gradient: A comparative study between two cities on different continents,”
Condor100, 413–425 (1998).
43
P. Clergeau, S. Croci, J. Jokimäki, M. L. Kaisanlahti-Jokimäki and M. Dinetti, “Avifauna homogenisation by urbanisation: Analysis at different European latitudes,” Biological Conservation127(3), 336-344 (2006).
44
J. Y. Jeon, P. J. Lee, and J. Y. Hong, “Non-auditory factors affecting urban soundscape evaluation,” Journal of the Acoustical Society of America130(6), 3761–3770 (2011).
45
K. Jambrošić, M. Horvat, and H. Domitrović, “Assessment of urban soundscapes with the focus on an architectural installation with musical features,” Journal of the Acoustical Society of America 134, 869 (2013).
46
G. Di, Q. Lin, and J. Kang, “Annoyance and activity disturbance from high-speed railway and conventional railway noise,” Environmental Health 13(12), 1–10 (2014).
47
D. Botteldooren, L. Dekoninck and D. Gillis, “The influence of traffic noise on appreciation of the living quality of a neighbourhood,” Int. J. Environ.Res. Public Health8, 777-798 (2011).
48
R. S. Ulrich, R. F. Simons, B. D. Losito, E. Fiorito, M. A. Miles, and M. Zelson, “Stress recovery during exposure to natural and urban environments,” Journal of Environmental Psychology11( 3), 201–230 (1991).
49
S. Kaplan, “The restorative benefits of nature: toward an integrative framework,”
Environmental Psychology15, 169-182 (1995).
50
J. Liu and J. Kang, “Soundscape design in city parks: Exploring relationships between soundscape composition parameters and physical and psychoacoustic parameters,” J. Envrion. Eng. Landscape Manag. 23, 110–120 (2015).
51
Y. Hao, Effects of Urban Morphology on Urban Sound Environment from the Perspective of Masking Effects (PhD thesis, University of Sheffield, 2014), pp. 218-223.
52