n
eurostat
Theme 2
Economy and finance
Series Β
Short-term trends
ISSN 1011-0844
ECU-EMS information
1
D
1990
Monthly
ITALIAN LIRA:
CHANGED
FLUCTUATION MARGINS NARROWED, CENTRAL RATES
Value
in
DM of
LIT 1000 (Milano, 1 December
1989 to 11 January 1990)
1.39
previous central rate: DM 1.36754
new upper limit: DM 1.36700 (against 1.47350 previously)
•"Χ
\ y
/
"\.
s™-·*"' new centralrate: DM 1.33651
On the evening of Friday, 5 January, the
Monetary Committee of the European Community
announced changes in the EMS fluctuation margins
and central rates for the Italian lira.
The fluctuation margins were narrowed from 6
to 2.25% (the normal margin), while the central rates
were decreased by just under 4% (e.g. DM 1.33651
for Lit 1 000 instead of 1.38758); the lira floor rate
against the German mark remains unchanged at
1.30650 for 1000 lira.
This move was not, therefore, a devaluation in
the real sense, which would have caused domestic
prices to rise (already some 6.4% up over the 12
months to December 1989).
At the same time, the Italian authorities
announced new, more restrictive targets for inflation
(to 4.5% in 1990), and also signalled their intention to
reduce the budget deficit, on the strength of which lira
exchange rates rose slightly on the market (by 0.5%
against the German mark from 5 to 11 January).
The new grid of central and intervention rates for the currencies taking part in the exchange mechanism is
given on page 3.
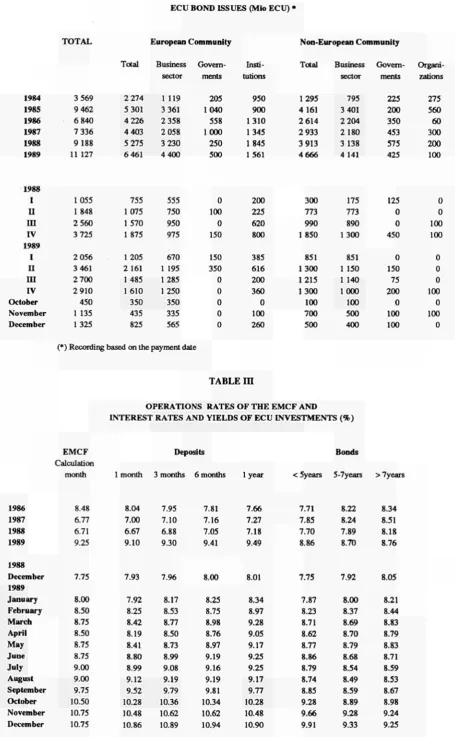
With this issue of our bulletin we are introducing a new statistical series (see Table 3) - the interest rate for
transactions in EMCF (European Monetary Cooperation Fund) ecus. This rate is the weighted average of the most
representative rates on the domestic money market of the countries whose currencies make up the ecu basket. It is
based on the weighting of the currencies in the ecu basket as derived from the ecu central rates in force. The rate
thus calculated for a given month applies to EMCF transactions for the following month.
1.38 1.37
1.36+
1.35
1.34·· 1.33·· 1J2 ■■
1.31 ■ ; lower limit unchanged: DM 1.30650
1.3 1—1—l—IT-f—ï—ι—ι—ι—ι—ι—ι—τ—t—ι—r-TT-π—ι-1-1—I
1 5 7 12 14 18 20 22 28 2 4 8 10
Ξί£
eurostat
OFICINA ESTADÍSTICA DE LAS COMUNIDADES EUROPEAS DE EUROPÆISKE FÆLLESSKABERS STATISTISKE KONTOR STATISTISCHES AMT DER EUROPÄISCHEN GEMEINSCHAFTEN ΣΤΑΤΙΣΤΙΚΗ ΥΠΗΡΕΣΙΑ ΤΩΝ ΕΥΡΩΠΑΪΚΩΝ ΚΟΙΝΟΤΗΤΩΝ STATISTICAL OFFICE OF THE EUROPEAN COMMUNITIES OFFICE STATISTIQUE DES COMMUNAUTÉS EUROPÉENNES ISTITUTO STATISTICO DELLE COMUNITÀ EUROPEE
BUREAU VOOR DE STATISTIEK DER EUROPESE GEMEENSCHAPPEN SERVIÇO DE ESTATÍSTICA DAS COMUNIDADES EUROPEIAS
L-2920 Luxembourg - Tél. 43011 - Télex : Comeur Lu 3423
B-1049 Bruxelles, bâtiment Berlaymont, rue de la Loi 200 (bureau de liaison) — Tél. 2351111
Note
For any
TEL:
FAX:
information on
4301-4785
4301-3288
4301-4770
4301-4150
the statistics in this bulleti
T. MATHISSE
G. THOUVENIN
S. ANSION
n contact Lu xembourg:
Contents
I. A graph of the bilateral fluctuations of the EMS currencies.
II. Yearly and monthly issues of ecu bonds.
III. Interest rates on ecu deposits and yields on ecu bonds.
IV. Latest month's ecu bond issues.
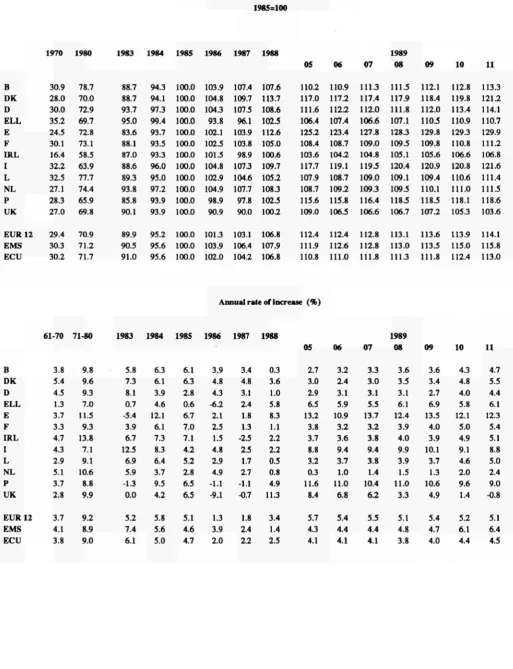
V. Consumer price indices in national currencies.
VI. Consumer price indices in ecus.
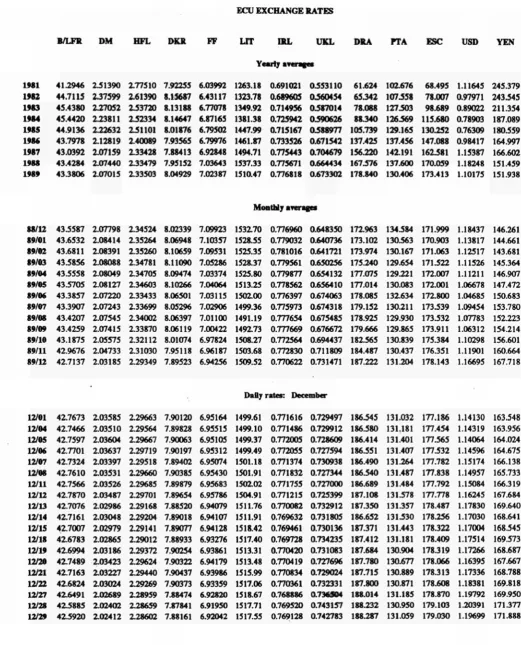
VII. Yearly, monthly and daily ecu exchange rates.
© ECSC-EEC-EAEC, Brussels · Luxembourg, 1990
Reproduction is authorized, except for commercial purposes, provided the source is acknowledged.
TABLE
I
BILATERAL FLUCTUATIONS OF THE
EMS
CURRENCIES
-n—ι—ι ι ι — ι — n — I I I I — ι ι ι ι ι ι—ι ι ι—ι ι ι—ι ι ι—ι ι ι ι ι ι ι
ΟΙ 03 07 08 13 10 17 21 23 27 2 0 01 05 0 7 11 13 15 10 21 27 20 ι ι ι
November
December
CENTRAL RATES AND INTERVENTION LIMIT RATES, IN FORCE SINCE 8 JANUARY 1990, FOR
THE CURRENCIES OF COUNTRIES PARTICIPATING IN THE EMS EXCHANGE MECHANISM.
100 BLF
100 DKR
100 DM
100 FF
100 HFL
1 IRL
1000 LIT
100 PTA
Î E C U +
= ... _ + = ... . + = _ + =... _ +
s ...
-+ = ... . + M . . .
-+
= ...
-= ...
BLF
100
553.000 540.723 528.700 2109.50 2062.55 2016.55 628.970 614.977 601.295 1872.15 1830.54 1789.85 56.5115 55.2545 54.0250 28.1930 27.5661 26.9530 33.6930 31.7316 29.8850
42.1679
DKR
18.9143 18.4938 18.0831
100
390.160 381.443 373.000 116.320 113.732 111.200 346.240 338.537 331.020 10.4511 10.2186 9.99130 5.21400 5.09803 4.98500 6.23100 5.86837 5.52600
7.79845
DM
4.95900 4.84837 4.74000 26.8100 26.2162 25.6300
100
30.4950 29.8164 29.1500 90.7700 88.7526 86.7800 174000 2.67894 2.61900 1.36700 1.33651 1.30650 1.63300 1.53847 1.44900
2.04446
FF
16.6310 16.2608 15.8990 89.9250 87.9257 85.9700 343.050 335.386 327.920
100
304.440 297.661 291.040 9.18900 8.98480 8.78500 4.58450 4.48247 4.38300 5.47850 5.15981 4.85950
6.85684
HFL
5.58700 5.46286 5.34150 30.2100 29.5389 28.8825 115.2350 112.6730 110.1675 34.3600 33.5953 32.8475
100
3.08700 3.01848 2.95100 1.54000 1.50590 1.47250 1.84050 1.73345 1.63250
2.303580
IRL
1.85100 1.80981 1.76950 10.0087 9.78604 9.56830 38.1825 37.3281 36.4964 11.3830 11.1299 10.8825 33.8868 33.1293 32.3939
1
0.510246 0.498895 0.487799 0.609772 0.574281 0.540858
0.763159
LIT
3710.20 3627.64 3546.90 20062.0 19615.4 19179.0 76540.0 74821.7 73157.0 22817.0 22309.1 21813.0 67912.0 66405.3 64928.0 2050.03 2004.43 1959.84
1000
1222.30 1151.11 1084.10
1529.70
PTA
334.619 315.143 296.802 1809.40 1704.05 1604.90 6901.70 6500.00 6121.70 2057.80 1938.06 1825.30 6125.30 5768.83 5433.10 184.892 174.131 163.997 92.2400 86.6726 81.8200
100
132.889
TABLE Π
ECU BOND ISSUES (Mio ECU) '
TOTAL European Community
Total Business Govern- Insü-sector merits tutions
Non-European Community
Total Business Govern- Organi-sector merits zaliuns
1984 1985 1986 1987 1988 1989 1988 I Π
m
IV 1989 I II III IV October November December 3 569 9 462 6 840 7 336 9 188 11 127 1055 1848 2 560 3 725 2 056 3 461 2 700 2 910 450 1 135 1325 2 274 5 301 4 226 4 403 5 275 6 461 755 1075 1570 1 875 1205 2 161 1 485 1610 350 435 825 1 119 3 361 2 358 2 058 3 230 4 4 0 0555 750 950 975 670 1 195 1285 1250 350 335 565 205 1040 558 1000 250 500 0 100 0 150 150 350 0 0 0 0 0 950 900 1310 1345 1845 1561 200 225 620 800 385 616 200 360 0 100 260 1295 4 161 2 614 2 933 3 913
4 6 6 6
300 773 990 1850 851 1300 1215 1300 100 700 500 795 3 401 2 204 2 180 3 138 4 141 175 773 890 1300 851 1 150 1 140 1000 100 500 400 225 200 350 453 575 425 125 0 0 450 0 150 75 200 0 100 100 275 560 60 300 200 100 0 0 100 100 0 0 0 100 0 100 0
(*) Recording based on the payment date
TABLE ΠΙ
OPERATIONS RATES OF THE EMCF AND
INTEREST RATES AND YIELDS OF ECU INVESTMENTS (%)
1986 1987 1988 1989 EMCF Calculation month 8.48 6.77 6.71 9.25 Deposits
1 month 3 months 6 months
8.04 7.00 6.67 9.10 7.95 7.10 6.88 9.30 7.81 7.16 7.05 9.41 1 year 7.66 7.27 7.18 9.49 5years 7.71 7.85 7.70 8.86 Bonds 5-7years 8.22 8.24 7.89 8.7Ό >7yea 8.34 8.51 8.18 8.76 1988 December 1989 January February March April May June July August September October November December 7.75 8.00 8.50 8.75 8.50 8.75 8.75 9.00 9.00 9.75 10.50 10.75 10.75
7.93 7.96 8.00 8.01
7.92 8.25 8.42 8.19 8.41 8.80 8.99 9.12 9.52 10.28 10.48 10.86 8.17 8.53 8.77 8.50 8.73 8.99 9.08 9.19 9.79 10.36 10.62 10.89 8.25 8.75 8.98 8.76 8.97 9.19 9.16 9.19 9.81 10.34 10.62 10.94 8.34 8.97 9.28 9.05 9.17 9.25 9.25 9.17 9.77 10.28 10.48 10.90
7.75 7.92 8.05
[image:4.595.64.520.59.797.2]T A B L E I V
L A S T M O N T H E C U B O N D S I S S U E S
l a u e Borrower Issued Issue Coupon Term Maturity Yields Lead Listing Notice Payment (country) (Mio ECU) Price (years) % Manager
Date
01/12/89 G.E.C.C. 100 101.750 9 7/8 3 04/01/93 9.18 Banken Trust LX Swap
04/01/90 (U.S.A.) Int.
01/12/89 Cerinvest 50 101.500 11 1 22/12/90 9.35 KB Intl LX
22/12/89 (BELGIQUE) Group
05/12/89 World Bank 100 101.875 9 1 / 2 5 03/01/95 9.02 Deutsche Bank LX Swap 03/01/90 Banque Mondiale
04/12/89 Crédit local de 100 102.000 9 3/4 5 28Λ2/94 9.23 Paribas LX-PA Swap 28/12/89 FRANCE
07/12/89 Swedish Export Corp 50 102.625 9 3M 5 22/12/94 9.07 Bankers Trust LX Swap
05/01/90 (SWEDEN) Int.
05/12/89 Crédit foncier de 50 99.180 9 6 1 / 2 05/07/% 9.17 U.B.S. LX Swap
01/03/90 FRANCE P&D
05/12/89 Oesterreichische 50 101.750 9 1 / 2 5 30/11/94 9.53 MerrilLynch LX Swap 22/12/89 Kontrollbank
(AUSTRIA)
11/12/89 Council of Europe 75 101.875 9 3/4 5 10/01/95 9.27 dorgan Stanle; LX Swap
10/01/90 Conseil de l'Europe Int
20/12/89 Postipankki 50 100.875 10 1/2 1 11/01/91 9.54 Daiwa Europe LX Swap 10/01/90 (FINLAND)
21A2/89 E.LB. 60 101.500 91/4 10 20/12/99 8.90 LBJ. LX 15/01/90 B.EJ.
T A B L E V
CONSUMER PRICE INDICES IN NATIONAL CURRENCY
1985=100
1970 1980 1983 1984 1985 1986 1987 1988
05 06 07
1989
08 09 10 11
B 35.1 71.2 89.7 95.4 100.0 101.3 102.9 104.1 DK 26.7 68.3 89.9 95.5 100.0 103.6 107.8 112.7 D 50.3 82.6 95.5 97.8 100.0 99.9 100.1 101.4 ELL 10.3 39.1 70.8 83.8 100.0 123.0 143.2 1623 E 13.6 56.2 82.6 91.9 100.0 108.8 114.5 120.0
F 25.3 63.3 88.0 94.4 100.0 102.7 105.9
IRL 15.6 56.1 87.3 94.9 100.0 103.8 107.1 I 14.2 52.5 82.7 91.6 100.0 105.8 110.9 116.5 L 37.0 70.3 90.3 96.1 100.0 100.3 100.2 101.7 NL 40.0 81.8 94.8 97.8 100.0 100.2 99.8 100.6 Ρ 6.4 35.2 64.8 83.8 100.0 111.7 122.2 133.9 UK 19.6 70.7 89.8 94.3 100.0 103.4 107.7 113.0 108.7 109.4 106.9 118.2 104.3 181.0 126.3 112.3 113.1 123.2 104.7 101.6 153.0 121.6 107.1 117.9 104.4 183.9 127.0 112.5 113.1 123.7 105.0 101.5 154.0 122.0 107.5 117.9 104.3 183.6 129.0 112.8 113.1 123.9 105.3 101.7 155.5 122.1 107.8 118.6 104.2 184.1 129.3 113.0 114.8 124.2 105.5 102.0 158.3 122.4 108.4 119.0 104.3 190.7 130.7 113.2 114.8 124.8 105.8 102.5 158.6 123.3 108.5 119.7 104.7 194.6 131.2 113.7 114.8 126.0 106.4 102.6 159.4 124.2 108.4 120.2 104.9 196.3 131.5 113.9 115.7 126.5 106.6 102.6 161.0 125.3
EUR 12 23.6 65.3 87.9 94.3 100.0 103.5 106.9 110.7 EMS 29.8 66.7 88.9 94.9 100.0 102.7 105.4 108.9
116.0 116.4 116.7 116.9 117.5 118.2 118.6 111.0 112.1 111.9 111.7 112.2 112.7 116.2
Annual rate of increase (%)
Β DK D ELL E F IRL I L NL Ρ UK
EUR 12 EMS 61-70 3.0 6.0 2.7 2.1 6.1 4.1 4.8 4.0 2.6 4.2 4.5 4.1 3.7 3.3 71-80 7.4 9.8 5.1 14.5 15.4 9.7 13.7 14.1 6.7 7.4 18.7 13.8 9.9 8.4 1983 7.7 6.9 3.3 20.5 12.2 9.6 10.4 14.7 8.7 2.7 25.5 4.6 8.4 8.4 1984 6.3 6.3 2.4 18.3 11.2 7.3 8.6 10.8 6.5 3.2 29.3 5.0 7.2 6.7 1985 4.9 4.7 2.2 19.4 7.8 5.9 5.4 9.2 4.1 2.3 19.3 6.1 6.1 5.4 1986 1.3 3.6 -0.2 23.1 8.8 2.7 3.8 5.8 0.3 0.3 11.7 3.4 3.5 2.7 1987 1.6 4.0 0.2 16.1 5.3 3.1 3.1 4.8 -0.1 -0.2 9.4 4.1 3.2 2.7 1988 1.2 4.6 1.2 13.5 4.8 2.7 2.1 5.1 1.4 0.9 9.6 4.9 3.6 2.8 05 3.0 4.8 3.0 13.1 7.0 3.7 3.8 6.5 3.5 1.0 13.0 8.3 5.4 3.5 06 3.0 4.5 2.9 13.4 7.1 3.6 3.8 6.5 3.6 1.0 13.2 8.3 5.4 3.9 07 3.0 5.0 2.8 13.5 7.5 3.5 3.8 6.5 3.4 1.1 13.3 8.2 5.4 3.8 1989 08 3.2 4.9 2.8 13.6 6.7 3.4 4.5 6.3 3.4 1.1 13.7 7.3 5.1 3.7 09 3.5 4.7 2.8 14.3 6.8 3.4 4.5 6.3 3.6 1.3 12.7 7.6 5.2 3.5 10 3.6 5.1 3.1 13.8 7.1 3.6 4.5 6.5 3.9 1.3 12.3 7.3 5.3 4.5 11 3.6 4.8 3.0 14.0 7.4 3.6 4.7 6.1 3.8 1.2 11.7 7.7 5.4 4.5
Average deviation around the mean
12 0.8 0.7 3.5 3.0 4.2 4.2 3.3 3.0 2.4 2.1 2.7 2.0 1.9 1.6 2.0 1.8 2.1 1.4 2.1 1.5 2.1 1.4 2.1 1.3 2.2 1.2 2.1 1.6 2.2 1.5
Average deviation vis-à-vis the minimum
[image:6.595.52.568.119.790.2]TABLE VI
CONSUMER PRICE INDICES IN ECU
1985=100 Β DK D ELL E F K L I L NL Ρ UK EUR 12 EMS ECU 1970 30.9 28.0 30.0 35.2 24.5 30.1 16.4 32.2 32.5 27.1 28.3 27.0 29.4 30.3 30.2 1980 78.7 70.0 72.9 69.7 72.8 73.1 58.5 63.9 77.7 74.4 65.9 69.8 70.9 71.2 71.7 1983 88.7 88.7 93.7 95.0 83.6 88.1 87.0 88.6 89.3 93.8 85.8 90.1 89.9 90.5 91.0 1984 94.3 94.1 97.3 99.4 93.7 93.5 93.3 96.0 95.0 97.2 93.9 93.9 95.2 95.6 95.6 1985 100.0 100.0 100.0 100.0 100.0 100.0 100.0 100.0 100.0 100.0 100.0 100.0 100.0 100.0 100.0 1986 103.9 104.8 104.3 93.8 102.1 102.5 101.5 104.8 102.9 104.9 98.9 90.9 101.3 103.9 102.0 1987 107.4 109.7 107.5 96.1 103.9 103.8 98.9 107.3 104.6 107.7 97.8 90.0 103.1 106.4 104.2 1988 107.6 113.7 108.6 102.5 112.6 105.0 100.6 109.7 105.2 108.3 102.5 100.2 106.8 107.9 106.8 05 110.2 117.0 111.6 106.4 125.2 108.4 103.6 117.7 107.9 108.7 115.6 109.0 112.4 111.9 110.8 06 110.9 117.2 112.2 107.4 123.4 108.7 104.2 119.1 108.7 109.2 115.8 106.5 112.4 112.6 111.0 07 111.3 117.4 112.0 106.6 127.8 109.0 104.8 119.5 109.0 109.3 116.4 106.6 112.8 112.8 111.8 1989 08 111.5 117.9 111.8 107.1 128.3 109.5 105.1 120.4 109.1 109.5 118.5 106.7 113.1 113.0 111.3 09 112.1 118.4 112.0 110.5 129.8 109.8 105.6 120.9 109.4 110.1 118.5 107.2 113.6 113.5 111.8 10 112.8 119.8 113.4 110.9 129.3 110.8 106.6 120.8 110.6 111.0 118.1 105.3 113.9 115.0 112.4 11 113.3 121.2 114.1 110.7 129.9 111.2 106.8 121.6 111.4 111.5 118.6 103.6 114.1 115.8 113.0
Annual rate of increase (%)
TABLE VH
ECU EXCHANGE RATES
B/LFR DM HFL DKR FF LIT IRL UKL DRA PTA ESC USD YEN
Yearly t
1981 41.2946 231390 2.77510 7.92255 6.03992 1263.18 0.691021 0353110 61.624 102.676 68.495 1.11645 245.379 1982 44.7115 237599 2.61390 8.15687 6.43117 1323.78 0.689605 0360454 65342 107358 78.007 0.97971 243345 1983 45.4380 2.27052 233720 8.13188 6.77078 1349.92 0.714956 0387014 78.088 127303 98.689 0.89022 211.354 1984 45.4420 2.23811 232334 8.14647 6.87165 1381.38 0.725942 0390626 88340 126369 115.680 0.78903 187.089 1985 44.9136 122632 231101 8.01876 6.79502 1447.99 0.715167 0388977 105.739 129.165 130.252 0.76309 180.559 1986 43.7978 2.12819 2.40089 7.93565 6.79976 1461.87 0.733526 0.671542 137.425 137.456 147.088 0.98417 164.997 1987 43.0392 107159 133428 7.88413 6.92848 1494.71 0.775443 0.704679 156.220 141191 162381 1.15387 166.602 1988 43.4284 2.07440 2.33479 7.95152 7.03643 1537.33 0.775671 0.664434 167376 137.600 170.059 1.18248 151.459 198» 43.3806 2.07015 2.33503 8.04929 7.02387 1510.47 0.776818 0.673302 178.840 130.406 173.413 1.10175 151.938
Monthly averages
88/12 433587 2.07798 2.34524 8.02339 7.09923 1532.70 0.776960 0.648350 172.963 134384 171.999 1.18437 146.261 89/01 43.6532 2.08414 2.35264 8.06948 7.10357 1528.55 0.779032 0.640736 173.102 130363 170.903 1.13817 144.661 89/02 43.6811 2.08391 2.35260 8.10659 7.09531 1525.35 0.781016 0.641721 173.974 130.167 171.063 1.12517 143.681 89/03 433856 2.08088 2.34781 8.11090 7.05286 1528.37 0.779561 0.650256 175.240 129.654 171322 1.11526 145.364 89/04 433558 2.08049 2.34705 8.09474 7.03374 1525.80 0.779877 0.654132 177.075 129.221 172.007 1.11211 146.907 89/05 433705 2.08127 2.34603 8.10266 7.04064 1513.25 0.778562 0.656410 177.014 130.083 172.001 1.06678 147.472 89/06 43.3857 2.07220 2.33433 8.06501 7.03115 1502.00 0.776397 0.674063 178.085 132.634 172.800 1.04685 150.683 89/07 43.3907 2.07243 2.33699 8.05296 7.02906 1499.36 0.775973 0.674318 179.152 130.211 173.539 1.09454 153.780 89/08 43.4207 2.07545 2.34002 8.06397 7.01100 1491.19 0.777654 0.675485 178.925 129.930 173332 1.07783 152.223 89/09 43.4259 2.07415 2.33870 8.06119 7.00422 1492.73 0.777669 0.676672 179.666 129.865 173.911 1.06312 154.214 89/10 43.1875 2.05575 2.32112 8.01O74 6.97824 1508.27 0.772564 0.694437 182365 130.839 175.384 1.10298 156.601 89/11 42.9676 2.04733 2.31030 7.95118 6.96187 1503.68 0.772830 0.711809 184.487 130.437 176.351 1.11901 160.664 89/12 42.7137 2.03185 2.29349 7.89523 6.94256 1509.52 0.770622 0.731471 187.222 131.204 178.143 1.16695 167.718
Daily ratea: December
EXPLANATORY NOTES
Table 1: bilateral currency deviation
The various curves should be compared in pairs. To find the differential between two currencies, subtract the (positive or
negative) values along the y-axis corresponding to each currency.
The graph is drawn with the curve of the strongest currency above that of the weakest. It shows therefore the relative position
of each currency vis-à-vis the other currencies.
When two curves intersect or merge over a period of time there is no differential between the two currencies and their market
exchange rate equals their bilateral central rate.
The graph is drawn within a horizontal band corresponding to the maximum 2,25% margin of fluctuation applying at any
given moment to market exchange rates and the bilateral central rates of the EMS currencies, with the exception of the LIT
and the PTA, which have a maximum authorized fluctuation of 6%. This band is divided symmetrically by a horizontal axis
along which the points would be plotted if all currencies were at their bilateral central rate and there were therefore no
fluctuations.
The daily market exchange rates of all currencies are compared with the relevant bilateral central rates and the differentials
between the two calculated.
The maximum fluctuation between two currencies (with the exception of the LIT and the PTA) is shown within the band,
symmetrical with the horizontal axis. The fluctuations of the other currencies in relation to either of the two currencies in
question are shown within the maximum permissible fluctuation.
The curves are drawn by linking daily the points showing the relative positions of each currency.
The intervention limit rates fixed in the official grid do not always correspond exactly to + or - 2.25% (+ or - 6% for the
peseta) of the central rates, since for each currency pair (whose exchange rates are inversely proportional to one another) the
lower limit of the one corresponds to the upper limit of the other.
Ecu exchange rates.
The exchange rates for the ecu against the national currencies of the Member States of the Community, the USD and yen are
shown as annual averages, monthly averages (for the current year), and daily rates (for the latest available month).
From 21 September 1989, the ecu basket was made up as follows:
DM FF HFL BFR LFR LIT DKR DIL PTA UKL* DRA* ESC*
lecu= 0,6242+ 1,332+ 0,2198+ 3,301+ 0,13+ 151.8+ 0,1976+0,008552+6,885+0,08784+ 1,44+ 1,393
Ecu central rates frem 01/08/89:
DM FF HFL B/LFR LIT DKR IRL PTA UKL* DRA* ESC*
2,04446 6,85684 2,30358 42,1679 1529,58 7,79845 0,763159 132,889 0,728615 187,934 177,743
Weights of currencies on 21/09/89, calculated on the basis of current central rates, expressed in %.
DM
30,10
19,00
FF
9,40
HFL
B/LFR
7,90
10,15
LIT
DKR
2,45
1,10
IRL
PTA
5,30
UKL*
13,00
DRA*
0,80
ESC*
0,80
100 =
* = Does not participate in the exchange rate mechanism
The data included in ECU-SME information only take account of these new characteristics of the ecu from October 1989.
Consumer price indices in national currency
The consumer price indices in the national currency of each country measure changes in the purchasing power of one unit of
national currency spent in the country concerned.
These indices aie calculated as weighted arithmetic means (chain indices) of the national indices, the weighting for each
Member State being its relative share in the final consumption of households of the group of countries in question (EUR
12, EMS), expressed in purchasing power standards, at current prices and purchasing power parities.
At the foot of the table, the average weighted fluctuations around the mean and the minimum are given for the same
groups of countries, with the same weightings. (These are calculated as weighted averages of the absolute fluctuations in
relation to die mean and the minimum respectively). They show die degree to which price movements in the Member
States in nie Community converge.
Consumer price indices in ecus
For each country the index of consumer prices in ecus is calculated by dividing the national consumer price index by the
average movement of the national currency in relation to the ecu during the month. It measures the change in the
purchasing power of one ecu in the country concerned.
Three composite indices are calculated, covering all the Member Stales of nie Community (EUR 12), die eight Member
States participating in the European Monetary System exchange rate mechanism (EMS) and the ten Member States whose
currencies go to make up the ecu (ECU). These indices are calculated as weighted arithmetic means (chain indices) of the
consumer price indices expressed in ecus as mentioned above. Although the peseta has been participating in the exchange
rate mechanism since 19/06/89, and the peseta and the escudo have been included in the calculation of the ecu since
21/09/89, these two currencies are only taken into account in the indices contained in this bulletin for data after 30/09/89.)
These three indices are calculated as weighted arithmetic means (chain-indices). The weightings are defined as follows: for
the EUR 12 and EMS indices, the relative share of each Member State in the final consumption of households for the
group of countries in question (EUR 12 or EMS), expressed in ecus at current prices and exchange rates (annual
weighting). For the ecu index, the relative share of each Member State's currency in die calculation of the ecu (monthly
weighting).
Ecu bond issues
The issues are recorded as at the payment date. This bulletin only covers international and foreign issues in ecus, including
ecu issues offering the option of conversion into other currencies. Main source: International Financing Review
Table Π shows, under the headings:
- Business sector and Governments: national issuers, both private and public.
- Institutions: the European Investment Bank and the Commission of the European Communities (EEC, ECSC,
Euratom).
- Organizations: the specialist institutions of the United Nations, die World Bank, the Council of Europe, etc
Operations rates of the EMCF
The interest rate for transactions in EMCF (European Monetary Cooperation Fund) ecus, is the weighted average of the
most representative rates on the domestic money market of the countries whose currencies make up the ecu baskeL It is
based on the weighting of die currencies in the ecu basket as derived from the ecu central rates in force. The rate thus
calculated for a given month applies to EMCF transactions for the following month. In table 3, this rate relates to the
month upon wich the calculations are based and not to the (following) month during which it is used by the EMCF.
Interest rates and yields on ecu investments
The interest rates for 1,3 and 6 month and 1 year deposits are calculated on the basis of the Friday London market rates
(source: Financial Times, London Money Rates, ECU Linked Deposit Bid).
The bonds are classified according to three types of terms: under 5 years, from 5 to 7 years and more than 7 years. The
redemption yields of ecu bonds are calculated each Wednesday from a sample of fixed interest bonds, denominated in ecus
and listed on the Luxemburg Stock Exchange. These yields are weighted by amounts in circulation, (source: Luxembourg
Stock Exchange).
The monthly and yearly averages are the arithmetic means of these weekly interest rates and bond yields.
Venta y suscripciones · Salg og abonnement · Verkauf und Abonnement · Πωλήσεις και συνδρομές
Sales and subscriptions · Vente et abonnements · Vendita e abbonamenti
Verkoop en abonnementen · Venda e assinaturas
BELGIQUE / BELGIË IRELAND UNITED KINGDOM
Moniteur belge / Belgisch Staatsblad
42. Rue de Louvain / Leuvenseweg 42 1000 Bruxelles / 1000 Brussel Tél. 512 0 0 26
Télécopieur: 511 0 1 84
CCP / Postrekening 000-2005502-27
Sous-dépöts / Agentschappen:
Librairie européenne / Europese Boekhandel
Avenue Albert Jonnart 50 / Albert Jonnartlaan 50 1200 Bruxelles / 1200 Brussel
Tél. 734 02 8 1 Télécopieur: 735 08 6 0
J e a n D e Lannoy
Avenue du Roi 202 /Koningslaan 202 1060 Bruxelles / 1060 Brussel Tél. (02) 538 5169
Télex 6 3 2 2 0 UNBOOK B
C R E D O C
Rue de la Montagne 34 / Bergstraat 34 Bte 11 / Bus 11
1000 Bruxelles / 1000 Brussel
DANMARK
J. H. Schultz Information A / S EF-Publikationer
Ottiliavej 18 2 5 0 0 Valby Tlf: 36 4 4 22 66 Telefax: 36 44 0 1 41 Girokonto 6 0 0 08 86
BR DEUTSCHLAND
Bundesanzeiger Verlag
Breite Straße Postfach 10 80 06 5 0 0 0 Köln 1 Tel. (02 21) 20 29-0 Fernschreiber:
ANZEIGER BONN 8 882 595 Telefax: 20 29 278
GREECE
G.C. Eleftheroudakis SA International Bookstore 4 Nikis Street
105 63 Athens Tel.: 3226-323 Telex: 2 1 9 4 1 0 ELEF Telefax: 3254 889
Sub-agent for Northern Greece: M o l h o s Bookstore
The Business Bookshop 10 Tsimiski Street Thessaloniki Tel. 275 271 Telex 4 1 2 8 8 5 U M O
ESPANA ~
Boletín Oficial del Estado
Trafalgar 27 E-2B010 Madrid Tel. (91) 446 60 00
Mundi-Prensa Libros, S.A.
Castellò 37 E-28001 Madrid
Tel. (91) 431 33 99 (Libros) 4 3 1 32 22 (Suscripciones) 435 36 37 (Dirección) Telex 49370-MPLI-E
Telefax: ( 9 1 ) 2 7 5 39 98
FRANCE ~
Journal officiel Service des publications des Communautés européennes
2 6 , rue Desaix 7 5 7 2 7 Paris Cedex 15 Tél. ( 1 ) 4 0 58 75 0 0 Télécopieur: (1) 4058 7574
Government Publications Sales Office
Sun Alliance House Molesworth Street Dublin 2 Tel. 7 1 0 3 09
or by post
Government Stationery Office EEC Section
6th floor Bishop Street Dublin 8 Tel. 78 16 66
ITALIA
Abonnements seulement Subscriptions only Nur fur Abonnements
Messageries Paul Kraus
11. rue Christophe Plantin L-2339 Luxembourg Tél. 48 21 31 Télex 2515 CCP 49242-63
NEDERLAND
SDU uitgeverij
Christoffel Plantijnstraat 2 Postbus 20014 2 5 0 0 EA 's-Gravenhage Tel. (070) 78 98 8 0 (bestellingen) Telefax: ( 0 7 0 ) 4 7 6 3 5 1
PORTUGAL
H M S O Books (PC 16)
HMSO Publications Centre 51 Nine Elms Lane London S W 8 5DR Tel. (01) 873 9090 Fax: GP3 873 8463
Sub-agent:
Alan Armstrong Ltd
2 Arkwright Road Reading. Berks RG2 OSQ Tel. (0734) 75 17 71 Telex 849937 AAALTD G Fax: (0734) 755164
SUISSE
Licosa Spa
Via Benedetto Fortini, 120/10 Casella postale 552 50 125 Firenze Tel. 64 54 15 Telefax: 6 4 12 57 Telex 570466 LICOSA I CCP 343 509
Subagenti:
Libreria scientifica Lucio de Biasio - AEIOU
Via Meravigli. 16 20 123 Milano Tel. 80 76 79
Herder Editrice e Libreria
Piazza Montecitorio, 117-120 0 0 186 Roma
Tel. 67 94 6 2 8 / 6 7 95 304
Libreria giuridica
Via 12 Ottobre, 172/R 16 121 Genova Tel. 59 56 93
GRAND-DUCHÉ DE LUXEMBOURG
OSEC
Stampfenbachstraße 85 CH-8035 Zürich Tél. (01) 365 51 51 Fax: (01) 365 52 21
OSTERREICH
Manz'sche Verlagsbuchhandlung
Kohlmarkt 16 1014 Wien
Tel. (0222)531 61-0
Telex 11 25 0 0 BOX A Telefax: (0222) 531 61-81
TURKIYE
Dünya s u p e r v e b o f s e t A S Narlibahçe Sokak No. 15 Cagaloglu
Istanbul Tel. 512 0 1 90 Telex: 2 3 8 2 2 dsvo-tr.
UNITED STATES OF AMERICA
UNIPUB
4661-F Assembly Drive Lanham, M D 20706-4391 toll free (800) 274-4888 Fax ( 3 0 1 ) 4 5 9 - 0 0 5 6 Télex 7108260418
CANADA
Renouf Publishing Co., Ltd
61 Sparks Street Ottawa Ontario K I P 5R1
Tel. Toll Free 1 (800) 267 4 1 6 4 Ottawa Region (613) 238 8985-6 Telex 0 5 3 ^ 9 3 6
JAPAN
Imprensa Nacional Casa da Moeda. EP.
Rua D. Francisco Manuel de Melo, 5 1092 Lisboa Codex
Tel. 69 34 14
Distribuidora Livros Bertrand Lda. Grupo Bertrand, SARL
Rua das Terras dos Vales, 4-A Apart. 37
2 7 0 0 Amadora Codex Tel. 493 90 50 - 494 87 88 Telex 15798 BERDIS
Kinokuniya C o m p a n y Ltd
17-7 Shinjuku 3-Chome Shiniuku-ku
Tokyo 160-91 Tel. ( 0 3 ) 3 5 4 0131
Journal Department
PO Box 55 Chitóse Tokyo 156 Tel. (03) 439 0 1 2 4
AUTRES PAYS OTHER COUNTRIES ANDERE LANDER
Office d e s publications officielles des C o m m u n a u t é s européennes
2, rue Mercier L 2985 Luxembourg Tél. 49 92 8 1
Price (excl. VAT) in Luxembourg: Single copy ECU 6 · Subscription ECU 51
OFICINA DE PUBLICACIONES OFICIALES DE LAS COMUNIDADES EUROPEAS ISSN 1011 -0844 .* o » * · KONTORET FOR DE EUROPÆISKE FÆLLESSKABERS OFFICIELLE PUBLIKATIONER
. = . A M T FÜR AMTLICHE VERÖFFENTLICHUNGEN DER EUROPAISCHEN GEMEINSCHAFTEN ΥΠΗΡΕΣΙΑ ΕΠΙΣΗΜΩΝ ΕΚΔΟΣΕΩΝ ΤΩΝ ΕΥΡΩΠΑΪΚΩΝ ΚΟΙΝΟΤΗΤΩΝ
OFFICE FOR OFFICIAL PUBLICATIONS OF THE EUROPEAN COMMUNITIES OFFICE DES PUBLICATIONS OFFICIELLES DES COMMUNAUTÉS EUROPÉENNES UFFICIO DELLE PUBBLICAZIONI UFFICIALI DELLE COMUNITÀ EUROPEE BUREAU VOOR OFFICIËLE PUBLIKATIES DER EUROPESE GEMEENSCHAPPEN SERVIÇO DAS PUBLICAÇÕES OFICIAIS DAS COMUNIDADES EUROPEIAS