1
Stability Index 2018
2
Contents
Introduction ... 4
Aims of this update ... 4
Data sources and measures of instability ... 5
Analysis methods ... 17
Findings: placement instability ... 21
Findings: school instability ... 38
Findings: social worker instability ... 53
Findings: multiple instability ... 62
Summary and next steps ... 73
Appendix A: List of local authorities participating in social worker data collection ... 75
Appendix B: Full regression model results ... 76
Appendix C: Guidance sent to LAs for social worker data collection ... 90
3
Acknowledgements
4
Introduction
Instability in care has repeatedly been shown to be detrimental to outcomes for looked after children (see Munro 2006, Rubin et al 2007, Schofield and Beek 2005). The Children’s Commissioner for England launched the Stability Index in 20171 in order to shed more light on the issue, measure at the local and national level the instability2 that children in care experience, and drive improvements to stability. Last year’s Stability Index reporthighlighted that this instability was a repeated issue of concern for children in care in England and demonstrated for the 2015/16 cohort of looked after children:
Around 1 in 10 children in care experienced multiple placement moves during the year. A similar proportion experienced a mid-year school move.
Around 1 in 4 experienced multiple social worker changes during the year Around 1 in 20 experienced any form of multiple instability during the year: any
combination of multiple placement moves, a mid-year school move or multiple social worker moves.
That report provided initial and preliminary findings based on a first look at the data on the transitions experienced by children in care. However the Stability Index is a long-term project, and this report provides an annual update of our analysis in order to continue to shine a light on the important issues of placement, school and social worker instability for looked after children.
Aims of this update
As well as updating our analysis, this year we have also developed our analysis in three key ways. Firstly, in response to feedback from looked after children and young people, we have expanded our analysis to examine children’s instability over 2 years as well as a single year. This allows us to identify children experiencing repeated instability over a longer period of time. Secondly, we are also able to compare our single-year figures to last year’s results to examine how instability has changed in the past 12 months. Thirdly, we have expanded our data collection from local authorities on social worker changes to include much richer data from significantly more local authorities.
This analysis also aims to investigate how these national pictures of instability (both single year and over two years) vary by local authority (LA) and what factors might explain this variation. Specifically it asks:
Are there particular groups of children at greater risk of experiencing instability? Are there placement/school characteristics that make a child more likely to experience
instability?
Are there local authority characteristics that make children more likely to experience instability?
1 See Stability Index: Initial Findings and Technical Report.
2 Note: By instability we are referring to changes in a child’s home (placement), school or social worker. This can
5 Importantly, our wider aim is to provide a set of measures and tools for local authorities to support internal discussion and monitor levels of placement, school and social worker instability affecting their looked after children. This will allow local authorities to identify groups that are more at risk and in need of further support so that their wellbeing and welfare can be promoted.
Data sources and measures of instability
The measures of instability used in this report combine data from three sources: the Children Looked After Census and School Census collected and provided by the Department for Education, along with a bespoke dataset of social worker histories which we have collected from local authorities.
Children Looked After (CLA) Census extract
This dataset provides our core sample of all children looked after in England on 31 March 2017 and information on their placement histories back to 2012/13. This includes details on their placements – for example their legal statuses during the year and where they are placed – as well as demographic information.
As with our previous analysis and in line with national statistics, we have excluded from this sample any episodes of respite care, as well as a small number of children with similar patterns of placement moves to those in respite care. Table 1 demonstrates this sample’s profile (final sample size after cleaning = 72,670):
Table 1 - Profile of children in CLA Census extract
Variable Category
Proportion (%) Number of children Age at earliest period of
care since 2012/133
0-4
34 24,700
5-11 40 29,390
12-15 20 14,590
16+ 5 3,990
In care in both 2015/16 & 2016/174 70 50,980
Region East Midlands 7 5,400
East of England 9 6,460
London 14 9,910
North East 7 4,840
North West 18 13,230
South East 14 9,830
South West 8 5,790
West Midlands 13 9,500
Yorkshire and The Humber 11 7,720
3 Note: This refers to a child’s age at the start of their first period of care either overlapping 2012/13 or (if not in
care in 2012/13) later. This is limited by the fact we only have care histories back to the 2012/13 financial year and so will not capture periods of care that ended before 1st April 2012.
6
Age on 31/03/2017 0-4 18 12,990
5-11 30 21,880
12-15 29 20,760
16+ 23 17,040
Primary need code5 Abuse + Neglect 61 44,570
Child Disability 3 2,290
Parent disability 3 2,310
Family Stress 8 6,010
Family dysfunction 15 11,130
Child behaviour 1 1,080
Low income <1 100
Absent parenting 7 5,100
Multiple <1 90
Ethnicity Black and minority ethnic
(BME) 24 17,750
White 75 54,290
Missing 1 630
Gender Female 44 31,710
Male 56 40,960
Initial legal status6 Criminal Justice legal
status <1 270
Emergency protection
order 1 480
Full care order 45 32,850
Interim care order 18 12,970
Placement order 3 2,450
Police protection 3 1,970
Section 20 (S20 - those taken into care voluntarily without court orders)
30 21,670
Other <1 20
Initial placement type7 Fostered not with relatives 67 48,510
Fostered with relatives 12 8,930
Hospital (or other institution providing health care)
1 760
Independent Living 2 1,720
5 99% of children in our extract had only one category of need code during 2016/17. Where multiple categories
of need are present (most likely due to a child ceasing to be classed as in need and then returning) these are recorded in the multiple category.
6 Note: by initial legal status we refer to the child’s legal status at their first placement overlapping the 2016/17
financial year. For analysis looking over 2 years this will be the child’s legal status at their first placement overlapping 2015/16.
7 Note: by initial placement type we refer to the child’s placement type at their first placement overlapping the
7
Other institution 1 850
Placed for adoption 1 370
Placed with parents 5 3,920
Residential 10 7,260
Other <1 350
A key point to note is that our sample consists only of children in care at the end of the 2016/17 financial year. This is in line with published national statistics and is useful in reducing the burden of social worker data extraction for LAs. However, it has two impacts:
1. Not all children in our sample are in care for the whole of 2016/17. Around 17% only entered care in the second half of 2016/17: these children therefore have less time in care during which they can experience placement moves. To mitigate the effect of this, our findings on single year placement instability are only presented where they are robust to controlling for a proxy measure for how long children are able to experience placement moves for during the year8.
2. Similarly when looking at two year instability, 30% of those looked after on 31 March 2017 had no periods of care in 2015/16 and so a two-year measure of placement instability cannot be defined for them. As such all analysis examining placement instability over two years is restricted to subset of children who had periods of care in both 2015/16 and 2016/17 (n= 50,980)9.
School Census sample
The CLA Census extract is matched to the School Census10 in order to provide information on school enrolments and moves. Furthermore, this provides other useful information on the characteristics of these children, such as any special educational needs or disability (SEND) or any contact with a pupil referral unit (PRU).
Matching to the School Census by definition excludes looked after children who have not yet entered or who have left school. This means that many looked after children aged under 5 or over 16 are automatically excluded from analysis on this matched sample. The analysis will also miss children not currently enrolled in school or whose pupil matching reference has not yet been recorded.
As with last year, this sample only includes those in both the autumn and summer term school censuses. This is to exclude those that enter the school system mid-year rather than through moves between schools. Children in nursery classes are also excluded from this analysis due to their high propensity for school changes as with last year.
Matched sample profile
The match rate between the CLA Census extract and the School Census was 56% overall, while it was 85% amongst children aged 5-15. The overall matched sample size = 40,765.
8 This is operationalised with a categorical variable indicating whether their first period of care overlapping the
2016/17 financial year starts more than 6 months, between 3 and 6 months or less than 3 months before the 31 March 2017.
9 Note: These are therefore a specific subset of those in care on 31 March 2017 and so may not be representative
of the full looked after children population.
10 This is possible via the National Pupil Database, supplied and owned by the Department for Education
8 There are some small differences between the characteristics of children in this matched sample and the characteristics of children in our CLA Census extract (aged 5-15). In the matched sample, children on full care orders are over-represented compared to the full CLA sample, while the proportion with at least one period in care in both 2015/16 and 2016/17 is slightly lower (Table 2). Children in the matched sample are also slightly less likely to be in residential care placements. The two samples are however similar in terms of other characteristics, including children’s primary need code (an indicator of why children are felt to be in need of social service support). Table 2 - Comparison of profiles between CLA Census extract and matched School Census sample
Variable Category CLA Census
extract (aged 5-15) (%)
Matched NPD sample (aged 5-15) (%)
Age at earliest period of care
0-4 25 24
5-11 16 14
12-15 59 62
In care in both 2015/16 & 2016/17 77 79
Age on
31/03/2017
5-11 49 46
12-15 51 54
Primary need
code Abuse + Neglect 65 66
Child Disability 3 3
Parent disability 3 3
Family Stress 9 8
Family dysfunction 16 16
Child behaviour 1 1
Low income <1 <1
Absent parenting 3 2
Multiple <1 <1
Ethnicity BME 22 21
White 78 79
Missing <1 <1
Gender Female 44 46
Male 56 54
Initial legal status Criminal Justice legal status <1 <1
Emergency protection order 1 <1
Full care order 57 60
Interim care order 14 14
Placement order 4 4
Police protection 3 2
S20 22 19
9 Initial placement
type
Fostered not with relatives 72 75
Fostered with relatives 13 14
Hospital <1 <1
Independent Living <1 <1
Other institution <1 <1
Placed for adoption 1 1
Placed with parents 5 5
Residential 7 4
Other <1 <1
These differences suggest that the matched sample is slightly more likely to be in more long term and stable (based on findings below) placements than the full cohort of looked after children. This means any estimates of placement and social worker instability based on this matched sample are likely underestimate the ‘true’ amount of instability among the CLA population – although the bias should be small.
Our overall match rate between the CLA Census sample and the School Census sample is 56% – that is, we are able to match in an autumn term and summer term School Census record for 56% of the children in the CLA sample. Clearly, many of these children may not be of school age (e.g. under-5s). Table 3, below, clarifies this further by showing how the match rate varies by age of child. We find that around 6,500 children aged 5-15 and 12,500 children aged 16-18 were in our CLA Census sample but not our School Census sample. There may be a variety of reasons for this, including children: being temporarily out of school (perhaps due to a placement or school move); having left the state school system; being in a further education or sixth form college (particularly for 16-18 year olds); being a new arrival in the state school system; having never been previously enrolled in school; and having a unique pupil number that is missing or incorrect. We cannot differentiate between all of these potential explanations.
Table 3 – Numbers of children in CLA Census sample not matched to School Census, by age. Asterisks denote numbers that have been suppressed because of small cell counts.
Age at 31st March 2017
Total number in full CLA
Census sample
Number not in school matched sample % not matched Number without any matching reference recorded
% without any matching reference recorded
0 3,820 3,820 100% 3,820 100%
1 2,730 2,730 100% 2,730 100%
2 2,210 2,210 100% 2,180 99%
3 2,090 2,090 100% 1,860 89%
4 2,130 2,130 100% 1,070 50%
5 2,260 1,330 59% 190 8%
6 2,450 180 7% 90 4%
7 2,780 130 5% 40 1%
8 3,140 170 5% 30 1%
9 3,460 160 5% 30 1%
10
11 3,900 290 7% 30 1%
12 4,300 430 10% 30 1%
13 4,750 720 15% 70 1%
14 5,390 1,080 20% 150 3%
15 6,320 1,730 27% 390 6%
16 7,910 4,360 55% 1,010 13%
17 9,110 8,070 88% 2,000 22%
18 20 20 82% * *
19 * * * * *
Social worker history data collection
As with last year, we requested information from local authorities on the numbers of changes of primary social worker experienced by children looked after on 31 March 2017. Participation was voluntary and we received responses from 78 local authorities11, over three times the number that responded last year (22).
This year’s social worker data collection provides additional data not available last year: Every local authority provided details on children’s social worker history over at
least two years. This allows us to examine longer-term social worker instability amongst children in care.
All bar one local authority provided data indicating whether a child’s case had moved between social worker teams when the child’s primary social worker changed. As these changes of team are more likely to be planned changes in relation to changing needs of the child, it is useful to separate these team changes of social worker from those that result in the case being held within the same social worker team (for example a primary social worker leaving).
Local authorities were provided with guidance on how to determine when a child’s primary social worker had changed (see Appendix C). However, it is not a statutory requirement for local authorities to record social worker changes and as a result there are no national statistics guidelines for how these should be recorded in local authority management information systems. Therefore the data we collected could reflect different recording practices between local authorities and this could lead to differences in measured social worker instability.
Some care must also be taken with comparisons between the estimates of social worker instability rates in this report and those we produced previously:
Firstly, only 14 local authorities submitted data for both collections.
Secondly, in last year’s collection local authorities only submitted total counts of social worker changes for each child. After consultation with local authorities, this year we requested detail on each social worker spell for a child in order to give greater detail on their patterns of instability. While theoretically this should not affect totals submitted, some caution in comparing between these different collection approaches is sensible. As a result comparisons to last year are limited to headline findings and presented both at an overall sample level and amongst the 14 local authorities submitting in both years.
11
Data cleaning
Local authorities provided detail on all primary social worker spells for children looked after on the 31 March 2017 covering at least two years up to 31 March 2017. As with all bespoke collections, some cleaning of this data was necessary. Our data cleaning removed:
Duplicated spells (based on child and local authority and, social worker identifiers and spell start and end date)
Spells without a valid start date
Children without an open social worker spell on 31 March 2017
Spells where multiple primary social workers overlap entirely – for example where a primary worker may have been on leave for a short period of time and this has been recorded as a change in social worker. In these cases, this analysis includes the spell with the earliest start date
Children not matched with the CLA Census - children are matched on their unique CLA Census identifier or their Unique Pupil Number. Non-matching identifiers were also checked with their nearest equivalents in the CLA Census to ensure matching failures were not due to simple typos.
After this cleaning, social worker histories of two years or more were available for 97% of the children looked after on 31 March 2017 in these 78 local authorities. The final sample size after cleaning and matching was 38,905 children.
Sample profile
The children from this sample of 78 local authorities have very similar characteristics to the full looked after children population. They have similar distributions of age, initial legal status, primary need code and initial placement type (Table 4).
The key difference compared to the full CLA Census sample is that this social worker data sample involves an over-representation of children in the South East region and an under-representation of children in London. London has on average higher social worker turnover and vacancy rates than England as a whole (London’s vacancy rate = 24.1 compared to national average of 16.312). Therefore the local authorities in the sample have on average slightly lower social worker turnover and vacancy rates than the national averages (sample average turnover rate = 14.3, national average = 15.2).
To correct for this, we have weighted our social worker sample to account for this regional disparity. However, this may not completely account for differences between the local authorities that submitted data and those that did not.
The weights have been calculated via iterative proportional fitting (‘raking’)13 to population totals from our CLA Census extract. The scale of this weighting is small (largest weight = 2.54) and there are no children removed from the analysis as a result (smallest weight = 0.5). The effect of this weighting is demonstrated in Table 4.
12 Calculated from DfE ‘Children’s social work workforce statistics 2017’
https://www.gov.uk/government/statistics/childrens-social-work-workforce-2017
12 Table 4 - Comparison between CLA extract and weighted and unweighted social worker histories data
Variable Category Full
CLA extract (%)
Social worker histories sample (unweighted) (%)
Social worker histories
sample
(weighted) (%) Age at earliest
period of care
0-4 34 33 34
5-11 40 41 41
12-15 20 20 20
16+ 5 5 5
In care in both 2015/16 & 2016/17 70 71 71
Region East Midlands 7 11 7
East of England 9 5 9
London 14 10 14
North East 7 6 7
North West 18 15 18
South East 14 21 14
South West 8 5 8
West Midlands 13 17 13
Yorkshire and The Humber 11 11 11
Age on
31/03/2017
0-4 18 17 18
5-11 30 30 30
12-15 29 29 29
16+ 23 24 23
Primary need
code Abuse + Neglect 61 61 61
Child Disability 3 3 3
Parent disability 3 3 3
Family Stress 8 8 8
Family dysfunction 15 15 15
Child behaviour 1 1 1
Low income <1 <1 <1
Absent parenting 7 8 7
Multiple <1 <1 <1
Ethnicity BME 24 24 24
White 75 75 75
Missing 1 1 1
Gender Female 44 43 43
Male 56 57 57
Initial legal status
Criminal Justice legal status
<1 <1 <1
Emergency protection order
1 1 1
13
Interim care order 18 17 18
Placement order 3 3 3
Police protection 3 3 3
S20 30 31 30
Other <1 <1 <1
Initial placement type
Fostered not with relatives 67 68 67
Fostered with relatives 12 12 12
Hospital 1 1 1
Independent Living 2 2 2
Other institution 1 1 1
Placed for adoption 1 1 1
Placed with parents 5 5 5
Residential 10 10 10
Other <1 <1 <1
Other data sources
Our analysis also incorporates published statistics from other government agencies to provide detail on local authority and school characteristics. Table 5 provides details of the data sources used and the variables taken from them.
Table 5 – Variables taken from already published data sources
Variable Data source Notes
School inspection
judgements
Ofsted management information
Most recent available inspection report used up to 31 March 2017.
Where schools have recently converted most recent inspection reports for predecessor school is used Local authority children’s
services
Ofsted management information
Most recent available inspection report used
Rank of Income deprivation affecting children in local authority
Indices of multiple deprivation 2015
Local authority budget per looked after child
Local authority revenue and financing statistics 2017
Social worker turnover rates Children’s social workforce statistics 2017
Small rates are imputed – see below
Social worker vacancy rates Children’s social workforce statistics 2017
Small rates are imputed – see below
LA rate of looked after children per 10,000 children
Looked after children statistics 2017
14 Looked after children
turnover rate – number ceasing to be looked after in the year/number beginning to be looked after
Looked after children statistics 2017
Small counts imputed – see below
Number of unaccompanied asylum seekers looked after
Looked after children statistics 2017
Small counts imputed – see below
School size School level census 2017
School type School level census 2017
School postcode School level census 2017 Geocoded using the 2017 postcode CSV file
Income deprivation affecting children of school postcode
School level census 2017
Key measures of instability
For each area of instability, this analysis focuses on a single year metric of instability and a metric of instability over two years. These are all binary in nature and summarised by Table 6.
Table 6 – Key measures of instability used in this report
Area of
instability
Single year/two year
Measure What it counts What it excludes
Placement instability
Single year Child
experienced 2 or more placement moves in 2016/17
Changes in placement where a different carer assumes
responsibility for the child during the financial year Re-entries into
care during the financial year
1st entries into care during the financial year
Carers moving house Placement changes
due to change in legal status where carer stays the same Placements begun
before the 01/04/2016 Respite care
episodes Two year Child
experienced 2 or more placement moves in both
2015/16 & 2016/17
placement where a different carer assumes
responsibility for the child during the financial year Re-entries into
care during the 2 financial years
1st entries into care during the 2 financial years Carers moving house Placement changes
15 Placements begun
before the 01/04/2015 Respite care
episodes
School instability
Single year Child
experienced any mid-year school moves in the 2017
academic year
School entry dates between the 3rd week of September and the end of May 2017
Looked after children not matched with the NPD
Two year Child
experienced any sort of school move (both start of year and mid-year) in the 2016 and 2017 academic years
Unique school entry dates at any point during the 2016 and 2017 academic years
Looked after children not matched with the NPD
Children moving from primary to secondary school
Social worker instability
Single year Child
experienced 2 or more primary social worker changes in 2016/17
Changes in primary social worker during the financial year
Two year Child
experienced 2 or more primary social worker changes in both
2015/16 & 2016/17
Changes in primary social worker during the 2 financial years
Multiple instability
Single year Children experiencing any
combination
16 of the above
forms of instability Two year See below
Measuring multiple instability over two years
We have also constructed a summary measure of instability over two years. This provides an overall picture of the placement, school and social worker instability experienced by children over two years in each local authority. However, there are multiple ways this measure could be defined by a researcher and no clear justification for one over the other.
A useful solution to this is to take a data led approach, examining which forms of instability tend to co-occur over two years and grouping children together based on similar patterns of instability. This has the added benefit of highlighting the most commonly occurring patterns of instability amongst children in our sample.
Latent class analysis (Lazarsfeld & Henry 1968) is a useful way of forming these groups, particularly as it uses a model-based technique to group children together. As a result, it can be formally validated on other samples if required and used to predict group membership on new samples. This method compares results for different numbers of groups. The results of this analysis (see below) suggest that four groups are adequate to summarise the observed patterns of correlation in our combined sample:
A stable group – low rates on all forms of instability
A stable group except for Social Worker team – low rates of placement instability but notably higher rates of moves between social worker teams
1st year instability – children with high rates of placement and school instability in 2015/16 but lower rates in 2016/17
17
Analysis methods
As well as reporting overall levels of instability at national and local authority level, this analysis also aims to highlight links between child and local authority factors and higher levels of instability.
Descriptive analysis
Bivariate cross tabulations and correlations are useful in identifying single characteristics associated with a higher likelihood of instability. Where characteristics are categorical (such as primary SEND type) these associations with our binary measures of instability are tested using the Rao and Scott (1984) adjusted chi square test. This modifies the traditional chi square test to account for clustering by local authority and any weights applied. Where bases are low (less than 50), proportions are marked with asterisks. All findings reported on are significant at a 95% confidence level except where mentioned.
Associations between stability and characteristics measured by continuous variables (such as social worker turnover rates in a local authority) are tested using logistic regression without controls, incorporating weights and with standard errors adjusted to account for any clustering by local authority. Again all findings reported on are significant at a 95% confidence level except where mentioned.
Published local authority statistics that incorporate low counts (between 1 and 5) are suppressed in national statistics for disclosure control reasons. To avoid having to drop observations in these local authorities, suppressed values are instead imputed using a form of multiple imputation. This creates five copies of the dataset, randomly selecting a count between 1 and 5 for these suppressed counts in each copy. The analysis is then run on each of these five copies and the results pooled across these replications with standard errors further widened to take account of this additional element of uncertainty.
Multiple Regression analysis
However, these bivariate links do not take into account wider correlations between factors and it may be that differences between groups are explained entirely by these other correlations. For example, children with any contact with a PRU may be more likely to experience placement instability. However, it may also be that this link is explained by their higher rate of social, emotional and mental health (SEMH) SEND code.
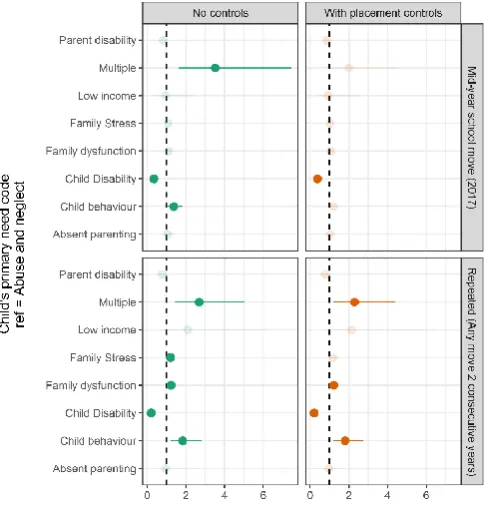
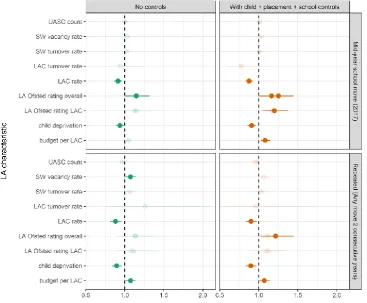
These links are therefore further tested for robustness using logistic regression incorporating other relevant factors as controls (again with standard errors adjusted for clustering by local authority and incorporating any weighting)14. This tests whether the relationship between a characteristic and the probability of a child experiencing each form instability remains statistically significant (at a 95% confidence level) once correlations with other factors are taken into account. Results from regressions are displayed using coefficient plots like Figure 1 below. The points represent the coefficient estimate (transformed to an odds ratio for easier interpretation) and the horizontal lines represent 95% confidence intervals. Statistically significant associations are left non-transparent while those that are not statistically significantly associated with the outcome of interest are greyed out.
18 Figure 1 - example results from a logistic regression
However, some care must be taken with significance testing on large samples like this, as it becomes more likely that small relationships will emerge as statistically significant even though the associated effect indicates only a small relationship with the outcome of interest in practical terms. Therefore it is important to also look at the size of the effects as well as their statistical significance.
Variable explanatory power
Measures of variable explanatory power15 also useful in mitigating this problem of small but significant relationships. These measure how well a variable discriminates between children experiencing each form of instability and those not once it is incorporated into the model. These have the added benefits of being easily comparable between continuous and categorical predictors and summarising the effect of variables with multiple categories.
There are many ways of assessing variable’s explanatory power. Logistic regression models predict a probability of children experiencing a type of instability with a more predictive model predicting probabilities closer to 1 for those actually experiencing the form of instability. One possible solution to this would be to pick a threshold for these probabilities, above which a child would be classified as having experienced the outcome. For example, all children with a predicted probability above 50% could be classified as having experienced instability. The proportion of people classified correctly – i.e. whose predicted outcome was the same as their actual outcome – would give a measure of the explanatory power of the model. However, results based on picking a discrete threshold are very sensitive to the cut-off chosen.
An approach that avoids this is to add together a model’s predicted probabilities to give a predicted estimate of the number of children experiencing the form of instability. If a model perfectly discriminated between those experiencing instability and those not, then everyone who had experienced instability would have a predicted probability of 1 and so the sum of these predicted probabilities would be equal to the total number of children experiencing that form of instability. The ratio of the two totals would be 1 in this case. As a result, higher ratios of the summed probabilities to the observed population size indicate a variable with greater explanatory power.
15 This is often termed ‘variable importance’ in machine learning applications.
Non-statistically significant association
19 Variables for which the regression coefficients are small (but still significant) will only increase predicted probabilities slightly and will therefore still score poorly in comparison to other variables with a larger effect size on the outcome of interest. This same method can also be used to show which groups of factors best discriminate between children experiencing instability and those not. For example, whether local authority or child factors are more predictive of each form of instability. Finally, when this ratio is calculated for a model including all factors, it also demonstrates how well these discriminate between those experiencing each form of instability and those not when taken together. This provides us with an idea of how much unexplained variation in levels of instability remains after all factors considered are taken into account.
Latent class analysis
The final section of this report presents the results of a latent class analysis, which groups children together based on similar patterns of instability over two years. As this incorporates repeated measures, a random effect is also included in this model (Qu et al 1996). This relaxes the assumption of conditional independence that would be clearly violated with repeated measurements over two years. The effect of adding this random effect on the parameters is small and serves to account for correlation between items due to this repeated measurement. Standard errors on the class loadings are widened to account for any clustering within local authority. Analysis is rerun on 50 random starting values to check for replication of the best likelihood solution.
As this is a data-led method, various measures of model fit are needed to compare between solutions with different numbers of groups. These models require the number of groups to be specified in advance and the number of groups is varied, with metrics of model fit used to determine which number of groups provides the best fit to the observed patterns of instability. This fit is assessed using a combination of indicators:
the Bayesian Information Criterion (BIC, Schwartz 1978),
a chi squared test of difference between predicted and observed response combinations (the G-squared statistic)
residual bivariate correlations.
20 Figure 2 - BIC values for latent class models with differing numbers of groups
This four-group result also has a non-significant G-squared statistic (p-value = 0.89) indicating no significant difference between the model-predicted counts of the various combinations of instability and the actual counts. Residuals are also low (all residual bivariate correlations between pairs of indicators below 2), which further indicates a good model fit.
Entropy provides a measure of whether there is a large overlap between groups. A value of 1 would indicate perfect separation between groups and 0 indicates no separation. Though not a measure of model fit as such, this separation does provide an indication of the certainty with which children are classified into a particular group. Entropy values for this 4-group fit are also reasonably high (entropy = 0.77) suggesting that the groups are reasonably well separated. However, as this entropy value is not very close to 1, it is useful to preserve this uncertainty in our national estimates of group size and characteristics. To this end, all descriptive analysis of correlations with categorical variables and group sizes is based on the summed probabilities of children being in each group. Similarly, correlations with continuous characteristics are assessed through multinomial regression using Vermunt’s 3-step procedure (Vermunt 2010)16 which also carries through the uncertainty of classification.
21
Findings: placement instability
What is the national picture of placement instability in 2016/17?
Key findings:
1. At a national level, there has been little change in rates of placement instability between 2015/16 and 2016/17. Around 1 in 10 children in care (7,530) experienced multiple placement moves in 2016/17.
2. This year we are able to measure the number of children experiencing multiple placement changes in two consecutive years. Of the children in care in both 2015/16 and 2016/17, around 3% (1,320 children) experienced multiple placement moves in both years.
3. Experiencing placement instability in one year puts children at heightened risk of experiencing it in the following year.
At a national level there has been very little change in the levels of placement instability compared to 2015/16 (Figure 3). The majority of children looked after (68%) experienced no placement changes in 2016/1717. However, a notable minority (10%, 7,530 children) experienced 2 or more placement changes in 2016/17. These are
similar proportions to 2015/16.
22% of looked after children with a period in care in both 2015/16 and 2016/17 had two or more placement changes over two years (Table 7). However, repeated instability over two years is notably rarer than instability within a single year. Around 1 in 50 (1.8%) of those in care at the 31 March 2017 (1,320 children) had experienced 2 or more placement moves in both 2015/16 and 2016/17. This proportion increases slightly when restricted to those that have at least one placement in each year (2.6%)18.
Table 7, below, shows the discrete distributions of the number of placement changes observed when looking over a range of time periods (one to four years). It shows that while in the short term, the majority of
children in care experience no placement changes, this reverses when looking over a longer time frame. Over three or four years, more than half of looked after children experience at least one placement move. The proportion of children experiencing exactly one placement move is similar regardless of the time frame considered.
17 Note: the figure from 2015/16 differs slightly from that reported last year. This is due to an improvement in
our method for counting placement changes.
18 Note: all subsequent analysis of repeated placement moves is based on children who have at least one period
in care in both 2015/16 and 2016/17.
22 Table 7 - Distribution of placement changes over 1-4 years for children looked after on 31 March 2017. Totals differ as children are only counted if they are in care on 31 March 2017 and at any time during the first year of the relevant period. For example, the 3 year column includes all children looked after on 31 March 2017 and with a care period during 2014/15 – this is to exclude those who have only entered care after 2014/15 and so were unable to have placement changes over 3 years.
Distribution over a single year
(2016/17)
Distribution over 2 years
(2015/16-2016/17)
Distribution over 3 years
(2014/15-2016/17)
Distribution over 4 years
(2013/14-2016/17)
Number of
placement changes
N % N % N % N %
0 49,650 68 27,360 54 17,750 45 12,320 40
1 15,490 21 12,240 24 9,300 24 7,280 24
2 4,590 6 5,660 11 5,190 13 4,320 14
3 1,610 2 2,640 5 2,830 7 2,460 8
4 700 1 1,330 3 1,590 4 1,520 5
5 310 <1 720 1 900 2 910 3
6 140 <1 410 1 540 1 570 2
7+ 180 <1 630 1 1,030 3 1,210 4
Total 72,670 100 50,980 100 39,130 100 30,570 100
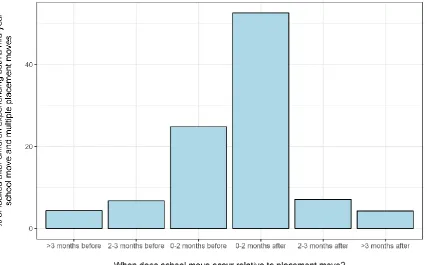
Placement changes tend to concentrate around a child’s entry into care. This is most clear amongst those entering care during the 2 year period from 2015/16 to 2016/17. Amongst care entrants with any placement changes over this period, 76% of these changes occur within 6 months of their entry into care. Even for those with 3 or more placement changes, 64% of their placement changes occur within this 6 month window.
Yet for a small proportion of children, placement instability is not just confined to these short periods of time and experiencing placement instability in one year puts children at a heightened risk of experiencing it in the next year. One quarter of those experiencing multiple placement changes in 2015/16 experienced it again in 2016/17. By comparison, only 8% of those who did not experience it in 2015/16 went on to experience multiple placement moves in 2016/17. So experiencing placement instability in one year seems to increase the likelihood of experiencing it again in the following year by a factor of three.
23 Figure 4 - odds ratios for association of multiple placement moves in 2016/17 with multiple placement moves in previous years. Results are shown for associations without any controls (dark blue) and with dummy variable controls for multiple placement moves in other years (light blue).
How does this picture vary by local authority?
Key findings:
1. There is notable variation between local authorities in rates of single-year and repeated placement instability.
2. There is no strong relationship between a local authority’s rate of placement instability in 2015/16 and its rate in 2016/17.
Looking at a local level, Figure 6 demonstrates there is wide variation between local authorities in the likelihood of a child experiencing placement instability in 2016/17. Rates of multiple placement moves in 2016/17 range from 3% to 19% across local authorities19. This is again similar to the range in placement instability rates for 2015/16.
19 Note: this range excludes one outlier that has a notably higher rate (26%) than all other local authorities as
24 Table 8 – Average placement instability rates by region
Region Number of Looked after children
with 2+ placement moves in 2016/17
% with 2+ placement moves in 2016/17
East Midlands 410 8
East of England 640 10
London 1140 12
North East 390 8
North West 1220 9
South East 1150 12
South West 690 12
West Midlands 1060 11
Yorkshire and The Humber 830 11
There is similarly wide variation in rates of repeated placement instability by local authority. Amongst children with at least one placement in 2015/16 and 2016/17, the likelihood of experiencing multiple placement changes in two consecutive years varies from less than 1% to 9% across local authorities. Table 8, above, shows that there is less variation by region, indicating that much of the variation may be within-in region.
25 However, differences between local authorities are not
consistent year on year. There is a weak relationship between current and past instability rates at the local authority level: a local authority’s ranked rate in 2015/16 explains only a quarter of its ranked rate in 2016/17. Figure 7 demonstrates visually that there is a large amount of variation still to be explained.
What factors help explain this variation?
Given this wide variation between local authorities, it is helpful to look at what factors might account for the different probabilities of a child experiencing placement instability (both over one year and repeatedly over two years). This section looks at the child, placement and local authority characteristics available in the data.
Which groups of children are more likely to experience placement instability?
Key findings:
1. The following child characteristics are associated
with the risk of experiencing single-year and repeated placement instability: a. Age (both on 31 March 2017 and at their earliest period of care) b. SEND status
c. Primary category of need
d. Having any contact time with a PRU
There are notable differences between different groups of children in their risk of placement instability. Most notably, older children (both in terms of age on 31 March 2017 and age at their earliest period of care in our extract) and those recorded
as having behavioural or social, emotional and mental health difficulties are most likely to experience placement instability.
Child’s age on 31 March 2017
Older children are more at risk of experiencing both single-year and repeated placement instability. Children aged 16 or over are twice as likely to experience multiple placement changes in a single year as those aged 5–11, and five times more likely to experience repeated placement instability (Figure 8). Children aged 0-4 are also slightly more at risk of single year placement instability compared to those aged 5-11. Figure 8 demonstrates that this is largely driven by high rates amongst those aged under 1. This is likely because there are a number of placement changes that
are often necessary in taking a child into care at such a young age (for example the hospital will Figure 6 - associations between rate of multiple
placement moves by LA in 2015/16 and 2016/17. Top plot shows LA % with multiple placement moves, bottom plot shows LA rank in each year
26 often be counted as a placement for those taken into care at birth). This is further supported by the fact that those under 4 and in care in both 2015/16 and 2016/17 are at comparatively low risk of repeated placement instability two years in a row (Figure 8).
Figure 8 - Rates of single-year and two-year placement instability by single year age band (age at 31 March 2017)
Child’s age at earliest period of care
Children aged 12-15 at their earliest period of care20 are at notably higher risk of experiencing both single-year and repeated placement instability compared to all other age groups (Figure 10). For example, they are twice as likely to experience multiple placement changes in a single year as those aged 5-11 at their earliest care entry, and three times as likely to experience repeated placement instability over two years.
The effect of age at earliest care period exacerbates the effects of calendar age. For example, those aged 12-15 are notably more at risk of both single-year and repeated placement instability if they are recent care entrants, than if they have experience with the care system dating back to when they were younger (Figure 10). Nearly 1 in 5 12-15 year olds who have recently
entered care experienced multiple placement changes in 2016/17, twice the rate for other age groups who have recently entered care.
However, it is not necessarily older recent care entrants that experience greater levels of placement instability. For example those aged 16+ at both their earliest period of care and 31 March 2017 actually have lower rates of both single-year (11%) and two-year (2%) placement instability than those aged 16+ and 12-15 at their earliest period of care (18% and 7% respectively). This difference is likely explained by the fact that over-16s who have recently entered care are more likely to have Absent Parenting as their primary need code (48% vs an
20 Note: earliest periods of care are calculated used age at the start date of the earliest period of care overlapping
the 2012/13 financial year (or later).
27 average rate of 7%), which is a need category associated with higher levels of placement stability (see below).
Figure 10 - Rates of placement instability for the cross tabulation of children's calendar age (on 31 March 2017) and age at their earliest entry into care. Percentages are the proportion experiencing placement instability. For example 9% of those aged 0-4 on 31 March 2017 and aged 0-4 at their earliest care period experienced multiple placement changes in a single year
Child’s SEND status21
Whether or not a looked after child has an identified SEND does not significantly affect their risk of experiencing placement instability. For example, 7% of those with an identified SEND code experienced multiple placement changes in 2016/17, compared to 8% of children without SEND. There are also very few differences in rates of instability between children who have a SEND statement and children who have SEND without a statement. Amongst those with any identified SEN, 9% of children with a statement experienced multiple placement moves in 2016/17 compared to 7% of those without. There are no differences between rates of repeated placement moves over two years (1% for those with and without a statement).
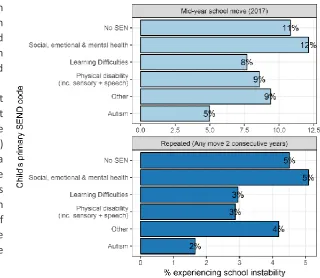
However, this broad category of SEND hides some notable differences between those with different types of SEND (Figure 11). For example, those recorded as having social, emotional and mental health (SEMH) difficulties as their primary SEND code are 40% more likely to experience single-year placement instability compared to those with no identified SEND.
21 Note: this analysis is based on the sample matched with the School Census. SEND status is their primary SEND
28 Figure 11 - rates of placement instability by child's primary SEND category. Note: this information is only available for the
school matched sample and so average rates of instability are slightly lower than reported above
These dfferences are also exacerbated by age at earliest care period. One in five of those entering care at age 12-15 with the SEMH SEN code experienced multiple placement changes in 2016/17, compared to an average of 1 in 10 for all children with a SEMH SEND code (Figure 12).
Figure 12 - single year placement instability for the cross tabulation of primary SEND code and a child's age at earliest period of care. * = base less than 50
Child’s primary category of need code
29 Despite these limitations there are differences in
both single-year and repeated instability rates across children with different categories of need. In cases where children’s behaviour is recorded as their primary need, these children are twice as likely to experience single-year placement instability, and four times as likely to experience repeated placement instability, compared to children with the most common need code (abuse and neglect); see Figure 14.
Children for whom disability is recorded as their primary need code are the least at risk of both single-year and repeated instability.
The most at risk are children with multiple primary need codes (i.e. children whose need code is not the same throughout the financial year). As a child can only have one code during a period of care, this is likely picking up children who leave care but then return with a different primary need code. As a result it is unsurprising that these children have the highest rates of
placement instability over both a single year and two years. Children with any contact with a PRU
Children with any contact time with a PRU are also notably more likely to experience both single-year (24%) and repeated (8%) placement instability compared to those did not have contact time with a PRU (7% and 1% respectively). 22 This could reflect the primary need code finding above that children with behavioural needs are more at risk of placement instability, especially as children with any contact in a PRU are six times more likely to have behaviour primary need code compared to children not in a PRU. That said, we acknowledge children can have contact with a PRU for a variety of other reasons as well.
Gender and ethnicity
There are also no meaningful differences between genders or ethnicities in terms of placement stability (Figure 14).
22 Note: This analysis is based on the school matched sample.
30 Figure 14 - Rates of single year and two year placement instability by gender and ethnicity
Are there characteristics of a child’s initial placement that make them more likely to experience placement instability?
Key findings:
1. A child’s initial legal status has a strong bearing on the levels of placement instability they experience
31 Child’s initial legal status23
There are large differences in rates of placement instability between children starting their periods of care on different initial legal statuses (Figure 15). Children initially looked after as part of their involvement in criminal justice proceedings (either under investigation or on remand), and those looked after under Section 20 of the Children’s Act (those taken into care voluntarily without court orders) are the most likely to experience both single year and repeated placement instability. These high levels of single-year instability are perhaps unsurprising
given that placements under Section 20 or as part of criminal justice proceedings are often intended as short term. However, the fact that children on these legal statuses are also more likely to experience repeated placement instability in both 2015/16 and 2016/17 suggests that for some of these children the effect is not only confined to a short period of time.
23 Initial legal status refers to the looked after child’s legal status at first placement during 2016/17 in the analysis
of single-year placement instability, or at first placement during 2015/16 in the analysis of repeated instability. Figure 15 - Rates of single year and two year placement instability by child's initial legal status
Section 20 and unplanned placement changes
Placement instability among children in Section 20 placements seems to largely be driven by movements between placements rather than those returning home. Rates of home returns are low: 6% of S20 placements in 2016/17 ended in a return home. Most commonly, placements that ended resulted in a move to another placement (91% of placements).
32 Child’s initial placement type24
There are large differences in placement instability rates between children on different initial placement types, however, for the most part these are explained by the characteristics of the children in those placements.
Those initially placed in a hospital or other institution, residential and independent living are at increased risk of single-year instability (Figure 16). While there are smaller differences for repeated instability, children in residential and other institutions (prison and other health institutions) are still at higher risk of this.
There are also differences between children in different forms of residential care. For example children initially placed in secure children’s homes have notably higher rates of both single-year and repeated placement instability (51% and
31% respectively) than children placed in non-secure children’s homes (18% and 7%). However, many of these
differences are explained by the characteristics of the children in different placement types. Figure 17 demonstrates that
most of these
differences disappear and lose statistical significance (or reverse entirely) once we control for children’s other characteristics. This suggests that it is
the children’s
characteristics account for these differences in instability, rather than the placement type per
24 Initial placement type refers to the looked after child’s placement type at first placement during 2016/17 or
2015/16 in the case of repeated instability.
Figure 16 - Rates of single-year and two-year placement instability by child's initial placement type
33 se. The exception is that children fostered with relatives are 35% less likely to experience single-year placement instability than children fostered with non-relatives, even once child characteristics are taken into account. However, there is no difference over two years, suggesting that this difference may be confined to the short term.
Children placed in or out of LA
There are no meaningful differences in levels of placement instability between those placed inside or outside of their home local authority at their first placement in 2016/17 (or in 2015/16, for repeated instability) (Figure 18).
Figure 18 - Rates of single year and two-year placement instability by whether child is placed in or out of LA
What influence do local authority characteristics have on placement instability?
Key findings:
1. We did not find statistically significant links between local authority level factors and overall rates of placement instability
2. However, budget per looked after child might affect instability for some groups of children looked after. Some children with more complex needs, as indicated by their SEND code, face a slightly higher risk of placement instability in local authorities where the budget per looked after child is lower
This analysis also examines whether there are any links between local authority factors and rates of placement instability. We tested the following factors:
LA budget per looked after child
LA’s rank of deprivation affecting children
LA’s count of unaccompanied asylum seeking looked after children LA’s social worker turnover and vacancy rates
LA’s rate of looked after children (per 10,000 children overall)
LA’s turnover of looked after children (ratio of those ceasing to be looked after to those entering care)
LA’s most recent children’s services Ofsted rating and Ofsted Looked After Children inspection rating
34 Figure 19 - Odds ratios for associations between local authority factors and placement instability (with and without controls for child and placement characteristics). Note: coefficients represent change associated with a one standard deviation increase in local authority factor
35 Figure 20 - Interaction effect between local authority budget per LAC and SEMH SEND25
It should be stressed that this effect is small. A child with SEMH SEND in a local authority with the average level of budget per LAC is 45% more likely to experience single year placement instability than a child with no identified SEND. A child with SEMH SEND in a local authority where budget per LAC is 10% lower budget per LAC would be 50% more likely to experience single year placement instability. So according to our figures a 10% reduction in budget per LAC would have a minor exacerbating effect on instability among children with SEMH SEND. Effectively, we find evidence that reduced budget per LAC widens the gap in instability rates between children with the most complex needs and those without.26
How well do these factors explain variation by local authority in placement
instability rates?
Key messages:
1. Child characteristics and initial legal status are the factors which most predictive of the risk of experiencing placement instability
2. Even when all factors are taken into account, there remains a large amount of unexplained variation both within and between local authorities.
25 Note: This analysis is based on the school matched sample, hence why the levels of instability shown in Figure
21 are not as high as might be expected if looking at the overall CLA sample.
26 Note: no link was found with high needs funding a t a local authority level, though this simply reflects the
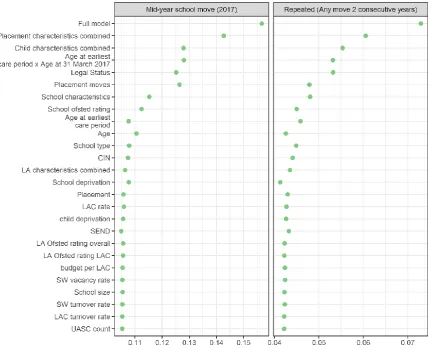
36 Figure 21 demonstrates that child characteristics and placement characteristics are the most predictive factors of both single year and repeated placement instability27. Local authority factors are the least predictive confirming the above findings.
Importantly, the overall ratios of predicted to actual population size are low, even when all variables are incorporated into a full model. This suggests that there remains a large amount of unexplained variation.
Figure 21 – Ratios of predicted population size to actual population size (variable importance) for each variable tested, selected combinations of variables and all variables together. Higher values (points further to the right) indicate more
predictive variables/groups of variables
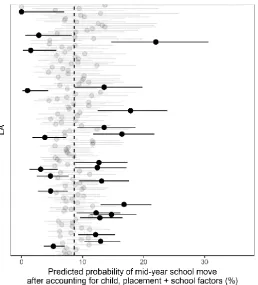
Controlling for a local authority’s case mix – the placement and child characteristics among its LAC – cannot explain all of the variation between local authorities in rates of instability. Figure 22 demonstrates that there remains variation in levels of placement instability even once this is taken into account. Around 1 in 10 (11%) local authorities have a statistically significantly lower rate of multiple placement moves than average once their case mix accounted for; a similar proportion of local authorities (9%) have statistically significant higher rates than average.
27 Note: all models are fitted on the matched NPD sample for comparability. This is to include variables relating
37 Figure 22 - Predicted probability of multiple placement moves in each LA after child and placement characteristics are controlled for. Horizontal bars are binomial 95% confidence intervals. Dashed line is intercept for null model (note this is
38
Findings: school instability
What is the national picture of school instability?
Key messages:
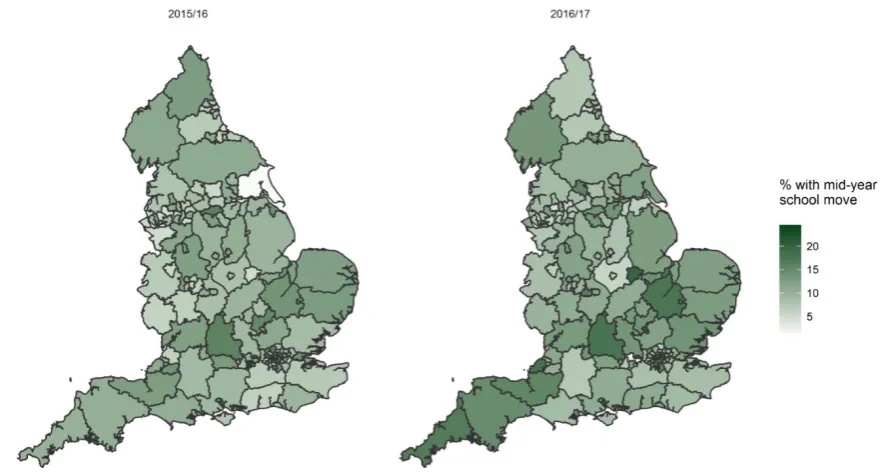
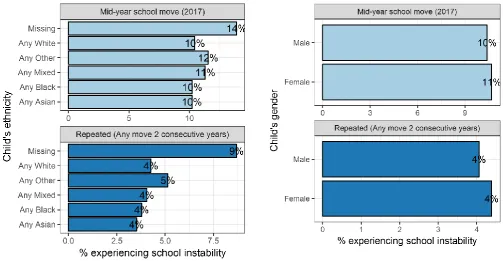
1. 1 in 10 looked after children attending school (4,300 children) experienced a mid-year school move in the 2016/17 academic year. This is the same rate as in 2015/16. 2. 1 in 25 of those in school in both 2015/16 and 2016/17 (1,600 children) experienced
any sort of school moves in 2 consecutive years
We find that 10.5% of those looked after on 31March 2017 experienced a mid-year school move in the 2016/17 academic year, similar to the previous year’s level of 10%2829. This suggests the majority of children experience school stability within a year and that school instability is concentrated among a significant minority of children. Nevertheless, that minority amounts to 4,300 children and is over twice the rate of mid-year school moves amongst the full school population (4%).
There are also indications as to quite how disruptive a mid-year school move can be. On average looked after children move 24 miles between schools at their first mid-year school move – this is higher than the average distance for all children experiencing a mid-year school move (16 miles)30. By contrast, children move on average 8 miles for a school move taking place at the start of the year.
These differences are likely exacerbated by available school provision for those with complex needs. For example, looked after children with autism identified as their primary SEND code move on average 38 miles at a mid-year school move (note that this is based on small sample of less than 50 children). Those with physical disability recorded as their primary SEND code also move on average 30 miles.
The average distance involved in a mid-year school move is slightly higher for primary age pupils than for secondary age pupils (26 miles and 22 miles respectively). This suggests that it is not simply the smaller number of secondary schools that is creating this difference.
Furthermore 2% (400 children) of looked after children experiencing any sort of school move were out of school for an entire term or more31. While a small percentage, this represents a significant disruption for 1 in 50 children experiencing a school move.
Mid-year school moves in two consecutive years are comparatively rare. Only 1.5% of children experienced a mid-year school move in both the 2015/16 and 2016/17 academic years. Around 1 in 5 (19%) experienced a mid-year school move in either 2015/16 or 2016/17. However, as with placement instability, a mid-year school move is more likely if the child experienced it in the
28 Multiple mid-year school moves in a single year are rare and experienced by less than 1% of looked after
children.
29 Note: all analysis in this section is based on the school matched sample.
39 previous year. Among those who experienced a mid-year school move in 2015/16, 15% also experienced one in 2016/17, compared to 10% among the children who did not experience a mid-year school move in 2015/16. So experiencing a mid-mid-year school move in one mid-year appears to increase the risk of experiencing it again in the following year by 50%.
Around 1 in 25 (4%) of children looked after on 31 March 2017 (and in school during 2015/16 and 2016/17) experienced any type of school move in both 2015/16 and 2016/1732. This amounts to approximately 1,600 children, which suggests that while consecutive mid-year school moves are quite rare, there is still a group of looked after children which experiences repeated school instability.
How does this picture vary by local authority?
Key messages:
[image:39.595.85.527.327.563.2]As with placement instability, there is large variation between local authorities in rates of school instability. These rates vary year on year and it is not necessarily the same local authorities who have higher or lower rates of school instability.
Table 9 – Average school instability rates by region
Region Number of Looked after children with a
mid-year school move in 2016/17
% with a mid-year school move in 2016/17
East Midlands 330 11%
East of England 490 14%
London 520 11%
North East 260 9%
North West 640 8%
South East 590 11%
South West 400 12%
32 Note this excludes those moving from primary to secondary school