1
Equally Flexible and Optimal Response Bias in Older Compared to Younger Adults:
Supplemental Materials
Accepted for publication in Psychology and Aging, 8 February 2019
© 2019, American Psychological Association. This paper is not the copy of record and may not exactly replicate the final, authoritative version of the article. Please do not copy or cite without authors’ permission. The final article will be available, upon publication, via its DOI: 10.1037/pag0000339
Supplementary to the analysis of the original experimental data described in the main report, the following materials are offered as background information and ancillary analyses. Some further methodological details are also reported here. In the sections listed below, table numbers, figures and references refer to these supplemental materials unless otherwise indicated.
Table of contents
1. Method ... 2
2. Data screening ... 3
3. Linear Mixed Effects Modelling of Response Times and Error Rates ... 4
4. LBA Parameter Estimation ... 10
5. LBA Model Comparison... 11
6. LBA Parameter Tests ... 14
7. LBA Optimality Analysis ... 17
8. Diffusion Decision Model ... 20
2
1. Method
In addition to the methodological details about our experiment in the main report, we provide the following details concerning location, dates, equipment and randomisation procedures.
The experiment was administered in the Tasmanian Cognition Laboratory of the University of Tasmania across April 2017 to February 2018 during standard working hours under normal ambient illumination. It was run on desktop computers equipped with 3.30 GHz Intel i5-6600 processors, 16 GB RAM, and a Windows 7 Enterprise operating
system configured to minimise internal task-switching. It was written in JavaScript and run locally using a Firefox (v. 46.0.1) browser. A single experimenter (AR or RG, both Ph.D. candidates) ran one or two participants per session (40% of the younger participants, in addition to 12 software-development pilot runs, by AR; otherwise by RG). These
experimenters were also responsible for recruiting participants. The interval between the two sessions ranged from 1 to 14 days (mean = 5, SD = 3).
For the random assignment of trials to the conditions of target colour, discrimination difficulty and cue-congruence, sequences encoding these conditions (to the specifications given in the main report) were pseudo-randomly generated (by AR) using the R
3
2. Data screening
The experiment produced 38,400 trials over all conditions, with 19,200 trials for each age-group, with equal separations at the levels of bias-type and discrimination difficulty, and with separations per cue-target congruence and target colour according to the level of bias-type. The trial-level data are available on the Open Science Framework
(https://osf.io/9hwu2/).
Prior to analysis, data were screened for “too fast” responses, and response timeouts. Inspection of per-participant RT distributions indicated that a minimum RT cut-off of 0.2s was sufficient to exclude implausibly fast responses among both older and younger
participants (7 and 24 trials, respectively). The rarity of these fast responses indicated that fast guessing was generally absent from performance. Older participants produced more response timeouts than younger participants (66 and 22 trials, respectively); a preliminary indication of greater caution with age in the data (as in, e.g., Silverman, 1963). Also, there were about twice as many response timeouts under trial-wise (58) than block-wise (30) biasing; a preliminary indication—consistent with our procedural intentions—that
4
3. Linear Mixed Effects Modelling of Response Times and Error Rates
For analysis of effects of the factors in the study design on the standard measures of performance—response time (RT and error rate (ER)—mixed-effects models (per the lme4 R package, v. 1.1-19, Bates, Mächler, Bolker, & Walker, 2015) were used to account for by-subject random intercepts and any potential by-by-subject random effects of the factors (Baayen, Davidson, & Bates, 2008; Baayen & Milin, 2010). The RTs were log-transformed and
analysed assuming a Gaussian distribution, and ERs were analysed assuming a binomial distribution with a probit link function. Log-transformed RTs better satisfied the assumptions of regression modelling (as per examination of residuals) than inverse-Gaussian transformed RTs, and the raw RTs themselves.
Analysis commenced with a model that allowed for all possible interactive and main effects of the fixed factors, and by-subject random intercepts (see Table 1, “Full model”). Simpler fixed effects structures, and more complex random effects structures, were explored through forward and backward fits of multiple alternative factor partitions, with model comparison and selection based on likelihood ratio tests (aiming for reductions in
complexity-penalising goodness-of-fit measures, viz., AIC and BIC) and ANOVA-equivalent tests (with Kenward-Roger df estimation per the lmerTest R package, v. 3.0-1, Kuznetsova, Brockhoff, & Christensen, 2017). This procedure was not as extensively possible for models of error rates as they suffered multiple convergence issues (see Eager & Roy, 2017).
5 These random effects are consistent with indications of individual differences in
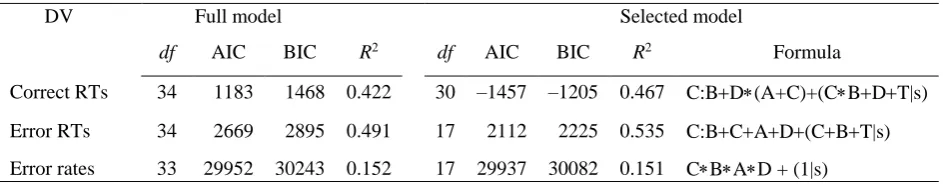
6 Table 1. Full and Selected Model Structures and Fit Measures.
DV Full model Selected model
df AIC BIC R2 df AIC BIC R2 Formula
Correct RTs 34 1183 1468 0.422 30 –1457 –1205 0.467 C:B+D(A+C)+(CB+D+T|s)
Error RTs 34 2669 2895 0.491 17 2112 2225 0.535 C:B+C+A+D+(C+B+T|s)
Error rates 33 29952 30243 0.152 17 29937 30082 0.151 CBAD + (1|s)
Note. R2 = RLR2 for RTs and RGLLM2 for error rates (per the MuMIn R package, v. 1.42.1; Bartoń, 2018). Formulas are in the standard computational format with first-letter
7 The following details the between-group and then within-group effects that, following model comparison, were confirmed to be substantial and significant (with = .05). We report unstandardized effect sizes as the differences between the relevant parameter estimates while averaging over parameters not included in the comparison. Standardized effect sizes are not reported given that there are no standard procedures for their estimation from mixed models (e.g., Singmann & Kellen, in press). Descriptives reported in the following text are marginal means (and 95% t-distribution confidence intervals), as estimated from the mixed effects models and back-transformed from log/probit scales.
Age-related slowing and accuracy. Responses were much slower for older than younger participants—both when correct [0.778s (0.730s, 0.829s) and 0.577s (0.541s, 0.615s), respectively] and incorrect [0.853s (0.780s, 0.931s) and 0.553s (0.506s, 0.604s), respectively]. As these descriptives indicate, errors were slower than correct responses among older participants, whereas younger participants tended to make faster error responses than correct responses. Error rates were also slightly lower for older [13.4% (11.4%, 15.7%)] than younger participants [16.3% (14.0%, 18.8%)]. Across both age-groups, there were slower correct and error responses, and more errors, for hard than for easy discriminations. Between age groups, the difficulty cost on correct RTs tended to be larger for older (0.055s) than younger participants (0.026s). Similarly, the cost on accuracy by discrimination difficulty was slightly larger for older (13.8%) than younger participants (12.9%), pairwise
8 Biasing effects. Correct responses were faster, error responses were slower, and
accuracy was greater for the more likely (cue-congruent) than less likely (cue-incongruent) target colours. Although there was no statistically significant main effect of bias-type on any measure, the block-wise biasing effect was, as predicted, larger on all measures than the trial-wise biasing effect—correct responses were faster (on congruent compared to incongruent trials) by 0.06s and 0.04s under block-wise and trial-wise biasing, respectively; error
responses were slower by 0.1s and 0.045s, respectively; and error rates were reduced by 12% and 6%, respectively. These differences in the biasing effect between bias-types were
produced by differences on cue-congruent trials when responses were correct, and by differences on cue-incongruent trial when responses were incorrect. Specifically, for correct RTs, responses on cue-congruent trials were 0.023s faster under block-wise than trial-wise biasing, but cue-incongruent responses differed by only 0.001s between bias-types. For error RTs, conversely, responses on cue-incongruent trials were almost 0.050s faster under block-wise than trial-block-wise biasing, whereas responses on cue-congruent trials were 0.011s slower for block-wise than for trial-wise bias. In relation to discrimination difficulty, the effect of cue-congruence on correct RTs was slightly greater (by 0.012s) on hard relative to easy trials across bias-types.
9 responses; and, among their fastest 10% of responses, older and younger participants showed substantially equivalent biasing effects. However, the biasing effect remained strong
throughout the RT distribution for older participants (e.g., 0.066s and 0.048s for the lowest and highest 10% of correct RTs, respectively, on easy block-biased trials; see Figure 1 in the main report, top left panel) but not for younger participants (0.069s and 0.009s, respectively; see Figure 2 in the main report, top left panel). For ERs, the biasing effect was significantly greater among older than younger participants, subserved by a slightly larger effect among older than younger participants under block-wise biasing (12.6% and 11.8%, respectively), with little age difference under trial-wise biasing (6.5% and 6.3%, respectively).
The data were also examined for block-wise trends and sequential effects. For brevity, only the following key findings are presented here. As for block-wise trends, RTs declined over blocks much more among older than younger participants, especially under block-wise biasing; younger participants showed no difference in trends between bias-types. Accuracy was stable under all conditions across the sessions. For correct RTs, biasing effects occurred within the earliest blocks under both bias-types, and the block-wise effect remained stable while the trial-wise effect declined. Analysis of first-order sequential effects involved a subset of the data where, on lag –1 trials, there were no timeouts, and responses were correct without being “fast guesses” (RT 0.2s). First-order facilitation by target repetition was observed for correct RTs, which was greater when biasing was block-wise (0.042s for older participants, and 0.031s for younger participants) than trial-wise (0.025s for older
10
4. LBA Parameter Estimation
LBA parameter values were estimated by a hierarchical Bayesian procedure using a Markov Chain Monte Carlo sampler to generate posterior parameter distributions, as
implemented in the Dynamic Models of Choice R library (https://osf.io/pbwx8/; Heathcote et al., 2018). Priors were assumed to be normal and diffuse (means of 2 and standard deviations of 3 for all of A, B and v, 1 and 3 for sv, and 0.2s and 0.25s for t0) with priors for A, B and sv having a lower bound of 0, and t0 having a lower bound of 0.1s and an upper bound of 1s. Posterior distributions were estimated in multiple chains (3 the number of model
parameters), initially by separate estimation for each participant. These fits provided startpoints for separate hierarchical models for the older and younger groups that produced the final estimates. The hierarchical models assumed independent normal population
11
5. LBA Model Comparison
Model comparison was informed by the deviance information criterion (DIC; Spiegelhalter, Best, Carlin, & van der Linde, 2014), a complexity-penalizing likelihood statistic for which smaller positive values, and larger negative values, by at least about 10 units indicate, by convention, better complexity-independent fits (cf. Heathcote et al., 2018). The bias-on-threshold-only model was very strongly preferred relative to the bias-on-rate-only model, by 290 and 655 units for older and younger participant datasets, respectively. The bias-on-rate-only model, although showing appropriate signs of biasing effects, failed to predict bias effects in the fastest RTs, mainly by under-estimating correct RTs for
incongruent trials. DIC supported the modelling of bias effects on both thresholds and rates over the bias-on-threshold-only model by a smaller margin, 40 and 95 units for older and younger datasets, respectively. However, this model produced implausible v estimates: they were higher for cue-incongruent than cue-congruent trials under all conditions, suggesting over-fitting. Hence, for further analyses we selected models in which bias only affected thresholds.
13 Table 2. Fit Measures per Alternative LBA Model Specifications.
LBA Parameters Group
Older Younger
N A B v sv t0 Min. Deviance DIC Min. Deviance DIC
19 1 B-C-R B-D-M M 1 3376.0 4059.0 –11042.8 –10359.2 20 1 B-C-R B-D-M M B 3345.9 4034.8 –11052.0 –10354.8 39 1 B-R B-D-C-T-M M 1 3126.5 4349.4 –10893.0 –9703.7 43 1 B-C-R B-D-C-T-M M 1 2697.8 4019.3 –11720.8 –10454.0 44 1 B-C-R B-D-C-T-M M B 2662.8 3989.3 –11723.6 –10472.7 20 B B-C-R B-D-M M 1 3325.2 4008.3 –11049.3 –10381.3 21 B B-C-R B-D-M M B 3304.8 3995.3 –11065.3 –10383.8
Note. N = number of free parameters; all models included a constant value of for one level of sv.false. See text for definition of parameter and measure abbreviations in the column
headings. For the conditions abbreviated under each parameter: B = bias-type; C = cue colour; T = target colour; D = discrimination difficulty; R = response (accumulator); M = match (of accumulator and response); 1 = intercept-only estimate. The model defined in the bottom row is the model that was selected for parameter estimates and contrasts, and optimality analysis.
Table 3. Goodness-of-fit of Observed and LBA-Predicted RTs and ERs for the Bias-on-Threshold-Only Model.
[image:13.595.105.492.535.608.2]14
6. LBA Parameter Tests
To capture the correlations between performance within each participant, all test results and intervals were obtained by firstly calculating the relevant condition difference for each participant then averaging these over participants for each iteration in each chain. Results for the threshold parameter B are presented in the main report.
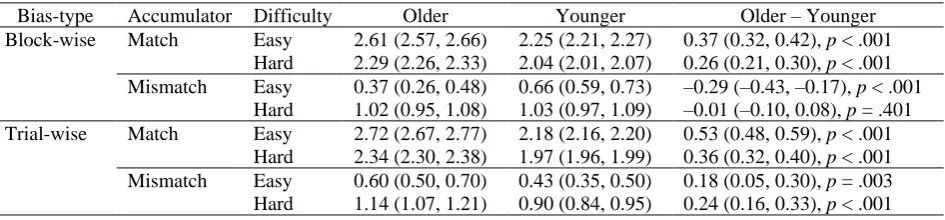
Accumulation rates. Table 4 presents estimates of mean rates (v) per age-group and block-wise and trial-wise bias. Under block-wise biasing, older participants had larger matching rates than the younger participants for both difficulty levels, but younger
participants had larger mismatching rates than older participants for easy trials, and there was no substantial difference between the age-groups for mismatching rates on hard trials. Under trial-wise biasing, older participants had larger matching and mismatching rates than the younger adults for both hard and easy trials. The difference between matching and
mismatching rates (an index of the quality of stimulus evaluation) was larger for older than younger participants for both easy and hard trials, and whether biasing was block-wise [d = 0.66 (0.54, 0.79), p < .001 for easy trials, and d = 0.27 (0.19, 0.35), p < .001 for hard trials] or trial-wise [d = 0.36 (0.24, 0.48), p < .001 for easy trials, d = 0.12 (0.04, 0.20), p = .002 for hard trials]. As expected, the difference between matching and mismatching rates was greater for the easy than hard trials in all cases (all ps < .001). Furthermore, the difficulty
15 Table 4. LBA Mean Accumulation Rate (v) Posterior Parameter Estimates: Medians of the mean over participants (and 95% credible intervals).
Bias-type Accumulator Difficulty Older Younger Older – Younger Block-wise Match Easy 2.61 (2.57, 2.66) 2.25 (2.21, 2.27) 0.37 (0.32, 0.42), p < .001
Hard 2.29 (2.26, 2.33) 2.04 (2.01, 2.07) 0.26 (0.21, 0.30), p < .001 Mismatch Easy 0.37 (0.26, 0.48) 0.66 (0.59, 0.73) –0.29 (–0.43, –0.17), p < .001
Hard 1.02 (0.95, 1.08) 1.03 (0.97, 1.09) –0.01 (–0.10, 0.08), p = .401 Trial-wise Match Easy 2.72 (2.67, 2.77) 2.18 (2.16, 2.20) 0.53 (0.48, 0.59), p < .001
Hard 2.34 (2.30, 2.38) 1.97 (1.96, 1.99) 0.36 (0.32, 0.40), p < .001 Mismatch Easy 0.60 (0.50, 0.70) 0.43 (0.35, 0.50) 0.18 (0.05, 0.30), p = .003 Hard 1.14 (1.07, 1.21) 0.90 (0.84, 0.95) 0.24 (0.16, 0.33), p < .001
The standard deviation of the rate parameter for the matching accumulator, svMatch, was larger for older [0.700 (0.685, 0.716)] than younger [0.516 (0.506, 0.527)] participants [d = 0.183 (0.165, 0.202), p < .001]. As the probability of making an error is a function of rate variability as well as the difference between matching and matching means rates, it is useful to calculate a quantity analogous to the signal-detection theory sensitivity measure:
𝑑′= (𝑣𝑀𝑎𝑡𝑐ℎ− 𝑣𝑀𝑖𝑠𝑚𝑎𝑡𝑐ℎ) √𝑠𝑣𝑀𝑎𝑡𝑐ℎ2 + 𝑠𝑣
𝑀𝑖𝑠𝑚𝑎𝑡𝑐ℎ2
⁄ (1)
Under block-wise biasing, sensitivity was better for the older participants both easy [0.43 (0.33, 0.54), p < .001] and hard [0.15 (0.08, 0.22), p < .001] trials. Under trial-wise biasing, sensitivity was better for older than younger participants on easy [0.17 (0.07, 0.28), p < .001] but not hard [0.02 (−0.5, 0.09), p = .256] trials. Sensitivity was always better for easy than hard trials (all ps < .001), and the sensitivity advantage for easy trials was larger for older than younger participants [block-wise: 0.29 (0.16, 0.41), p < .001; trial-wise: 0.15 (0.03, 0.27), p = .006].
16 younger participants, startpoint noise was larger under block-wise than trial-wise biasing [d = 0.085 (0.046, 0.126), p < .001].
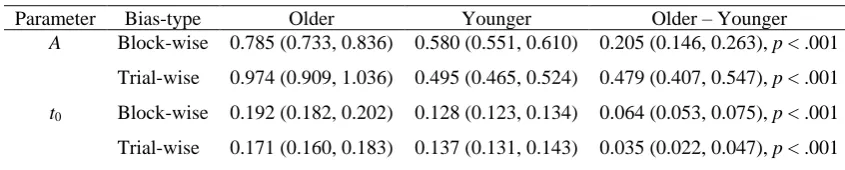
[image:16.595.84.507.397.482.2]Non-decision time (t0). As also shown in Table 5, LBA-estimated non-decision time was longer for older than younger participants within each bias-type. For the differences between bias-types per age-group, older participants’ non-decision time was longer under block-wise than trial-wise biasing [d = 0.021 (0.006, 0.035), p = .002] whereas younger participants’ non-decision time was slightly longer under trial-wise than block-wise biasing [d = 0.009 (0.001, 0.017), p = .011].
Table 5. LBA Startpoint Variability (A) and Non-decision Time (t0) Posterior Parameter Estimates: Medians of means over participants (and 95% credible intervals).
Parameter Bias-type Older Younger Older – Younger A Block-wise 0.785 (0.733, 0.836) 0.580 (0.551, 0.610) 0.205 (0.146, 0.263), p < .001
Trial-wise 0.974 (0.909, 1.036) 0.495 (0.465, 0.524) 0.479 (0.407, 0.547), p < .001
t0 Block-wise 0.192 (0.182, 0.202) 0.128 (0.123, 0.134) 0.064 (0.053, 0.075), p < .001
17
7. LBA Optimality Analysis
We used simulation methods to determine the level of bias, defined in the
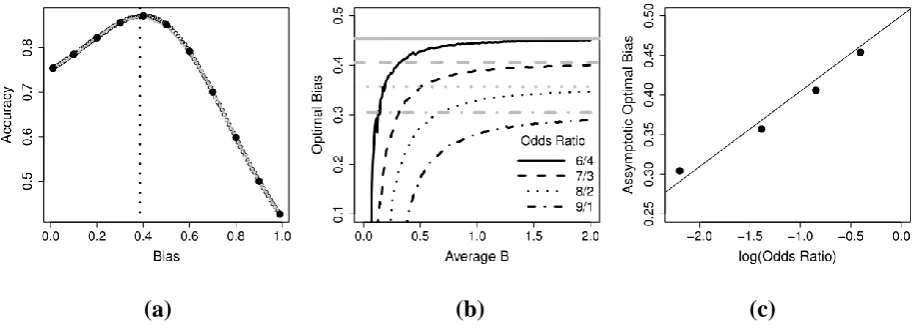
proportional sense of Equation 1, which maximized accuracy conditional on the estimated non-threshold parameters and maintaining caution (i.e., average B) at the observed level. To illustrate, the relationship between bias and accuracy conditional on the average parameter estimates over all participants and conditions (see Table 6, final row) is shown in Figure 1a (simulation methods are described in the Figure caption). Figure 1b plots of estimated optimal bias as a function of the average B value for four base-rate odds ratios. It shows that optimality requires more extreme biases at lower levels of caution (i.e., average B). Figure 1c shows that their asymptotic values are an approximately linear function of the logarithm of the odds ratios, similar to the exact linear relationship derived by Bogacz, Brown, Moehlis, Holmes, and Cohen (2006) for the “simple” DDM (i.e., without trial-to-trial parameter variability that is usually assumed in order to capture benchmark phenomena).
[image:17.595.72.532.461.626.2](a) (b) (c)
18 11 simulated values (based on 200,000 simulated trials each) indicated by solid points (with corresponding bias 0.01, 0.1, 0.2, … 0.9, 0.99). The optimum bias estimate is given by the peak of the fitting function (indicated by a dotted vertical line at a value of 0.389), which was determined from the root of its derivative of the polynomial corresponding to the highest point on the interval between the 11 values. Panel (b) plots estimated optimal bias as a function of the average B value for different stimulus one vs. two odds ratios (dark lines) and horizontal lines showing estimated asymptotic bias (based on 2,000,000 simulated trials). Panel (c) plots asymptotic bias for the four curves in (b) as a function of the logarithm of the odds ratio for each.
Table 6. LBA Mean Parameter Estimates for per Age Group and Bias-type.
Age-Group Bias-type A BCC BCI vE-M vH-M vE-MM vH-MM svMM t0
Older Block-wise 0.79 0.96 1.22 2.61 2.29 0.37 1.02 0.70 0.19 Trial-wise 0.97 1.09 1.24 2.72 2.34 0.60 1.14 0.70 0.17 Younger Block-wise 0.58 0.62 0.79 2.24 2.04 0.66 1.03 0.52 0.13 Trial-wise 0.49 0.67 0.75 2.18 1.97 0.43 0.89 0.52 0.14 Average 0.71 0.84 1.00 2.44 2.16 0.51 1.02 0.61 0.16
Note. svMM was fixed at 1. Subscripts for parameters are: CC = congruent, CI = cue-incongruent, E = easy stimulus, H = hard stimulus, M = matching accumulator, MM = mismatching accumulator.
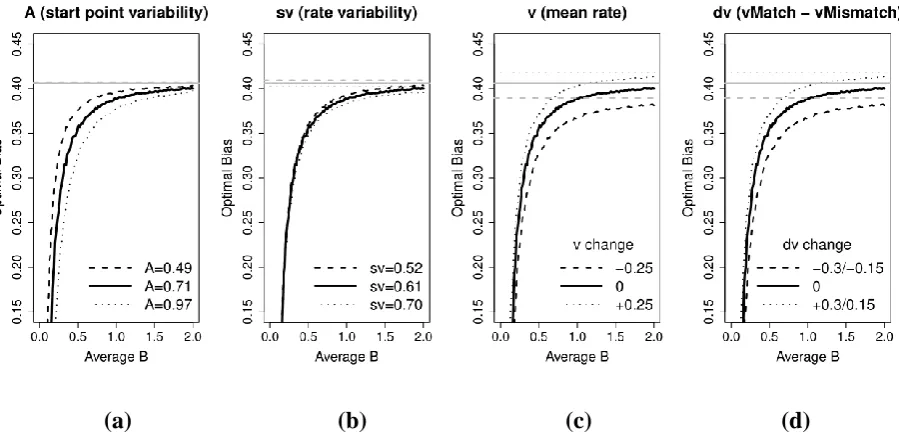
19 targeted parameter over the range of all values shown in Table 6. Figure 2a shows that
asymptotic optimal bias is virtually unaffected by A. However, the rate of increase toward asymptote depends strongly on A, slowing as startpoint noise increases. As A increases there is a lower bound on the average B below which the optimal bias is no longer greater than zero, hence the curves in Figure 2a shift to the right as well as approach their asymptote more slowly as A increases. Figure 2b shows that the other trial-by-trial variability parameter, sv, has a similar but much smaller effect on the rate of approach to asymptote and a larger, although still relatively small, effect on the asymptote. Figures 2c and 2d show that both the average rate for the two accumulators and the difference between matching and mismatching accumulators have a large effect on the asymptote and the rate with which it is approached.
[image:19.595.77.527.353.577.2](a) (b) (c) (d)
Figure 2. Optimal bias functions for the young trial vector in Table 6 (solid line) with varying values of (a) startpoint noise (A: values shown in legend), (b) mean rate (v) for both
20
8. Diffusion Decision Model
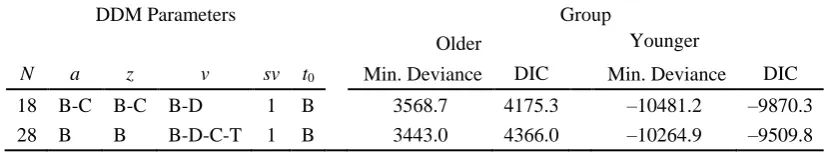
[image:20.595.90.504.405.481.2]We fit two DDMs, corresponding to the best LBA model where bias only affected threshold parameters (top row, Table 7) and one where bias only affected the mean rate of accumulation (bottom row, Table 7). In the former model allowing the cue colour factor to affect both the DDM a and z parameters corresponds to allowing different thresholds for each accumulator as a function of cue colour in the LBA. In the latter model allowing cue-colour to affect the DDM v parameter corresponds to allowing the same effect on the LBA v parameter. As in the final model selected for the LBA analysis, these models also estimated effects of bias-type on startpoint noise and non-decision time.
Table 7. Fit Measures per Alternative DDM Specifications.
DDM Parameters Group
Older Younger
N a z v sv t0 Min. Deviance DIC Min. Deviance DIC
18 B-C B-C B-D 1 B 3568.7 4175.3 –10481.2 –9870.3 28 B B B-D-C-T 1 B 3443.0 4366.0 –10264.9 –9509.8
Note. N = number of free parameters. See text for definition of parameter and measure abbreviations in the column headings. For the conditions abbreviated under each parameter: B = bias-type; C = cue colour; T = target colour; D = discrimination difficulty; 1 = intercept-only estimate. The model defined in the top row of values is the model that was selected for parameter estimates and contrasts, and optimality analysis.
21 the bias-on-threshold-only models between the LBA and the DDM, it can be seen (with respect to the complexity-penalizing attributes of the DIC) that the LBA provided a better account of the data of both older and younger participants (with reductions by 180 and 514 DIC units, respectively).
We continue with parameter tests and optimality analyses of the best DDM
parameterization; see the main report for description of the comparison tests, and above for description of the optimality analysis.
[image:21.595.132.464.585.636.2]Caution (a). As can be seen from the data presented in Table 8, DDM-estimated caution was larger among older than younger participants under both bias-types. This replicates the common result in the literature, and the present result for LBA-estimated caution. Comparing estimates between bias-types per age-group, caution was slightly lower under block-wise than trial-wise bias among older participants, with no such difference among younger participants, [d = –0.06 (–0.09, –0.03), p .001, for older participants, and d = 0.01 (–0.01, 0.03), p = .279, for younger participants], which also fully replicates the finding for LBA average thresholds.
Table 8. DDM Caution (a) Posterior Parameter Estimates: Medians of means over cue colour and participants (and 95% credible intervals).
Bias-type Older Younger Older – Younger
Block-wise 1.33 (1.31, 1.35) 0.99 (0.97, 1.00) 0.34 (0.32, 0.37), p < .001
Trial-wise 1.39 (1.36, 1.41) 0.98 (0.96, 1.00) 0.41 (0.38, 0.43), p < .001
Response bias (za). Table 9 presents descriptives for startpoint (z) relative to
22 boundary. As these descriptives indicate, and as comparison tests confirm, these deviations were substantial under block-wise biasing for both older [d = 0.100 (0.093, 0.108), p .001] and younger [d = 0.095 (0.087, 0.103), p .001] participants, and under trial-wise biasing, again for both older [d = 0.045 (0.038, 0.053), p .001] and younger [d = 0.049 (0.042, 0.057), p .001] participants. This demonstrates the expected reduction of startpoint towards the response boundary that was congruent with the colour cued as most likely to be the target. Age-related differences in the effect of cue-congruence are presented in the right-most
column of Table 9, from which it can be seen that the block-wise biasing effect was slightly larger among older than younger participants. This replicates the same but more substantial age-difference seen by the LBA-estimated effect of cue-congruence. Conversely, the trial-wise biasing effect tended to be larger among younger than older participants (opposite to what was seen with the LBA-estimated effect), but this difference was small and unreliable. Between bias-types per age, the shift in startpoint from 0.5 was larger under block-wise than trial-wise biasing for both older [d = 0.055 (0.044, 0.066), p .001] and younger [d = 0.046 (0.035, 0.056), p .001] participants, with this bias-type difference in the congruence effect being larger among the older relative to the younger participants but—as with the LBA estimates—not to a substantial or reliable extent [d = 0.010 (–0.005, 0.025), p = .099]. Table 9. DDM Relative Startpoint (za) Posterior Parameter Estimates: Medians of means over participants (and 95% credible intervals).
Bias-type Older Younger Older – Younger Block-wise 0.600 (0.593, 0.608) 0.595 (0.587, 0.603) 0.005 (–0.005, 0.016), p = .158
Trial-wise 0.545 (0.538, 0.553) 0.549 (0.542, 0.557) –0.004 (–0.015, 0.007), p = .222
23 DDM such as there was for the corresponding LBA model. An analysis of drift rate yet corresponds to the matching minus mismatching difference in rates that was computed for the LBA. As shown in Table 10, and as expected, rates were faster for easy than hard trials. Age-related effects differed per bias-type. Under block-wise biasing, older participants had larger drift rates relative to younger participants under both difficulty levels, most consistently on easy trials. This replicates the results for the LBA. However, under trial-wise biasing,
[image:23.595.99.497.420.481.2]younger participants had larger rates than older participants, most consistently on hard trials, which was never indicated under any analysis of the LBA estimates and is inconsistent with the performance data.
Table 10. DDM Mean Drift Rate (v) Posterior Parameter Estimates: Medians of means over participants (and 95% credible intervals).
Bias-type Difficulty Older Younger Older – Younger Block-wise Easy 2.78 (2.68, 2.88) 2.50 (2.40, 2.60) 0.28 (0.13, 0.41), p .001
Hard 1.53 (1.46, 1.60) 1.43 (1.35, 1.51) 0.10 (0.00, 0.20), p = .027 Trial-wise Easy 2.71 (2.61, 2.82) 2.86 (2.75, 2.97) –0.15 (–0.30, 0.01), p = .031
Hard 1.37 (1.30, 1.45) 1.52 (1.44, 1.60) –0.15 (–0.26, –0.04), p = .006
24 Non-decision time (t0). As also shown in Table 11, DDM-estimated non-decision time was longer for older than younger participants within each bias-type. For the differences between bias-types per age-group, older participants’ non-decision time was longer under block-wise than trial-wise biasing [d = 0.012 (0.007, 0.017), p .001] whereas younger participants’ non-decision time was longer under trial-wise than block-wise biasing [d = 0.015 (0.012, 0.019), p .001]. This replicates the results for the LBA estimates except that the difference in non-decision time between bias-types was larger by the LBA than by the DDM for older participants, but larger by the DDM than by the LBA for younger
[image:24.595.80.515.534.618.2]participants, with the result that the bias-type difference among younger participants was more compelling by the DDM than by the LBA. The DDM point estimates for minimum non-decision times, including of the difference between older and younger participants per bias-type, were about twice as large, and the credible intervals were about half the range, as compared with the corresponding LBA estimates.
Table 11. DDM Startpoint Variability (sz) and Non-decision Time (t0) Posterior Parameter Estimates: Medians of means over participants (and 95% credible intervals).
Parameter Bias-type Older Younger Older – Younger sz Block-wise 0.257 (0.211, 0.305) 0.272 (0.220, 0.323) –0.015 (–0.083, 0.056), p = .340
Trial-wise 0.283 (0.233, 0.334) 0.308 (0.253, 0.362) –0.024 (–0.095, 0.051), p = .264
t0 Block-wise 0.399 (0.395, 0.402) 0.280 (0.278, 0.282) 0.118 (0.114, 0.122), p < .001
Trial-wise 0.387 (0.383, 0.390) 0.296 (0.293, 0.298) 0.091 (0.086, 0.095), p < .001
25 of the DDM z parameter by averaging over optimality estimates for each posterior parameter sample. This leads to slightly different mean values of the difference compared to the Table 12 “Bias Difference” column. As was the case for the LBA, the departure from optimality was smaller for older than younger participants under block-wise biasing [older: 0.014 (−0.001, 0.036); younger: 0.028 (0.009, 0.046), d = 0.014 (−0.012, 0.039), p = .836], but it was larger for older than younger participants under trial-wise biasing [older: 0.075 (0.052, 0.094); younger: 0.064 (0.045, 0.081); d = −0.011 (−0.037, 0.019), p = .202]. Further, uncertainty about these differences was larger than for the LBA, so that the Bayesian p-values in each case did not indicate strong evidence. The predicted benefit to accuracy by setting an optimal bias was slightly larger than in the LBA model predictions. For both groups, the observed bias was closer to optimal under block-wise than trial-wise biasing [older: 0.06 (0.03, 0.09), p .001; younger: 0.03 (0.01, 0.06), p = .010].
Table 12. DDM Observed (OBS) and Optimal (OPT) Accuracy (%C), and Observed and Optimal Proportional Bias. Note that bias vales less than 0.5 favour the cue-congruent response.
Age Group Bias-Type %COBS %COPT BiasOBS BiasOPT Bias Difference
Older Block-wise 86.8 89.4 0.401 0.384 0.017 Trial-wise 86.0 88.5 0.455 0.379 0.076 Younger Block-wise 81.5 86.0 0.406 0.380 0.026
Trial-wise 83.9 87.7 0.452 0.385 0.067
27
9. Supplemental References
Baayen, R. H., Davidson, D. J., & Bates, D. M. (2008). Mixed-effects modeling with crossed random effects for subjects and items. Journal of Memory and Language, 59, 390-412. http://doi.org/10.1016/j.jml.2007.12.005
Baayen, R. H., & Milin, P. (2010). Analyzing reaction times. International Journal of Psychological Research, 3, 12-28. http://doi.org/10.21500/20112084.807
Bartoń, K. (2018). MuMIn: Multi-model inference (Version 1.42.1) [R package]. Retrieved from https://CRAN.R-project.org/package=MuMIn
Bates, D., Mächler, M., Bolker, B., & Walker, S. (2015). Fitting linear mixed-effects models using lme4. Journal of Statistical Software, 67, 1-48.
http://doi.org/10.18637/jss.v067.i01
Bogacz, R., Brown, E., Moehlis, J., Holmes, P., & Cohen, J. D. (2006). The physics of optimal decision making: A formal analysis of models of performance in two-alternative forced-choice tasks. Psychological Review, 113, 700-765.
http://doi.org/10.1037/0033-295X.113.4.700
Davies, R. A. I., Arnell, R., Birchenough, J. M. H., Grimmond, D., & Houlson, S. (2017). Reading through the life span: Individual differences in psycholinguistic effects. Journal of Experimental Psychology: Learning, Memory, and Cognition, 43, 1298-1338. http://doi.org/10.1037/xlm0000366
Eager, C., & Roy, J. (2017). Mixed effects models are sometimes terrible. Retrieved from https://arxiv.org/abs/1701.04858
Heathcote, A., Lin, Y., Reynolds, A., Strickland, L., Gretton, M., & Matzke, D. (2018). Dynamic models of choice. Behavior Research Methods.
28 Kuznetsova, A., Brockhoff, P. B., & Christensen, R. H. B. (2017). lmerTest: Tests in linear
mixed effects models. Journal of Statistical Software, 82, 1-26. http://doi.org/10.18637/jss.v082.i13
Silverman, I. (1963). Age and the tendency to withhold response. Journal of Gerontology, 18, 372-375. http://doi.org/10.1093/geronj/18.4.372
Singmann, H., & Kellen, D. (in press). An introduction to mixed models for experimental psychology. In D. H. Spieler & E. Schumacher (Eds.), New methods in neuroscience and cognitive psychology: Psychology Press.