Coral larvae are poor swimmers and
require fine-scale reef structure to
settle
Tom
Hata
1, Joshua S. Madin
2, Vivian R. Cumbo
2, Mark Denny
1, Joanna Figueiredo
4, Saki
Harii
5, Christopher J.
Thomas
6& Andrew H. Baird
3Reef coral assemblages are highly dynamic and subject to repeated disturbances, which are
predicted to increase in response to climate change. Consequently there is an urgent need to improve our understanding of the mechanisms underlying different recovery scenarios. Recent work has demonstrated that reef structural complexity can facilitate coral recovery, but the mechanism remains unclear. Similarly, experiments suggest that coral larvae can distinguish between the water from healthy and degraded reefs, however, whether or not they can use these cues to navigate to healthy reefs is an open question. Here, we use a meta-analytic approach to document that coral larval swimming speeds are orders of magnitude lower than measurements of water flow both on and off reefs. Therefore, the ability of coral larvae to navigate to reefs while in the open-ocean, or to settlement sites while on reefs is extremely limited. We then show experimentally that turbulence generated by fine scale structure is required to deliver larvae to the substratum even in conditions mimicking calm back-reef flow environments. We conclude that structural complexity at a number of scales assists coral recovery by facilitating both the delivery of coral larvae to the substratum and settlement.
Reef corals have evolved in a highly dynamic environment repeatedly subject to many types of disturbances; in particular storms and floods1 and, more recently, coral bleaching and mortality caused by global warming2. The
scale and severity of many of these disturbances are predicted to increase in response to climate change3, and
consequently there is an urgent need to improve our understanding of the mechanisms underlying reef recovery. For example, while reef structural complexity is often associated with increased rates of recovery, the precise mechanism is unknown4.
The recovery of reef coral assemblages from catastrophic disturbance is generally dependent on larval replen-ishment from other reefs5, 6 (but see ref. 7). Therefore, any process that increases larval supply should also assist
recovery. For example, reefs with high levels of connectivity should recover more quickly than reefs isolated by distance or currents from sources of larvae8, 9. Similarly, reefs that are more effective at capturing larvae from the
plankton should recover more quickly than other reefs10. Recovery is also dependent on successful settlement and
recruitment. For example, the role of reef micro-structure, such as the crevasses excavated by echinoderms while grazing11, 12, in providing a refuge from predation13–15 and thereby enhancing post-settlement survivorship is well
establish. In contrast, very little is known about the process of settlement on reefs. Under controlled laboratory conditions, numerous factors can influence whether or not a coral larva settles, including chemical cues and pho-totaxis16, 17. However, there is a paucity of direct observations of coral larval settlement in complex topographical
and hydrodynamic environments18, 19.
The entrapment of larvae by reefs, their interaction with complex reef structure, and settlement are all likely to be influenced by larval swimming speeds and sensory capacity. An important historical theme in marine ecology has been the tendency to underestimate the capacity of larvae to influence their fate. Marine larvae were initially
1Hopkins Marine Station, Stanford University, 120 Ocean View Blvd, Pacific Grove, CA, 93950-3094, USA. 2Department of Biological Sciences, Macquarie University, Sydney, New South Wales, 2109, Australia. 3ARC Centre
of Excellence for Coral Reefs Studies, James Cook University, Townsville, Queensland, 4811, Australia. 4Halmos
College of Natural Sciences and Oceanography, Nova Southeastern University, 8000 N Ocean Drive, Dania Beach, FL, 33004, USA. 5Sesoko Station, Tropical Biosphere Research Center, University of the Ryukyus, Okinawa, Japan. 6Université catholique de Louvain, Institute of Mechanics, Materials and Civil Engineering, Avenue G. Lemaître 4-6,
B-1348, Louvain-la-Neuve, Belgium. Correspondence and requests for materials should be addressed to A.H.B. (email: [email protected])
Received: 27 September 2016 Accepted: 11 April 2017 Published: xx xx xxxx
considered to be passive particles with little capacity to sense or respond to their environment20–22. These ideas led
to the paradigm of massive export of larvae from the reef of origin followed by dispersal over a large spatial scale23, 24.
However, subsequent research demonstrated that the larvae of many marine taxa can respond to a diverse array of environmental and chemical cues that give them some capacity to influence their fate18, 25. For example,
crus-tacean larvae are able to remain in estuaries by performing tidally-synchronized vertical migrations26, and reef
fish larvae can smell nearby reefs27 and swim towards them for sustained periods28. Similarly, patterns of dispersal
among coral species are influenced by aspects of their biology, such as rates of larval development29, 30 and larval
response to settlement cues31, 32. Nonetheless, the capacity of marine larvae to influence patterns of dispersal and
settlement through swimming behavior is likely to be limited because the larvae of many taxa, in particular scler-actinian corals, are very poor swimmers20. For example, even if coral larvae can distinguish between waters from
healthy and degraded reefs33, it is highly unlikely they will be able to navigate to healthy reefs if their swimming
speeds are less than currents in the open ocean.
Here, we first compare data from the literature on coral larval swimming speeds with empirical measurements of water flow both on and off reefs to explore the capacity of swimming ability to influence dispersal and settle-ment. We then test the ability of coral larvae to settle in a flume using current speeds that mimic the flow regime on reefs and explore the role of micro-structure in affecting settlement.
Methods
Larvae swimming speeds.
We included all data on coral larval swimming speeds based on our knowl-edge of the literature, because most of these data are inaccessible to current search engines, such as the work of Japanese scientists in Palau in the 1930s and 1940s. Swimming speeds were measured as distance covered per unit time in all studies. The only data we filtered was from Harrigan34, where swimming speeds for only the first7 days were used to allow direct comparisons with the other studies. The only data excluded was Hodgson35,
because we do not accept that it is possible to identify coral larvae collected in plankton tows to species. Our meta-analysis included 9 studies representing over 450 measurements of individual larva from eight coral spe-cies (Table 1). Using R36, an ANCOVA was run on the log-transformed swimming speeds to test for an effect of
larval size and swimming direction (horizontal, upwards and downwards) on swimming speeds. Larval size did not have a significant effect on swimming speed and removing it greatly improved the model based on Akaike’s Information Criterion. Differences among swimming directions in the final model were assessed using Tukey Honestly Significant Differences (TukeyHSD).
Current speeds.
Current speeds during the two weeks following coral mass spawning in six successive years at three locations in the Great Barrier Reef were obtained from the Great Barrier Reef Ocean Observing System37.The mooring sites were located in the vicinity of coral reefs at depths of 45-51 m (Heron Island North, 151.987°E, 23.380°S), 50–62 m (Heron Island South, 151.955°E, 23.513°S), and 31–37 m (Lizard Island Shelf, 145.641°E, 14.702°S). The current data were obtained from Acoustic Doppler Current Profilers. The water depth at the moor-ing sites was between 30 m and 60 m and the devices recorded water velocities at depth layers startmoor-ing from 1–2 m above this level to the water surface. The magnitudes of horizontal and vertical currents were calculated at each
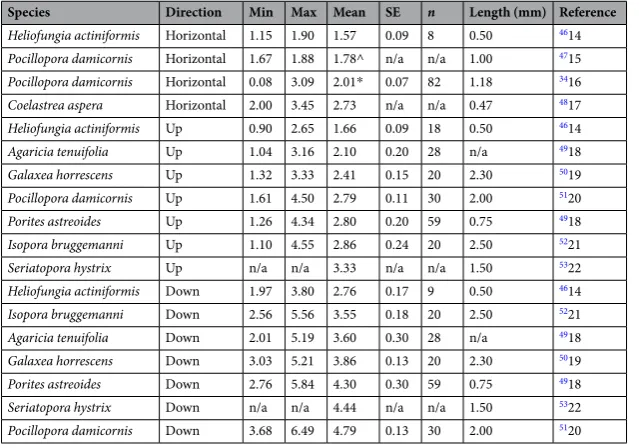
Species Direction Min Max Mean SE n Length (mm) Reference
Heliofungia actiniformis Horizontal 1.15 1.90 1.57 0.09 8 0.50 4614
Pocillopora damicornis Horizontal 1.67 1.88 1.78^ n/a n/a 1.00 4715
Pocillopora damicornis Horizontal 0.08 3.09 2.01* 0.07 82 1.18 3416
Coelastrea aspera Horizontal 2.00 3.45 2.73 n/a n/a 0.47 4817
Heliofungia actiniformis Up 0.90 2.65 1.66 0.09 18 0.50 4614
Agaricia tenuifolia Up 1.04 3.16 2.10 0.20 28 n/a 4918
Galaxea horrescens Up 1.32 3.33 2.41 0.15 20 2.30 5019
Pocillopora damicornis Up 1.61 4.50 2.79 0.11 30 2.00 5120
Porites astreoides Up 1.26 4.34 2.80 0.20 59 0.75 4918
Isopora bruggemanni Up 1.10 4.55 2.86 0.24 20 2.50 5221
Seriatopora hystrix Up n/a n/a 3.33 n/a n/a 1.50 5322
Heliofungia actiniformis Down 1.97 3.80 2.76 0.17 9 0.50 4614
Isopora bruggemanni Down 2.56 5.56 3.55 0.18 20 2.50 5221
Agaricia tenuifolia Down 2.01 5.19 3.60 0.30 28 n/a 4918
Galaxea horrescens Down 3.03 5.21 3.86 0.13 20 2.30 5019
Porites astreoides Down 2.76 5.84 4.30 0.30 59 0.75 4918
Seriatopora hystrix Down n/a n/a 4.44 n/a n/a 1.50 5322
Pocillopora damicornis Down 3.68 6.49 4.79 0.13 30 2.00 5120
Table 1. Swimming speeds (in mm s−1) for hermatypic scleractinian coral larvae. n is number of larvae; SE is
[image:2.595.155.475.46.270.2]depth layer, and these were averaged over the layers in the top 20 m of the water column to give a depth-average of horizontal and vertical current speeds.
Measuring water motion on the reef.
Water motion over the reef was measured on the fringing reef of Lizard Island, Australia, between South and Palfrey Islands (14.700°S, 145.449°E), known as Trimodal Reef. An acoustic Doppler velocimeter (ADV) was deployed from November 16 to 24 2013, recording samples at 8 Hz in a burst of 2,048 samples once every 20 min. Data were summarized by recording the mean velocity components for each burst in the toward-shore (u), along-shore (v) and vertical (w) directions for each burst. The spectra of individual bursts were examined to determine the dominant period of oscillation. Water velocities were measured using particle image velocimetry (PIV)38. A vertical plane of water parallel to water motion was illuminated bya laser sheet (300 mW, 532 nm). Waterborne particles within the laser sheet were filmed at 30 fps using a digital video camera in an underwater housing with a 532 nm band pass filter. Both laser and camera were attached to an aluminum tripod frame 40 × 40 × 30 cm (L × W × H) in size, and a black felt curtain was extended ~60 cm behind the laser sheet to reduce background light. Eight sites were chosen along a transect perpendicular to the reef crest and in line with the ADV (±2 m to either side along-shore), from the crest to 50 m towards shore. At each site, 2 min of video were recorded in an 8 × 5 cm (W × H) field of view (FOV) over a relatively flat area of the site, approximately central to the shoreward and seaward edges of the raised feature. The FOV was directly above the substrate, including the upper 0.5 to 1 cm of the substrate. Footage from two sites (located 1.0 m and 3.2 m behind the reef crest) were chosen for subsequent PIV analysis.
Video footage was stabilized using Deshaker software39 package in VirtualDub40 and 30 s of each two-min clip
was then analyzed using PIVlab41 in Matlab (Mathworks). The velocity measurements (u, w) of each site were
recorded as a single vertical velocity profile located centrally in the FOV for each frame, starting approximately 1 mm from the substrate and increasing in 1.3 mm height increments. For each site, mean toward-shore velocity (u) as a function of distance from substrate (h) was calculated across all processed frames. The velocity gradient was assumed to be linear between the substrate (where u = 0) and the closest velocity measurement to the sub-strate, a conservative estimate.
Assessing settlement behavior of
Isopora cuneata larvae.
The study organism, Isopora cuneata(Family Acroporidae), a brooding coral, was chosen because of its high abundance on Trimodal Reef and the fast swimming speeds of congeners (Table 1). Branches of I. cuneata colonies were collected in the field and were placed in an outdoor flow-through seawater tank. Flow was suspended overnight and larvae were collected in the morning by pipette and kept in 0.2 μm filtered seawater (FSW) until used in the experiments.
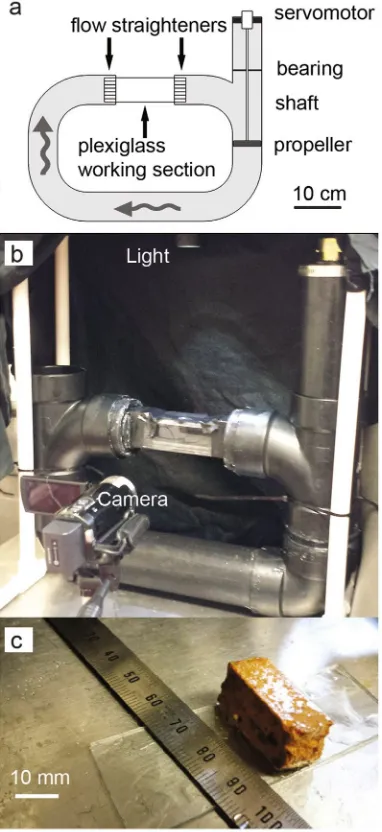
To assess larval settlement behavior in flow conditions similar to those found on coral reefs, I. cuneata larvae were placed in a recirculating flume capable of generating oscillating water motion (Fig. 1a and b). The oscillating flume was composed of acrylonitrile-butadiene-styrene pipe (7.6 cm outer diameter; 45 × 30 cm, L × H) with a clear, rectangular plexiglass working section (15 × 2.8 × 5 cm inner L × W × H). Flow recirculated in a closed ver-tical loop, driven by a propeller located in the verver-tical arm of the flume downstream of the working section. The propeller was attached to a servomotor. Rotation rate of the servomotor was controlled by an amplified analog voltage signal output by a custom Matlab script and transduced by a data acquisition card (National Instruments, model NI USB-6211). Flow straightening grids were placed on either end of the working section. The middle of the working section was illuminated from above by light from an LED source (LED Lenser
®
, model P14) passed through a narrow slit (3 mm) sitting atop the working section that spanned the length of the chamber across the middle of the working section.Larval swimming behavior was initially measured in still water in the presence of substrates containing a set-tlement cue. Cue-laden substrates were prepared in two ways:
1. Slide treatment: Crustose coralline algae (CCA) chips and attached coral matrix collected from the field were dried, pulverized, and then secured to a standard glass microscope slide with silicone adhesive. The slide was cured for 12 h before being placed on the floor of the flume working section.
2. Tile treatment: A rectangular fragment of a brick settlement tile (deployed onto the reef ~3 months prior and collected immediately prior to the experiment) containing live CCA and other algae (7 × 2.5 × 1 cm, L × W × H) was deposited directly onto the floor of the flume working section.
Larvae were exposed to each substrate separately and were not reused for any trials in this experiment. For each treatment, the flume was filled with FSW, and water was allowed to stabilize for ~10 min. Twelve I. cuneata
larvae were place in the chamber with a pipette, and water motion was allowed to stabilize for 1 min. Larvae were filmed for 10 min at 30 fps across a 4 × 2 cm (W × H) FOV. Kinematic data (position, velocity, orientation, rota-tion) of individual larvae were tracked from recorded footage using a custom Matlab script. Footage of larvae that did not remain in the illuminated midsection of the camera’s FOV were excluded from analysis.
Flow velocities and oscillation periods for the flume experiment were set based on field flow measurements on the reef. These were calculated by manually tracking 10 particles in field PIV footage recorded near the reef crest (3 m behind ADV) and on the back reef (27 m behind ADV). Particles approximately 2 cm above the substrate were tracked using the MTtrackJ plugin42 in ImageJ (NIH). Near the crest, water motion oscillated between 0
and 11 cm s−1 while flows on the back reef oscillated between 0 and 5 cm s−1. These two velocity ranges simulated
Larvae were filmed in oscillating low-flow conditions for three surface topography treatments:
1. Slide treatment. FOV: Midsection of the glass slide, including substrate.
2. Tile treatment. FOV: Two-thirds downstream of the tile’s leading edge, to avoid capturing leading edge vortices.
3. Block treatment: A small, rectangular section (1 × 2.5 × 1 cm, L × W × H) of the same settlement tile from treatment 2 was mounted on a glass slide with silicone adhesive (Fig. 1c). FOV: The entire block surface.
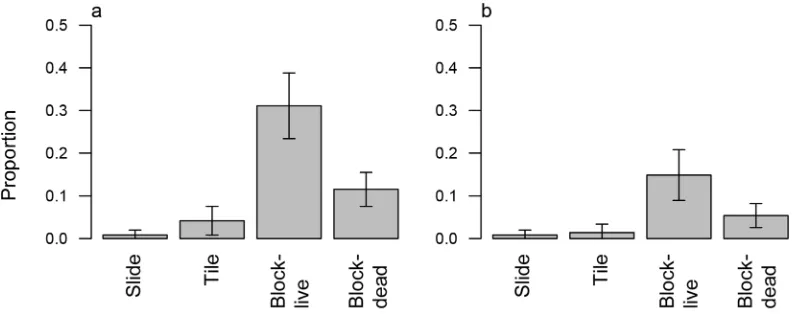
The three treatments represent conditions of increasing local turbulence within the FOV as a result of increas-ing topographical or structural complexity, which was predicted to increase larval contact with the substratum. Before each treatment, the flume was emptied and rinsed of larvae and particles then filled with fresh FSW. For each treatment, approximately 60 I. cuneata larvae were introduced into the flume via pipette while water was in motion. The experimental setup was allowed to stabilize for 2 min, then the working section of the flume was filmed for ~1 h. Subsequently, ~100 neutrally buoyant Artemia cysts (passive particles) were then introduced by pipette and filmed for approximately 10 min to characterize flow conditions. Successful adhesion (attachment to substrate for at least 5 min after initial contact) was observed solely in the block treatment. The kinematic data of larvae were tracked using a custom Matlab script, and incidences of contact with the substrate (either followed by successful attachment or immediate detachment) were recorded.
[image:4.595.157.348.47.463.2]Analysis of larvae contact and attachment.
To estimate statistical differences among topography treat-ments and live and dead larvae, we used bias-reduced logistic multiple regression to avoid complete separation in non-block treatments that had none or few successes43. Bais-reduced generalized linear models with logit linkfunction were run for larvae contact and attachment separately using R36 and the brglm function and package44.
Analysis of larval motion.
Median and interquartile range swimming speeds (velocity magnitudes regardless of direction) of individual larvae in still-water conditions were determined from the instantaneous frame-by-frame velocities per individual. To measure larval swimming performance in oscillating flow, vertical velocities (w) of larvae and neutral particles were compared in the slide and tile treatments.Data accessibility.
Larval swimming data are deposited at the Coral Trait Database45: https://coraltraits.org/ traits/169.Results and Discussion
Our meta-analysis of coral larval swim speeds46–53 (Table 1) shows that swimming speeds are much lower than
the speeds of the tidal currents and orbital wave motions found in and around coral reefs (Table 2). Coral larval swimming speeds were not associated with larval size but did vary with the direction of swimming (F2,15= 13.72, p< 0.001). Larvae swam faster when heading downwards than in the horizontal or upwards direction (Fig. 2). Mean swimming speeds for each species ranged from 1.57 mm s−1 for Heliofungia actiniformis, swimming
hori-zontally, to 4.79 mm s−1 for Pocillopora damicornis, swimming downward (Table 1). The range of swimming
speeds among all 450 measurements was 0.08 mm s−1 to 6.49 mm s−1 (Table 1). Horizontal water current speeds
in the ocean were 1–4 orders of magnitude greater than larval horizontal swimming speeds, and vertical water current speeds were 1–3 orders of magnitude greater than larval vertical swimming speeds (Tables 1 and 2). In addition, periods of slack water (i.e., the time when current speeds are potentially slow enough to allow larvae to make headway; less than 5 mm s−1 based on maximum swimming speeds in Table 1) were extremely limited
over this two-week period (Table 2). Horizontal current speeds never dropped below this 5 mm s−1 threshold,
and vertical currents were greater than the threshold for over 90% of the time (Table 2). We conclude that coral larval swimming speeds20 are orders of magnitude lower than measurements of water flow both on and off reefs.
Therefore, the ability of coral larvae to navigate to reefs while in the open-ocean, or to settlement sites while on reefs is extremely limited. Even if coral larvae can distinguish between waters from healthy and degraded reefs33,
they will not be able to navigate to healthy reefs because their swimming speeds are far too low to overcome currents.
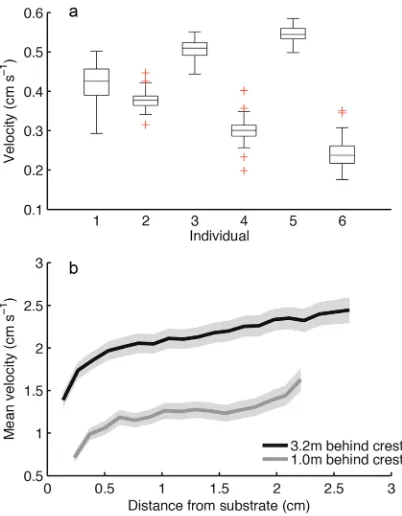
Our meta-analysis indicated that the genus Isopora contains particularly fast-swimming larvae (Table 1) and this was confirmed in the flume where I. cuneata larvae ranked among the fastest larvae, with swim speeds up to 5.8 mm s−1 (Fig. 3). However, this high swimming capacity did not translate into a high capacity for settlement.
Of the 95 I. cuneata larvae tracked in the flume, only one made contact with the substratum in the tile treatment and none became attached (Fig. 4). Attachment only occurred when a protruding structure in the form of a block was introduced to break up the flow (Fig. 4b). For the block treatment, contact and attachment also occurred regardless of whether larvae were dead or alive (Fig. 4) although both contact and attachment were higher for live larvae (Table 3). Indeed, our estimates of current velocities on the reef substratum (Fig. 3b) suggest that turbu-lence generated by the boundary layer19 is insufficient to enable coral larvae to settle. We suggest that without the
additional turbulence and eddies generated by complex micro-structure coral larvae will not be able to navigate to the substratum even when exposed to low-flow, back-reef flow conditions. We conclude that this fine-scale
Year Lizard Island Shelf Heron Island North Heron Island South Lizard Island Shelf Heron Island North Heron Island South Depth-average of horizontal current speeds (min – max, mm s−1) Total period with horizontal current speeds below 5 mm s−1 (min)
2007 n/a 133–946 54–1097 n/a 0 0
2008 52–1096 175–1016 104–979 0 0 0
2009 n/a n/a 80–1049 n/a n/a 0
2010 104–1170 118–1364 122–1378 0 0 0
2011 n/a 123–1864 70–1292 n/a 0 0
2012 24–1348 n/a 16–1410 0 n/a 0
Depth-average of vertical current speeds (min – max, mm s−1) Total period with vertical current speeds below 5 mm s−1 (min)
2007 n/a 2–77 4–240 n/a 1710 (8.4%) 180 (0.9%) 2008 1–22 4–109 6–72 11820 (58.5%) 90 (0.5%) 0 2009 n/a n/a 3–143 n/a n/a 150 (0.7%) 2010 19–135 5–297 3–164 0 10 (0.1%) 60 (0.3%) 2011 n/a 2 – 424 3–163 n/a 10 (0.1%) 210 (1.0%) 2012 2–132 n/a 2–238 1000 (5%) n/a 160 (0.8%)
Table 2. Minimum and maximum observed current speeds (left-hand panes) during the 2 weeks following coral mass spawning in 6 successive years at 3 locations in the Great Barrier Reef, and the total length (and percentage) of time during this two-week period when current speeds were under 5 mm s−1 (right-hand panes).
The speeds shown are averages of the speeds of horizontal (upper table) and vertical (lower table) currents over the top 20 m of the water column, and were obtained from the Great Barrier Reef Ocean Observing System23.
structure assists coral recovery from disturbance by facilitating both the delivery of coral larvae to the substratum and settlement. We further hypothesize that structural complexity at a larger scale4 works in a similar way by
creating turbulence to capture larvae from the water column as they flow across the reefs.
In conclusion, despite the well-documented sensory capacity of coral larvae16, 17, their swimming speeds are
much too low to enable them to navigate to suitable settlement sites under most conditions. When in the open ocean, and even on reefs, coral larvae are essentially lost at sea10. Furthermore, because flows that are sufficiently
benign for coral larvae to swim directly to the substratum are very rare, some form of topographic structure is required to generate turbulence to capture larvae from the plankton and to deliver them to the substratum. We Figure 2. Mean larval swimming speeds in three different directions, horizontal, vertical and downward (i.e., gravity assisted), taken from nine studies representing over 450 individual measurements of swimming speeds 24. Standard errors illustrate statistical differences; the characters (a) and (b) denote significant differences at alpha = 0.05, post-hoc Tukey’s test.
[image:6.595.157.372.46.253.2] [image:6.595.157.358.327.585.2]suggest that this is one mechanism by which structural complexity promotes reef recovery following disturbance4.
Consequently, maintaining structural complexity at a number of scales on reefs is vitally important in terms of aiding reef recovery. Relevant management actions include limiting factors that reduce complexity, such as destructive fishing practices54 and promoting factors that enhance complexity, such as herbivory11, 12.
References
1. Hughes, T. P. & Connell, J. H. Multiple stressors on coral reefs: A long-term perspective. Limnol and Oceanogr 44, 932–940, doi:10.4319/lo.1999.44.3_part_2.0932 (1999).
2. Spalding, M. D. & Brown, B. E. Warm-water coral reefs and climate change. Science 350, 769–771, doi:10.1126/science.aad0349
(2015).
3. Knutson, T. R. et al. Tropical cyclones and climate change. Nature Geoscience 3, 157–163, doi:10.1038/ngeo779 (2010).
4. Graham, N. A. J., Jennings, S., MacNeil, M. A., Mouillot, D. & Wilson, S. K. Predicting climate-driven regime shifts versus rebound potential in coral reefs. Nature 518, 94–97, doi:10.1038/nature14140 (2015).
5. Roberts, C. M. Connectivity and management of Caribbean coral reefs. Science 278, 1454–1457, doi:10.1126/science.278.5342.1454
(1997).
6. Graham, N. A. J. et al. Dynamic fragility of oceanic coral reef ecosystems. Proc Nat Acad Sci 103, 8425–8429, doi:10.1073/ pnas.0600693103 (2006).
7. Gilmour, J. P., Smith, L. D., Heyward, A. J., Baird, A. H. & Pratchett, M. S. Recovery of an isolated coral reef system following severe disturbance. Science 340, 69–71, doi:10.1126/science.1232310 (2013).
8. Pearson, R. G. Recovery and recolonization of coral reefs. Mar Ecol Progr Ser 4, 105–122, doi:10.3354/meps004105 (1981). 9. Almany, G. R. et al. Connectivity, biodiversity conservation and the design of marine reserve networks for coral reefs. Coral Reefs
28, 339–351, doi:10.1007/s00338-009-0484-x (2009).
10. Wolanski, E. & Kingsford, M. J. Oceanographic and behavioural assumptions in models of the fate of coral and coral reef fish larvae.
J R Soc Interface 11, 20140209–20140209, doi:10.1098/rsif.2014.0209 (2014).
11. Birkeland, C. & Randall, R. H. Facilitation of coral recruitment by echinoid excavations. Proc. 4th Int. Coral Reef Symp 1, 695–698 (1981).
12. Sammarco, P. W. Diadema and its relationship to coral spat mortality: grazing, competition, and biological disturbance. J. Exp. Mar.
Biol. Ecol. 45, 245–272, doi:10.1016/0022-0981(80)90061-1 (1980).
13. Brock, R. E. An experimental study on the effects of grazing by parrotfishes and the role of refuges in benthic community structure.
Mar Biol 51, 381–388, doi:10.1007/BF00389216 (1979).
Figure 4. Settlement success of coral larvae in oscillating flume tank. Proportion of Isopora cuneata larvae making (a) contact with settlement substrates covered with CCA and forming (b) attachment for more than 5 min. Substrate treatments were: microscope slide, flat settlement tile and block. For substrates where contact was observed, flume experiments were run separately with live and dead larvae. Standard errors illustrate statistical differences; also see Table 3.
Estimate Std. Error z value Pr(>|z|) Contact
(Block, Dead) −2.0369 0.3913 −5.206 0.000
Slide −3.9995 1.4764 −2.709 0.007
Tile −2.3392 0.9194 −2.544 0.011 Live 1.2406 0.5317 2.333 0.020 Attachment
(Block, Dead) −2.8663 0.5538 −5.176 0.000
Slide −3.0506 1.5065 −2.025 0.043
Tile −2.5174 1.5184 −1.658 0.097 Live 1.1210 0.7254 1.545 0.122
[image:7.595.156.552.46.203.2]14. Brandl, S. J. & Bellwood, D. R. Microtopographic refuges shape consumer-producer dynamics by mediating consumer functional diversity. Oecologia, 1–15 (2016).
15. Doropoulos, C. et al. Characterizing the ecological trade-offs throughout the early ontogeny of coral recruitment. Ecol. Monogr. 86, 20–44 (2016).
16. Mundy, C. N. & Babcock, R. C. Role of light intensity and spectral quality in coral settlement: Implications for depth-dependent settlement? J. Exp. Mar. Biol. Ecol. 223, 235–255, doi:10.1016/S0022-0981(97)00167-6 (1998).
17. Heyward, A. J. & Negri, A. P. Natural inducers for coral larval metamorphosis. Coral Reefs 18, 273–279, doi:10.1007/s003380050193
(1999).
18. Koehl, M. A. R. & Hadfield, M. G. Hydrodynamics of larval settlement from a larva’s point of view. Integr. Comp. Biol. 50, 539–551, doi:10.1093/icb/icq101 (2010).
19. Koehl, M. A. R. Mini review: Hydrodynamics of larval settlement into fouling communities. Biofouling 23, 357–368, doi:10.1080/08927010701492250 (2007).
20. Chia, F. S., Buckland-Nicks, J. & Young, C. M. Locomotion of marine invertebrate larvae: a review. Can J Zool 62, 1205–1222, doi:10.1139/z84-176 (1984).
21. Young, C. M. & Chia, F. S. In Reproduction of Marine Invertebrates Vol. IX (eds A. C. Giese & J. S. Pearse) Academic Press, 1985. 22. Thorson, G. Reproductive and larval ecology of marine bottom invertebrates. Biol Rev 25, 1–45, doi:10.1111/brv.1950.25.issue-1
(1950).
23. Williams, D. M., Wolanski, E. & Andrews, J. C. Transport mechanisms and the potential movement of planktonic larvae in the central Great Barrier Reef. Coral Reefs 3, 229–236, doi:10.1007/BF00288259 (1984).
24. Scheltema, R. S. On dispersal and planktonic larvae of benthic invertebrates: an eclectic overview and summary of problems. Bull.
Mar. Sci. 39, 290–322 (1986).
25. Shanks, A. L. Pelagic larval duration and dispersal distance revisited. Biol Bull 216, 373–385, doi:10.1086/BBLv216n3p373 (2009). 26. Tankersley, R. A., McKelvey, L. M. & Forward, R. B. Responses of estuarine crab megalopae to pressure, salinity and light -
implications for flood tide transport. Mar Biol 122, 391–400, doi:10.1007/BF00350871 (1995).
27. Leis, J. M., Sweatman, H. P. A. & Reader, S. E. What the pelagic stages of coral reef fishes are doing out in blue water: Daytime field observations of larval behavioural capabilities. Mar Freshwater Res 47, 401–411, doi:10.1071/MF9960401 (1996).
28. Stobutzki, I. C. & Bellwood, D. R. Sustained swimming abilities of the late pelagic stages of coral reef fishes. Mar Ecol Progr Ser 149, 35–41, doi:10.3354/meps149035 (1997).
29. Connolly, S. R. & Baird, A. H. Estimating dispersal potential for marine larvae: dynamic models applied to scleractinian corals.
Ecology 91, 3572–3583, doi:10.1890/10-0143.1 (2010).
30. Figueiredo, J., Baird, A. H. & Connolly, S. R. Synthesizing larval competence dynamics and reef-scale retention reveals a high potential for self-recruitment in corals. Ecology 94, 650–659, doi:10.1890/12-0767.1 (2013).
31. Harrington, L., Fabricius, K., De’Ath, G. & Negri, A. Recognition and selection of settlement substrata determine post-settlement survival in corals. Ecology 85, 3428–3437, doi:10.1890/04-0298 (2004).
32. Ritson-Williams, R. et al. New perspectives on ecological mechanisms affecting coral recruitment on reefs. Smithson. Contrib. Mar. Sci. 38, 437–457, doi:10.5479/si.01960768.38.437 (2009).
33. Dixson, D. L., Abrego, D. & Hay, M. E. Chemically mediated behavior of recruiting corals and fishes: A tipping point that may limit reef recovery. Science 345, 892–897, doi:10.1126/science.1255057 (2014).
34. Harrigan, J. The planula larva of Pocillopora damicornis; lunar periodicity of swarming and substrate selection behaviour, PhD Thesis, University of Hawaii (1972).
35. Hodgson, G. Abundance and distribution of planktonic coral larvae in Kaneohe Bay, Oahu, Hawaii. Mar Ecol Progr Ser 26, 61–67, doi:10.3354/meps026061 (1985).
36. R: A language and environment for statistical computing. (R Foundation for Statistical Computing, Vienna, Austria, 2015). 37. IMOS. Australian National Mooring Network Facility - Current velocity time-series. https://imos.aodn.org.au/imo323/ (2013). 38. Whitman, E. R. & Reidenbach, M. A. Benthic flow environments affect recruitment of Crassostrea virginica larvae to an intertidal
oyster reef. Mar Ecol Progr Ser 463, 177–191, doi:10.3354/meps09882 (2012). 39. Thalin, G. Deshaker. http://www.guthspot.se/video/deshaker.htm (2013). 40. Lee, A. VirtualDub. Retrieved from http://www.virtualdub.com (2013).
41. Thielicke, W. & Stamhuis, E. J. PIVlab – Towards user-friendly, affordable and accurate digital particle image velocimetry in MATLAB. J Open Res Softw 2, e30, doi:10.5334/jors.bl (2014).
42. Meijering, E., Dzyubachyk, O. & Smal, I. Methods for cell and particle tracking. Methods Enzymol 504, 183–200, doi: 10.1016/B978-0-12-391857-4.00009-4 (2012).
43. Firth, D. Bias reduction of maximum likelihood estimates. Biometrika 80, 27–38, doi:10.1093/biomet/80.1.27 (1993).
44. Kosmidis, I. brglm: Bias reduction in binomial-response Generalized Linear Models http://www.ucl.ac.uk/~ucakiko/software.html (2013).
45. Madin, J. S. et al. The Coral Trait Database, a curated database of trait information for coral species from the global oceans. Scientific Data 3, 160017, doi:10.1038/sdata.2016.17 (2016).
46. Abe, N. Post-larval development of the coral Fungia actiniformis var. palawensis Doderlein. Palao Tropical Biological Station. Studies
1, 73–93 (1937).
47. Harii, S. & Kayanne, H. Larval settlement of corals in flowing water using a racetrack flume. Mar. Technol. Soc. J. 36, 76–79, doi:10.4031/002533202787914188 (2002).
48. Motoda, S. Observation of period of extrusion of planula of Goniastrea aspera (Verrill.). Kagaku Nanyo 1, 5–7 (1939).
49. Gleason, D. F., Danilowicz, B. S. & Nolan, C. J. Reef waters stimulate substratum exploration in planulae from brooding Caribbean corals. Coral Reefs 28, 549–554, doi:10.1007/s00338-009-0480-1 (2009).
50. Atoda, K. The larva and postlarval development of the reef-building corals IV Galaxea aspera (Quelch). J. Morphol. 89, 17–36, doi:10.1002/(ISSN)1097-4687 (1951).
51. Atoda, K. The larva and postlarval development of some reef-building corals I. Pocillopora damicornis cespitosa (Dana). Scientific
Reports of Tohoku University 4th series (Biology) 18, 24–47 (1947).
52. Atoda, K. The larva and postlarval devlopment of the reef-building corals III. Acropora brueggemanni (Brook). J. Morphol. 89, 1–16, doi:10.1002/jmor.v89:1 (1951).
53. Atoda, K. The larva and post-larval development of some reef-building corals V. Seriatopora hystrix (Dana). Scientific Reports of
Tohoku University 4th series (Biology) 19, 33–39 (1951).
54. Campbell, S. J. et al. Avoiding conflicts and protecting coral reefs: customary management benefits marine habitats and fish biomass.
Oryx 46, 486–494, doi:10.1017/S0030605312000348 (2012).
Author Contributions
Additional Information
Competing Interests: The authors declare that they have no competing interests.
Publisher's note: Springer Nature remains neutral with regard to jurisdictional claims in published maps and institutional affiliations.
Open Access This article is licensed under a Creative Commons Attribution 4.0 International License, which permits use, sharing, adaptation, distribution and reproduction in any medium or format, as long as you give appropriate credit to the original author(s) and the source, provide a link to the Cre-ative Commons license, and indicate if changes were made. The images or other third party material in this article are included in the article’s Creative Commons license, unless indicated otherwise in a credit line to the material. If material is not included in the article’s Creative Commons license and your intended use is not per-mitted by statutory regulation or exceeds the perper-mitted use, you will need to obtain permission directly from the copyright holder. To view a copy of this license, visit http://creativecommons.org/licenses/by/4.0/.