Assembly by Live-Cell Microscopy
Sheikh Abdul Rahman,a*Peter Koch,aJulian Weichsel,b*William J. Godinez,cUlrich Schwarz,bKarl Rohr,cDon C. Lamb,d Hans-Georg Kräusslich,aBarbara Müllera
Department of Infectious Diseases, Virology, University Hospital Heidelberg, Heidelberg, Germanya
; Bioquant, University of Heidelberg, Heidelberg, Germanyb ; Bioquant, IPMB, University of Heidelberg and DKFZ, Heidelberg, Germanyc
; Department of Chemistry and Biochemistry, Ludwig Maximilians University, Munich, Germanyd
ABSTRACT
Human immunodeficiency virus type 1 (HIV-1) particles assemble at the plasma membrane, which is lined by a dense network of filamentous actin (F-actin). Large amounts of actin have been detected in HIV-1 virions, proposed to be incorporated by interac-tions with the nucleocapsid domain of the viral polyprotein Gag. Previous studies addressing the role of F-actin in HIV-1 parti-cle formation using F-actin-interfering drugs did not yield consistent results. Filamentous structures pointing toward nascent HIV-1 budding sites, detected by cryo-electron tomography and atomic force microscopy, prompted us to revisit the role of F-actin in HIV-1 assembly by live-cell microscopy. HeLa cells coexpressing HIV-1 carrying fluorescently labeled Gag and a labeled F-actin-binding peptide were imaged by live-cell total internal reflection fluorescence microscopy (TIR-FM). Computational analysis of image series did not reveal characteristic patterns of F-actin in the vicinity of viral budding sites. Furthermore, no transient recruitment of F-actin during bud formation was detected by monitoring fluorescence intensity changes at nascent HIV-1 assembly sites. The chosen approach allowed us to measure the effect of F-actin-interfering drugs on the assembly of indi-vidual virions in parallel with monitoring changes in the F-actin network of the respective cell. Treatment of cells with latruncu-lin did not affect the efficiency and dynamics of Gag assembly under conditions resulting in the disruption of F-actin filaments. Normal assembly rates were also observed upon transient stabilization of F-actin by short-term treatment with jasplakinolide. Taken together, these findings indicate that actin filament dynamics are dispensable for HIV-1 Gag assembly at the plasma mem-brane of HeLa cells.
IMPORTANCE
HIV-1 particles assemble at the plasma membrane of virus-producing cells. This membrane is lined by a dense network of actin filaments that might either present a physical obstacle to the formation of virus particles or generate force promoting the assem-bly process. Drug-mediated interference with the actin cytoskeleton showed different results for the formation of retroviral par-ticles in different studies, likely due to general effects on the cell upon prolonged drug treatment. Here, we characterized the ef-fect of actin-interfering compounds on the HIV-1 assembly process by direct observation of virus formation in live cells, which allowed us to measure assembly rate constants directly upon drug addition. Virus assembly proceeded with normal rates when actin filaments were either disrupted or stabilized. Taken together with the absence of characteristic actin filament patterns at viral budding sites in our analyses, this indicates that the actin network is dispensable for HIV-1 assembly.
H
uman immunodeficiency virus type 1 (HIV-1) particles are released from a virus-producing cell through the formation of spherical, lipid-enveloped virus buds bulging from the plasma membrane; constriction of the bud neck finally culminates in ab-scission of the virus envelope from the host cell membrane (1). Changes in membrane curvature accompanying bud formation are believed to be induced, at least in part, by cooperation between the viral polyprotein Gag, assembling into a curved protein lattice at the cytoplasmic face of the membrane, and the cellular endo-somal sorting complex required for transport (ESCRT) machin-ery, which is involved in a number of cellular processes requiring membrane abscission. Additional host cell proteins may, how-ever, be exploited by the virus to promote this process.The plasma membrane is lined with a dense and dynamic net-work of filamentous actin (F-actin), which generates force for cel-lular processes involving deformation or reorganization of the membrane (e.g., filopodium formation, membrane ruffling, or endocytosis) (reviewed in references2and3). Subversion of the actin cytoskeleton for a variety of replication steps, including par-ticle assembly and release, has been reported for numerous viruses
(reviewed in reference4). It is thus conceivable that HIV-1 reor-ganizes and employs cortical F-actin to promote virus bud forma-tion. In line with this, incorporation of large amounts of actin into HIV-1 (5–7) and a specific interaction of actin with the nucleo-capsid (NC) domain of Gag (8,9) have been reported. However, while the importance of actin cytoskeleton dynamics for the direct
Received10 February 2014 Accepted24 April 2014
Published ahead of print30 April 2014 Editor:W. I. Sundquist
Address correspondence to Barbara Müller, [email protected]. * Present address: Sheikh Abdul Rahman, HIV Drug Resistance Program, National Cancer Institute, Frederick, Maryland, USA; Julian Weichsel, Department of Chemistry, University of California at Berkeley, Berkeley, California, USA.
Supplemental material for this article may be found athttp://dx.doi.org/10.1128
/JVI.00431-14.
Copyright © 2014, American Society for Microbiology. All Rights Reserved.
doi:10.1128/JVI.00431-14
on November 7, 2019 by guest
http://jvi.asm.org/
cell-to-cell transmission of HIV-1 through so-called virological synapses in tissue culture is undisputed (10,11; reviewed in refer-ences4,12, and13), the role of F-actin dynamics in the assembly of the viral structure itself is less clearly defined.
On theoretical grounds, both a negative influence of F-actin by obstructing membrane access of virion components and/or mem-brane deformation during bud formation as well as a positive contribution of forces generated by actin polymerization to mem-brane bulging could be envisioned. Analyses of the effect of F-actin-interfering drugs on the efficiency of retroviral particle formation yielded different results. Depending on the drug and experimental conditions used, complete abrogation of Gag mem-brane trafficking (14), partial inhibition of particle formation (10, 15), no effect of an F-actin-disrupting drug on particle release (10), and even a moderate increase in particle formation in the case of short-term cytochalasin D (cytoD) treatment of equine infectious anemia virus (EIAV)-producing cells (16) have been reported. This can be explained, at least in part, by a difficulty inherent to the ensemble measurements used to quantitate virus production: the use of bulk virus release as a readout necessitates prolonged drug treatment periods, which may favor pleiotropic effects. Thus, potential direct effects on viral particle formation are not easily discriminated from indirect effects. In contrast, live-cell imaging provides not only the opportunity to capture tran-sient, nonsynchronized interactions between virus and cellular components but also allows focusing on single cells or individual events. Furthermore, drug effects can be directly visualized within short time windows. Consequently, parallel imaging of virus as-sembly and F-actin dynamics before as well as directly after drug addition should allow discrimination between direct and indirect drug effects.
Two findings derived from microscopic analyses of HIV-1 as-sembly sites prompted us to revisit the question of potential F-ac-tin involvement in HIV-1 Gag assembly by exploiF-ac-ting the strengths of a live-cell microscopy approach. First, Gladnikoff and coworkers (17) analyzed nascent retroviral budding sites at the surface of HIV-1 and murine leukemia virus (MLV) Gag-express-ing NIH 3T3 and HeLa cells by atomic force microscopy (AFM). Those authors observed prominent star-shaped structures with arm lengths of up to 4m centered at a subset of budding sites. The large “asters” were interpreted as structured F-actin assem-blies recruited by retroviral Gag; this interpretation was supported by the dependence of aster formation on the presence of the pre-sumed actin-interacting NC domain of Gag (17). Second, a mor-phological connection between F-actin and nascent HIV-1 assem-bly sites was also conveyed by cryo-electron tomography (cET) analysis of budding sites at the membrane of HIV-1 or Gag-Pol-expressing glioblastoma cells (18). Filamentous actin struc-tures were clearly detectable near 34 of 39 budding sites analyzed and in some cases appeared to be connected to the rims of the bulging HIV-1 Gag layer (18).
Results from both studies suggested that a Gag-mediated reor-ganization of F-actin structures at the plasma membrane might promote or facilitate the membrane deformations occurring dur-ing HIV-1 assembly. However, cET does not yield any dynamic information, and AFM measurements were performed with a low temporal resolution (10 min/frame) compared to the time frame determined for completion of an HIV-1 bud (half-life [t1/2] of⬃3
min) (19). In contrast, single-virus tracking (SVT) provides the opportunity to directly observe both F-actin dynamics as well as
HIV-1 particle assembly in live cells with high time resolution for a large number of individual budding sites, thereby allowing de-tection of rapid and transient changes occurring in an asynchro-nous manner. Using previously characterized fluorescently la-beled HIV-1 derivatives (20, 21) together with a fluorescently labeled F-actin-binding peptide (Lifeact) (22), we have analyzed potential interactions of F-actin and nascent viral budding sites in HeLa cells by SVT. The chosen approach allowed us to study F-actin dynamics at individual HIV-1 assembly sites and to investi-gate the influence of treatment with actin-interfering drugs on the kinetics of HIV-1 assembly under defined conditions.
MATERIALS AND METHODS
Plasmids.Plasmids pCHIV and pCHIVeGFPwere described previously (21). Plasmid pLifeact.mCherry was kindly provided by Nikolas Herold. It was cloned by exchanging a BamHI/NotI fragment from pLifeact.GFP (a kind gift of Michael Sixt) (22) with the corresponding mCherry-encoding fragment from pmCherry-N1 (Clontech).
Tissue culture and transfections.HeLa cells were cultured in Dulbec-co’s modified Eagle’s medium (DMEM; Invitrogen) supplemented with 10% fetal calf serum (FCS; Biochrom), penicillin (100 IU/ml),
streptomy-cin (100g/ml), 4 mM glutamine, and 10 mM HEPES (pH 7.4). For
cotransfection, cells were seeded into 8-well glass-bottom chamber slides
(LabTek; Nunc) at a density of 1.5⫻104cells/well and transfected on the
following day with 400 ng of pCHIV derivatives and 100 ng of pLifeact. mCherry. Transfection was performed by using either Fugene 6 (Roche) or ExtremeGene9 (Roche) according to the manufacturer’s instructions. At 12 to 20 h posttransfection (p.t.), cells were transferred to imaging buffer (25 mM HEPES [pH 7.4], 137 mM NaCl, 2.7 mM KCl, 1 mM
CaCl2, 1 mM MgCl2, and 30 mM glucose) and subjected to live-cell
im-aging.
Cytotoxicity assay.Jasplakinolide solution (1 mM in dimethyl sulfox-ide [DMSO]) and latrunculin B (LAT-B) were purchased from Calbi-ochem; a 2.5 mM stock solution of LAT-B was prepared in 100% DMSO. The minimum nontoxic concentration for each drug was determined by using a standard 3-(4,5-dimethylthiazol-2-yl)-5-(3-carboxymethoxyphe-nyl)-2-(4-sulfophenyl)-2H-tetrazolium (MTS) cell proliferation assay.
For this, HeLa cells were seeded into a 96-well plate at a density of 0.5⫻
104cells per well and incubated overnight at 37°C in 5% CO
2. On the
following day, the indicated concentrations of either LAT-B or jasplakino-lide, or the corresponding DMSO concentration as a control, were added to the culture medium, and incubation was continued for 2 h at 37°C. Cells were washed with prewarmed phosphate-buffered saline (PBS) and stained for dehydrogenase activity by using reagents provided with the CellTiter 96 AQueous One Solution Cell Proliferation assay (Promega) according to the manufacturer’s instructions. Cells were incubated for 5 h at 37°C, followed by measurement of absorbance at 495 nm.
Microscopy and single-virus tracking.HeLa cells were transfected and prepared for live-cell imaging as described above. Basic microscopy
settings were described previously (21,23). Briefly, live-cell imaging was
performed by using a highly sensitive total internal reflection fluorescence microscopy (TIR-FM) setup (objective type; Visitron Systems) based on a Zeiss Axiovert 200M fluorescence microscope equipped with an Alpha
Plan Fluar 100⫻/1.45 oil immersion total internal reflection fluorescence
(TIRF) objective. A 43 series ion laser (MellesGriot) with a frequency range of 457 to 568 nm was used for excitation at 488 nm (enhanced green fluorescent protein [eGFP]) and 568 nm (mCherry). For dual-color im-aging, the excitation wavelength was chosen by an acousto-optic tunable filter (VTiVisiTech, International Vision Technology for Science, assem-bled by Visitron Systems GmbH) coupled to an optic fiber connected with the laser condenser going through the TIRF objective. The TIRF angle was manually controlled. Image sequences were acquired by using Meta-morph (Visitron), using a sensitive electron-multiplying
on November 7, 2019 by guest
http://jvi.asm.org/
device (EM-CCD) camera (Cascade II, 512 by 512 pixels; Roper Scien-tific).
Single-virus tracking and data analysis.Changes in eGFP-tagged Gag (Gag.eGFP) fluorescence intensity over time were analyzed as a signature for HIV-1 assembly progress. Individual assembly sites were detected and localized by using a probabilistic approach for automated tracking of mul-tiple virus particles, as described previously (24). The mean fluorescence intensity at the position of identified particles was computed based on the
standard deviation of the two-dimensional (2D) Gaussian function (xy).
Signal intensity was measured within the radius ofxy. Local background
intensity was determined based on an annulus with inner and outer radii
ofxyand 5xy, respectively, and subtracted from the signal intensity
measured within the radius ofxy. In our previous work, we showed that
probabilistic tracking methods outperform deterministic ones and achieve accurate results (24). Our probabilistic approach for virus particle tracking was optimized and extended to improve performance as well as to automatically detect relevant events in the multichannel microscopy image data. Briefly, with this approach, multiple particles are tracked by solving a sequential estimation problem within a Bayesian framework using a Kalman filter for spatiotemporal filtering. For the dynamical model, we used Gaussian random-walk dynamics, and for the measure-ment model, the intensity information was directly exploited. The track-ing approach takes into account anisotropic uncertainty information based on the underlying probability distributions using the Mahalanobis distance. For preprocessing, we used a background subtraction scheme based on the filtered image. In addition, we developed an automatic de-tection scheme for identifying budding events, which exploits the steady increase of the intensity over time by using a differential approach.
Since the temporal distribution of the occurrences of individual as-sembly sites was asynchronous, we aligned the intensities of different par-ticles by synchronizing the time of initiation of individual assembly sites, as described previously (19). Signals identified as typical HIV-1 assembly sites displayed a characteristic change of fluorescence intensity over time: an exponentially growing phase (phase I), representing the dynamic oli-gomerization of Gag, and a plateau phase (phase II), indicating the com-pletion of Gag accumulation. A subsequent phase characterized by a rapid change in instantaneous velocity and fluorescence intensity (phase III) was observed only for a subset of traces. Here, the rate of assembly was
calculated from phase I by using a saturating exponential function,y⫽
AI{1⫺exp[⫺kI(t⫺t0)]}, whereAIis maximum fluorescence intensity,kI
is the rate at which fluorescence intensity increases, andt0is the initial
time of assembly.
Semiautomatic quantitation of assembly sites in still images was per-formed by using a previously described spot detection algorithm (25). Calculation of rate constants, statistical analyses, and plotting of data for all experiments shown were performed by using GraphPadPrism.
Analysis of Lifeact fluorescence density and coherency from still im-ages.In order to check if virus budding has any statistically significant local effect on the underlying actin cytoskeleton, visible within the reso-lution of fluorescence microscopy, we analyzed actin patterns in close proximity to the budding sites using an automated image processing ap-proach. We employed two parameters to quantify changes in actin struc-tures, fluorescence density and coherency. Fluorescence density on F-ac-tin-stained images is a direct indicator for the local concentration of F-actin, while the coherency analysis is well suited to classify the quality of actin network structures in cells, as previously described (26). Briefly, coherency is a side product of the structure tensor analysis, which extracts the local orientation of structures with respect to the squared gray value gradient within a small region of an image, constrained in this context by a Gaussian filter with a size of 9 pixels and a standard deviation of 3 pixels in each dimension (27). Coherency is defined as the squared relative dif-ference of the two squared gray value gradients parallel and orthogonal to the local orientation, i.e., the two eigenvalues of the structure tensor. Therefore, sharp network structures like actin fibers yield maximum
co-herency values, while for a homogeneous gray value background or white noise, the coherency parameter approaches zero.
This analysis was employed previously to extract the filament orienta-tion distribuorienta-tion of actin networks from electron tomography data of fish keratocyte lamellipodia (28). Both fluorescence density and coherency in the red channel were measured within a small neighborhood around the individual budding sites and averaged over the time course of budding. The distributions of these temporal averages from all 215 tracked sites in 8
different cells are indicated as “virus” inFig. 1BandC. For comparison,
we performed identical analyses at the same number of random positions,
uniformly scattered within the outline of the respective cells (Fig. 1Band
C, “random”). Finally, we determined density and coherency averaging
over all pixel positions inside the cell boundaries (Fig. 1BandC, “total”),
resulting in an average number of⬃29,000 pixels analyzed per cell. This
procedure corresponds to the limit of analyzing a large number
(⬎⬎29,000) of uniformly randomly located sites within each cell.
RESULTS
In order to monitor HIV-1 virion assembly by live-cell micros-copy, we employed our previously described fluorescently labeled HIV-1 derivative pCHIVeGFP(21), which carries an eGFP moiety between the MA and CA domains of Gag. This derivative is non-replication competent due to the lack of viral long terminal repeat regions but expresses all HIV-1 proteins except for Nef and pro-duces particles with wild-type morphology and cell entry
effi-A
Gag.eGFP Lifeact.mCherrydensity [a.u.]
coherency [a.u.]
virus random total virus random total
1.0 0.8 0.6 0.4 0.2 0.0
1.0 0.8 0.6 0.4 0.2 0.0
B
C
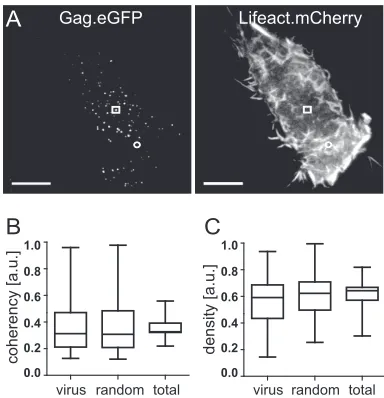
FIG 1Analysis of F-actin density and coherency at nascent HIV-1 budding
sites. (A) HeLa cells were cotransfected with pCHIV/pCHIVeGFPand pLifeact.
mCherry and analyzed by live-cell TIR-FM at 20 h p.t., as described in Mate-rials and Methods. Shown are TIR-FM still images from Movie S2 in the sup-plemental material recorded in the green (left) and red (right) channels, re-spectively, 20 min after the initiation of image acquisition. Squares indicate a representative HIV-1 budding site, and circles indicate a representative
non-budding site. Bar, 10m. (B and C) Distribution of F-actin coherency (B) and
density (C) at 215 HIV-1 budding sites (“virus”), 215 randomly selected non-budding sites (“random”), or all pixels within the boundaries of the respective cells (“total”). HIV budding sites and nonbudding sites were identified from recordings in the GFP channel, and density and coherency of the correspond-ing signal in the red channel were determined as described in Materials and Methods. The box plots illustrate the distribution of data obtained from eight individual cells. Each box is divided at the median value, and lower and upper boundaries of the box indicate the 25th and 75th percentiles of the distribu-tion. Whiskers extend to the most extreme data points within 1.5 times the interquartile range (i.e., the range between the 25th and 75th percentiles). a.u., arbitrary units.
on November 7, 2019 by guest
http://jvi.asm.org/
[image:3.585.324.516.65.264.2]ciency when complemented with an equimolar amount of its un-labeled counterpart, pCHIV (21). Cotransfection of cells with pCHIV and pCHIVeGFPgives rise to punctate fluorescent
assem-bly sites at the plasma membrane, which correspond mostly to individual virus buds and can be monitored by live-cell TIR-FM with time resolution in the range of 1 s/frame (19). This experi-mental system was previously used to characterize the kinetics of the HIV-1 Gag assembly process (19) and the transient recruit-ment of a cellular protein associated with the endosomal sorting complex required for transport (ESCRT) to nascent budding sites (29).
For parallel visualization of F-actin in live cells, we made use of an mCherry-tagged version of Lifeact, a 17-amino-acid peptide that binds to filamentous actin structures within live eukaryotic cells without detectable interference with cellular processes (22). HeLa cells were cotransfected with Lifeact.mCherry and an equimolar mixture of pCHIV and pCHIVeGFP. Comparison of the
dynamic alterations of Lifeact.mCherry in cells coexpressing HIV-1eGFPand Lifeact.mCherry with those in cells transfected with
pLifeact.mCherry alone revealed no notable difference in F-actin dynamics observed at the ventral cell surface (data not shown; see also Movies S1 and S2 in the supplemental material). At 12 to 20 h p.t., individual cells coexpressing mCherry and eGFP, which dis-played an early stage of budding site formation (evidenced by diffuse cytoplasmic staining for Gag.eGFP and a very low number of detectable budding sites at the plasma membrane), were se-lected and subjected to microscopic observation over a period of 1 to 2 h. Numerous individual Gag.eGFP punctae appeared at the plasma membrane and gradually increased in fluorescence inten-sity over a period of several minutes (see Movie S2 in the supple-mental material), in accordance with previously reported findings (19,30).
F-actin distribution patterns with respect to HIV-1 assembly sites.Formation of prominent micrometer-sized F-actin struc-tures at the plasma membrane of virus-producing cells and in the vicinity of HIV-1 buds, as described previously (17), should be detectable by TIR-FM, although the spatial resolution of this tech-nique would not allow capturing of structural details. Computa-tional image analysis was performed to obtain information on a statistically significant number of individual sites (Fig. 1).
We first analyzed the average spatial distribution of F-actin with respect to HIV-1 budding sites using an automated image analysis approach (26,27). The parameters fluorescence density and fluorescence coherency were employed in order to detect characteristic F-actin patterns at all individual HIV-1 assembly sites tracked from 8 individual cells (n ⫽215). The density of Lifeact.mCherry fluorescence is considered a direct indicator of the concentration of F-actin at the position of measurement. In contrast, coherency is a parameter chosen to classify the quality of actin network structures in cells. By definition, it extracts the rel-ative strength of the edges of structures compared to their sur-roundings; thus, sharp and aligned network structures like actin filaments yield maximum coherency values, while coherency val-ues approach zero for a homogeneous gray background or for random noise.
We previously tested the sensitivity of this parameter to struc-tural changes using simulated microscopy images based on sto-chastic realizations of a biophysical filament model as a bench-mark (26), demonstrating that coherency measurements are well suited to detect changes in the density, intensity, and average fiber
length of filamentous networks. In the case of star-shaped struc-tures, coherency would detect the peripheral aster region, whereas values at the center point may not be significant due to averaging of gradient orientations. However, based on a previously reported fluorescence microscopy image of typical actin aster shapes (17), we expect that density as our second parameter complements this lack of sensitivity by yielding significantly higher values at the central point of asters than for their surroundings. Therefore, we averaged coherency over an annulus with boundaries at 3 and 7 pixels around the tracked virus position, while actin density was measured within a circle with a diameter of 6 pixels around the individual budding sites. Both measures were averaged over the time course of assembly in order to detect correlations in the po-sitions of budding sites and the location of ordered F-actin struc-tures.
Figure 1BandC(virus) show the distributions of coherency and density measurements, respectively, for 215 individual assem-bly sites. These data were compared to corresponding data sets obtained either for the same number of random positions, uni-formly scattered within the boundaries of the respective cell (Fig. 1B and C, random), or from averaging over the whole area (⬃29,000 pixels) of the individual cell (Fig. 1BandC, total). This analysis did not reveal significant differences in either F-actin co-herency or density for HIV-1 budding sites compared to other sites in the same cell.
Investigation of actin dynamics at nascent budding sites.The image analyses summarized inFig. 1were generated by averaging over the time course of Gag.eGFP assembly and would thus not detect transiently occurring patterns of colocalization that are vis-ible for only part of the observation period. We therefore in-spected image series for transient accumulation of F-actin at nas-cent viral budding sites. A previous characterization of Gag assembly dynamics revealed that the initial phase of this process follows a saturating exponential at prototypic budding sites (19, 30) and that gradual or transient recruitment of ESCRT compo-nents for time periods of⬍1 min during this process can be de-tected (29, 31). Here, we first measured Gag assembly kinetics during the initial exponential phase, as described previously (19), in order to control for a possible influence of Lifeact.mCherry expression on HIV-1 assembly. Analysis of⬎200 tracks from 12 individual cells yielded an average rate constant (k) of 0.005⫾ 0.0026 s⫺1, in very good agreement with the rate of 0.0043⫾ 0.0005 s⫺1obtained for HeLa cells expressing HIV-1eGFPalone
(19). This result indicates that coexpression of Lifeact.mCherry did not alter the dynamics of the HIV-1 assembly process.
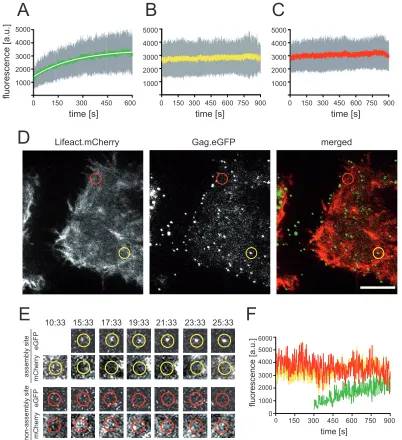
We then analyzed the Lifeact.mCherry signal recorded over time at the positions where HIV-1 budding site formation was detected by TIR-FM (Fig. 2; see also Movie S3 in the supplemental material). Only budding sites that were recorded from the onset of Gag.eGFP detection for at least 250 frames were selected for anal-ysis.Figure 2Ashows the averaged HIV-1 assembly traces of 58 individual assembly sites from 5 different cells recorded in the eGFP channel. Averaged signals recorded in parallel at the identi-cal positions in the mCherry channel are shown inFig. 2B, while Fig. 2Cdisplays averaged traces recorded in the red channel at 58 randomly selected nonassembly sites in the same cells. No gradual increase in the Lifeact.mCherry signal over the course of Gag as-sembly was detected. However, transient recruitment of F-actin at various time points with respect to the assembly process would be masked by averaging intensities from numerous individual sites.
on November 7, 2019 by guest
http://jvi.asm.org/
Thus, we also performed manual frame-by-frame inspection of mCherry signal intensities at computationally tracked individual assembly sites (Fig. 2DtoF). In order to account for potential F-actin bursts occurring at early assembly nucleation sites with a number of Gag.eGFP molecules below the detection limit of our approach (32), we included 150 frames (300 s) preceding detect-able Gag.eGFP accumulation at the respective site in these analy-ses.Figure 2DandEshow examples of a prototypical assembly site (yellow circles) and a nonassembly site (red circles), recorded in
the green channel and red channel, respectively.Figure 2Fshows the intensity values recorded at the individual assembly site indi-cated by the yellow circle inFig. 2Dfor Gag.eGFP (green line) and Lifeact.mCherry (yellow line). The red line shows the Lifeact.m-Cherry signal recorded during the same time period at the nonas-sembly site indicated by the red circle inFig. 2D. Inspection of 200 individual tracks for assembly and nonassembly sites did not re-veal any characteristic intensity changes associated with Gag as-sembly: neither a gradual change of mCherry intensity nor tran-1000
2000 3000 4000 5000
0 150 300 450 600
fluorescence [a.u.]
Lifeact.mCherry Gag.eGFP merged
A
B
C
D
E
10:33 15:33 17:33 19:33 21:33 23:33 25:33F
time [s]
1000 2000 3000 4000 5000
1000 2000 3000 4000 5000
0 150 300 450 600 750 900 0 150 300 450 600 750 900
time [s] time [s]
1000 3000 4000 5000 6000
2000
0 150 300 450 600 750 900
fluorescence [a.u.]
time [s] 0
eGFP
eGFP
mCherry
mCherry
assembly site
non-assembly site
FIG 2Live-cell analysis of Lifeact.mCherry intensity changes at HIV-1 assembly sites. HeLa cells were cotransfected with pCHIV/pCHIVeGFPand
pLifeact.m-Cherry. At 20 h p.t., TIR-FM live-cell imaging was performed with a resolution of 0.5 frames/s. Individual HIV-1 assembly sites were tracked as described in Materials and Methods. (A to C) Analysis of mean signal intensity changes over time. Mean values (lines), standard deviations (gray bars), and exponential fit (white) are shown. (A) Mean intensities from exponential assembly phases (58 individual HIV-1 assembly sites from 5 cells, recorded in 5 independent experiments). (B) Mean of the corresponding traces recorded in the red channel (Lifeact.mCherry) for all positions analyzed in panel A. (C) Mean of traces recorded in the red channel at 58 nonassembly sites from the cells analyzed in panel A. (D) Image from live-cell analysis of a representative cell (shown in Movie
S3 in the supplemental material). Examples of an individual assembly site (yellow) and a nonassembly site (red) are indicated by circles. Bar, 10m. (E) Images
from Movie S3 in the supplemental material recorded at the indicated time points (minutes:seconds) in the green and red channels at the assembly site or nonassembly site encircled in panel D, respectively. (F) Signal intensity changes over time recorded at the individual assembly and nonassembly sites site shown in panel E (green, Gag.eGFP at the assembly site; yellow, Lifeact.mCherry at the assembly site; red, Lifeact.mCherry at the nonassembly site).
on November 7, 2019 by guest
http://jvi.asm.org/
[image:5.585.93.495.68.508.2]sient bursts of mCherry differing notably from transient fluctuations of Lifeact.mCherry intensity at random membrane positions were detected at nascent Gag assembly sites. In sum-mary, neither characteristic F-actin distribution patterns in close vicinity of nascent budding sites nor typical transient changes in F-actin distribution over the course of HIV Gag assembly were detected by live-cell imaging under our experimental conditions. Effect of pharmacological interference with actin dynamics on HIV-1 Gag assembly kinetics.Although live-cell imaging did not reveal any apparent differences in spatial or temporal F-actin distribution in the presence of Gag assemblies, these findings did not rule out an influence of F-actin dynamics on assembly kinet-ics. To address this issue, we made use of the fact that live-cell microscopy offers the unique opportunity to analyze virus assem-bly upon short-term treatment with F-actin-interacting drugs while directly monitoring the effect of the drug on F-actin dynam-ics. Latrunculin B (LAT-B), which binds and sequesters G-actin monomers and thereby prevents actin polymerization (33,34), and jasplakinolide, whose binding to actin oligomers and F-actin filaments stabilizes multimeric actin structures (33,35), were em-ployed.
In order to define effective drug concentrations with minimal adverse effects, cytotoxicity of LAT-B and jasplakinolide under the conditions used was assessed by a colorimetric cell proliferation assay (CellTiter 96 AQueous; Promega) (data not shown). Based on these control experiments, final concentrations of 300 nM LAT-B and 200 nM jasplakinolide were chosen for all experi-ments. HeLa cells were cotransfected with plasmids expressing Lifeact.mCherry and HIVeGFPand grown in the absence of
actin-interfering drugs. At 20 h p.t., cells were transferred to imaging buffer and microscopically screened for individual cells represent-ing an early stage of assembly site accumulation. Image acquisi-tion was initiated at a rate of 0.5 frames/s, and LAT-B, jasplakino-lide, or DMSO as a control was added under continuous microscopic observation.
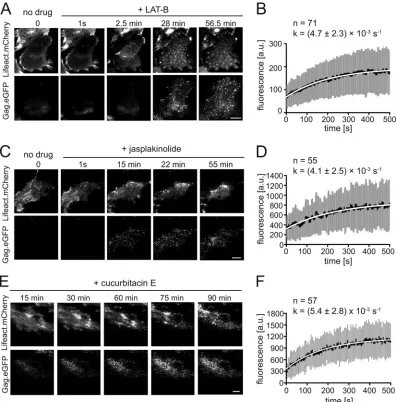
Figure 3AandBand Movie S4 in the supplemental material summarize the results obtained for LAT-B. Typically, within 100 frames (200 s) after drug addition, filamentous actin structures were disrupted and converted into mobile actin clusters moving along the cell membrane with a velocity of⬃2m/min, closely resembling the globular structures detected inDictyosteliumcells following short-term LAT-B treatment (36). These structures gradually disappeared over time (Fig. 3A, top; see also Movie S4 in the supplemental material). Parallel observation of the Gag.eGFP signal in the same cell revealed that assembly sites continued to form after the addition of drug over the whole observation period of 1 h, although filamentous actin structures were efficiently dis-rupted (Fig. 3A, bottom; see also Movie S4 in the supplemental material). Furthermore, we analyzed rates of assembly after drug addition. Akvalue of 0.0047⫾0.0023 s⫺1, not significantly dif-ferent from the value determined for control cells (0.005⫾0.0026 s⫺1[data not shown]), was obtained for 71 averaged exponential assembly phases from 5 individual LAT-B-treated cells (Fig. 3B). Analogous live-cell imaging experiments were performed in the presence of 200 nM jasplakinolide. In this case, live imaging of Lifeact.mCherry at high time resolution allowed us to distinguish different stages of the jasplakinolide effect, dependent on the time after drug treatment. The addition of jasplakinolide to the imag-ing buffer initially resulted in apparent stabilization and thicken-ing of stress fibers (Fig. 3C, top; see also Movie S5 in the
supple-mental material). Approximately 5 min after drug addition, formation of amorphous actin aggregates was observed in the cy-toplasm, accompanied by filament disintegration. Within⬃15 to 25 min of treatment, all visible F-actin had collapsed into a large aggregate near the nucleus, and cells started to detach from the chamber slide. This is in accordance with findings reported previ-ously by Bubb et al. (35). Jasplakinolide stabilizes F-actin fila-mentsin vitro(37) and in live cells, but it also promotes enhanced actin filament nucleation in cells due to stabilization of actin oli-gomers. The latter effect ultimately results in the sequestration of actin in large amorphous polymers, depleting G-actin from the pool available for filament assembly (35).
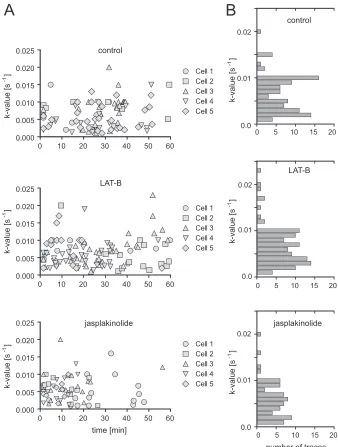
Based on this observation, we divided our analysis of Gag as-sembly kinetics and budding site formation into the two phases defined by the parallel analysis of Lifeact.mCherry, revealing dif-ferential effects on assembly that correlated with the phenotype of the virus-producing cell (Fig. 3C; see also Movie S5 in the supple-mental material). During the phase of apparent actin filament thickening, assembly sites continued to form, with an average as-sembly rate of 0.0041⫾0.0025 s⫺1(Fig. 3D), again similar to the rate determined for control cells. However, whereas new budding sites displaying exponential assembly kinetics appeared through-out the observation period for control and LAT-B-treated cells (Fig. 4A, top and middle), almost no new assembly sites were observed after the first 30 min of jasplakinolide treatment (Fig. 4A, bottom), when most cells had reached the actin aggregation state. Visual analysis of image series form jasplakinolide-treated cells confirmed that new assembly sites were not detected in cells in which the actin cytoskeleton had collapsed.
In order to unmask potential, more subtle effects on assembly rates, we analyzed the distribution of assembly rate constants ob-served, dependent on the time points after jasplakinolide or LAT-B addition. In agreement with our previously reported ob-servations (19), a rather broad range of rate constants was deter-mined when we compared individual sites, but this range did not vary depending on the time point after drug addition (Fig. 4A). The distribution of rate constants determined for individual ex-ponential assembly phases in jasplakinolide-treated cells was sim-ilar to that observed for control or LAT-B-treated cells (Fig. 4B). We conclude that HIV-1 assembly in jasplakinolide-treated cells proceeded with normal rates during the phase of F-actin filament thickening and then ceased completely upon actin network col-lapse. This was supported by analyses of cells treated with cucur-bitacin E, which has been reported to inhibit F-actin depolymer-ization by a different mechanism of action (38). Again, Gag assembly in the early phase of cucurbitacin E treatment proceeded with a similar rate (k⫽0.0054⫾0.0028 s⫺1) as that in control
cells (Fig. 3EandF; see also Movie S6 in the supplemental mate-rial).
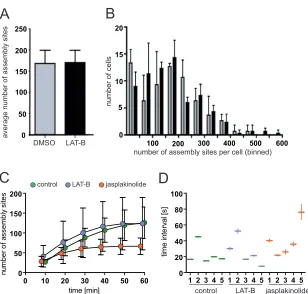
These experiments showed that drug-induced interference with the F-actin network did not result in decreased Gag assembly rates. On the other hand, cortical actin could be envisioned as an obstacle for nascent bud formation. Resolution of dense cortical actin networks by latrunculin might then facilitate Gag access to the plasma membrane, leading to increased budding frequency. Visual inspection of image series indeed suggested an increase in the appearance of new assembly sites upon LAT-B treatment in some cases (see Movie S4 in the supplemental material). To ad-dress this question quantitatively, we analyzed the number of as-sembly sites detected per cell and the rate of new asas-sembly site
on November 7, 2019 by guest
http://jvi.asm.org/
formation in individual cells (Fig. 5). While the total number of assembly sites detected at the plasma membrane varied consider-ably between individual cells, neither the average value (Fig. 5A) nor the variation between individual cells (Fig. 5B) differed signif-icantly between LAT-B-treated and control cells.
Similar results were obtained for comparison of the rates of assembly site initiation measured in live-cell experiments. This
rate was assessed either through the accumulation of assembly sites over time (Fig. 5C) or through calculating the average inter-val between consecutive detections of individual assembly sites (Fig. 5D). In both cases, we observed variation between individual cells under the same experimental conditions, but the evaluations did not reveal any clear difference between control and LAT-B-treated cells. In accordance with the data shown inFig. 4,
accumu-FIG 3Effect of pharmacological interference with actin dynamics on HIV-1 assembly kinetics. HeLa cells were cotransfected with pCHIV/pCHIVeGFPand
pLifeact.mCherry. At 20 h p.t., medium was changed to imaging buffer, and TIR-FM imaging in the green channel and red channels was initiated. (A and B) Disruption of actin filaments by LAT-B. At time zero, a final concentration of 300 nM LAT-B was added to the imaging buffer, and image series were recorded. (A) Images from Movie S4 in the supplemental material are displayed for time zero and for the indicated times after drug addition in the red (top row) or green
(bottom row) channel. Bar, 10m. (B) Average assembly rate determined after LAT-B treatment. Seventy-one individual assembly sites from 5 cells, recorded
in 4 independent experiments, were tracked as described in Materials and Methods. Mean values (black line), standard deviations (gray bars), and a single exponential fit to the average data (white line) are shown. (C and D) Transient stabilization of actin filaments by jasplakinolide. At time zero, a final concentration of 200 nM jasplakinolide was added to the imaging buffer, and TIR-FM observation was continued. (C) Images from Movie S5 in the supplemental material
recorded directly before and at the indicated times after drug addition in the red (top row) or green (bottom row) channel. Bar, 10m. (D) Average assembly rate
determined after jasplakinolide treatment. Fifty-five individual assembly sites from 5 cells, recorded in 5 independent experiments, were tracked as described in Materials and Methods. Mean values (black line), standard deviations (gray bars), and a single exponential fit to the average data (white line) are shown. (E and F) Transient stabilization of actin filaments by cucurbitacin E. At time zero, a final concentration of 200 nM cucurbitacin E (Calbiochem) was added to the imaging buffer, and live imaging was continued (see Movie S6 in the supplemental material). (E) Frames from Movie S6 in the supplemental material recorded
at the indicated times after drug addition in the red (top row) or green (bottom row) channel. Bar, 10m. (F) Average Gag assembly rate in the presence of
cucurbitacin E. A total of 63 individual assembly sites from 3 cells, recorded in 3 independent experiments, were tracked as described in Materials and Methods. Mean values (black line), standard deviations (gray bars), and a single exponential fit to the average (white line) data are shown.
on November 7, 2019 by guest
http://jvi.asm.org/
[image:7.585.94.491.66.468.2]lation of new assembly sites in jasplakinolide-treated cells ceased at⬃30 min after drug addition (Fig. 5C, orange symbols), whereas the interval between consecutive assembly site appearances during the early productive phase was not altered by this compound ei-ther (Fig. 5D).
DISCUSSION
Based on previous reports implicating F-actin in HIV-1 morpho-genesis, we have analyzed actin density, actin recruitment, and the presence of specific F-actin structures at viral budding sites using live-cell TIR-FM. No specific features were detected in the vicinity of nascent assembly sites. Disruption of the F-actin network by
treatment with LAT-B affected neither the rate of budding site initiation nor Gag assembly kinetics at individual sites, while the F-actin network was completely disrupted. Furthermore, addition of the F-actin-stabilizing compound jasplakinolide also had no significant effect on assembly kinetics and the rate of budding site appearance during the early phase, when F-actin filament thick-ening was apparent. Cessation of budding site formation at time points later than 30 min post-drug addition in the case of jas-plakinolide treatment cannot be attributed to the observed dis-ruption of F-actin filaments at this stage, since particles continued to form with normal efficiency upon filament disruption through LAT-B. We thus consider it likely that termination of assembly in time [min]
jasplakinolide
0 10 20 30 40 50 60
0.000 0.005 0.010 0.015 0.020 0.025
0 10 20 30 40 50 60
0.000 0.005 0.010 0.015 0.020 0.025
0 10 20 30 40 50 60
0.000 0.005 0.010 0.015 0.020 0.025
Cell 1 Cell 2 Cell 3 Cell 4 Cell 5
Cell 1 Cell 2 Cell 3 Cell 4 Cell 5
Cell 1 Cell 2 Cell 3 Cell 4 Cell 5 control
LAT-B
k-value [s
]
-1
k-value [s
]
-1
k-value [s
]
-1
0.02
0.01
0.0
0.02
0.01
0.0 0.02
0.01
0.0
k-value [s
]
-1
k-value [s
]
-1
k-value [s
]
-1
number of traces
B
A
jasplakinolide control
LAT-B
5 10 15
0 20
5 10 15
0 20
5 10 15
0 20
FIG 4Variation of Gag assembly rates upon F-actin interference. (A) Variation of assembly rates over time. Assembly rate constants from 5 different cells treated
with DMSO (top) (n⫽92 sites recorded in 5 independent experiments), LAT-B (middle) (n⫽106 sites recorded in 4 independent experiments), or
jasplakinolide (bottom) (n⫽66 sites recorded in 5 independent experiments) were determined from the exponential assembly phase of individual traces and
plotted as a function of time of initial detection of the site. Time zero corresponds to the time point of drug addition. (B) Histogram illustrating the distribution of the number of particles assembling with the respective rates based on the data sets shown in panel A.
on November 7, 2019 by guest
http://jvi.asm.org/
[image:8.585.123.461.66.513.2]the case of jasplakinolide is due to indirect pleiotropic effects upon the complete collapse of the cytoskeleton. Based on these results, we conclude that cortical F-actin is not specifically recruited to HIV-1 budding sites and does not influence the nucleation of assembly sites or the kinetics of assembly in HeLa cells. Our data thus clearly do not support a role of F-actin in HIV-1 Gag mem-brane transport and assembly, which had been inferred from pre-vious studies. Sasaki and coworkers prepre-viously reported complete abrogation of membrane localization and particle production upon treatment of T cells with mycalolide B (14) and a partial block of HIV-1 particle release upon long-term treatment with cytoD (15). Employment of inhibitory drugs for 3 h (the shortest possible time permitting ensemble measurements) performed previously by Jolly et al. (10) revealed no effect of cytoD and a modest effect of LAT-A on bulk Gag release from T cells. Whereas these data were taken as evidence for a role of actin dynamics in Gag membrane transport and particle formation, in our view, the findings taken together rather argue for indirect effects of long-term drug treatment. Although no overt cytotoxicity was observed in those studies, more subtle effects on cell metabolism, protein
expression, energy status, and/or transport pathways may offer an alternative explanation for the observed moderate reductions in particle formation. Consistent with this interpretation, differen-tial effects depending on the time of drug treatment were observed in the case of infectious equine anemia virus (EIAV): whereas prolonged incubation with cytoD reduced the amount of particles released by⬃50%, short-term treatment with either cytoD or LAT-B resulted in an enhancement of bulk particle release by 1.5-to 2-fold (16).
While live-cell imaging methods are also not without caveats, due to the necessity of heterologous labels, specific microscope setups, and extensive image analysis, we believe that our study illustrates an important advantage of a live-cell imaging approach. By directly correlating the effect of drug treatment on F-actin to that on particle assembly in the same individual cell, it was possi-ble to dissect differential effects that would be obscured in ensem-ble measurements. This was particularly apparent in the case of jasplakinolide treatment, where two distinct stages of drug action could be clearly correlated with different effects on Gag assembly. Of note, our bulk toxicity measurements had not shown
pro-250
200
150
100
50
0
20
15
10
5
0
100 200 300 400 500 600
average number of assembly sites
DMSO LAT-B
number of assembly sites per cell (binned)
number of cells
A
B
0 10 20 30 40 50 60 0
50 100 150 200
time [min]
n
u
m
b
e
r o
f a
sse
m
b
ly
si
te
s
1 2 3 4 5 1 2 3 4 5 1 2 3 4 5 0
20 40 60 80 100
ti
m
e
i
n
te
rv
a
l [s
]
control LAT-B jasplakinolide
C
control LAT-B jasplakinolideD
FIG 5Effect of drug treatment on the appearance of assembly sites at the plasma membrane. (A and B) HeLa cells were cotransfected with pCHIV/pCHIVeGFP
and pLifeact.mCherry as described in Materials and Methods. At 12 h p.t., tissue culture medium was replaced by medium containing 0.1% DMSO (gray bars)
or 300 nM LAT-B (black bars) and incubated for 2 h at 37°C in 5% CO2. Cells were fixed with 3% paraformaldehyde, and total numbers of budding sites detected
per cell were quantitated for⬎100 Gag-expressing cells per condition by semiautomated analysis of TIR-FM images as described in Materials and Methods. (A)
Mean values and standard deviations from three independent experiments. (B) Individual cells were stratified according to the numbers of budding sites detected at the membrane. The histogram shows a comparison between DMSO-treated control cells (gray bars) and LAT-B-treated cells (black bars). (C and D)
Formation of new budding sites over time. HeLa cells were cotransfected with pLifeact.mCherry and pCHIV/pCHIVeGFP. At 20 h p.t., TIR-FM imaging was
initiated, and DMSO, LAT-B, or jasplakinolide was added during live-cell recording. Automated detection of individual assembly sites appearing after the time point of drug addition (time zero) was performed as described in Materials and Methods. (C) Number of budding sites per cell detected on images recorded at different time points after drug addition. Mean values and standard deviations from five individual cells per condition are shown (green, control; blue, LAT-B; orange, jasplakinolide). (D) Time intervals between consecutive initiations of individual assembly events. Average intervals were calculated for five cells (1 to 5)
per condition by linear regression analysis from the time points of appearance for all assembly sites traced for a given cell (n⬎330 per condition). The plot shows
average values and 95% confidence intervals for each individual cell.
on November 7, 2019 by guest
http://jvi.asm.org/
[image:9.585.138.446.62.356.2]nounced cytotoxic effects under conditions in which a large pro-portion of cells was severely compromised, as judged by F-actin live-cell imaging. These observations underline the point that data from bulk experiments involving the use of chemical compounds with pleiotropic effects have to be interpreted with caution and indicate live-cell imaging methods as an alternative approach.
We need to point out, however, that whereas imaging of the ventral surface by TIR-FM allows quantitative analyses of new budding site formation and the assembly kinetics of the immature Gag lattice, our experimental system is not well suited for analyses of the subsequent release step. Trapping of viruses in the confined space between the cell membrane and coverslip prevents a clear assignment of the actual membrane scission event. Accordingly, our data do not exclude a role of actin in the actual release of HIV-1 particles. A contribution of F-actin to virion abscission could explain the modest effects of cytoD and/or latrunculin ob-served previously by others on retroviral particle formation in short-time incubation experiments; however, data on HIV-1 sug-gested a negative effect of F-actin disassembly on release (10), while it was reported to have a positive effect in the case of EIAV (16). Again, ensemble measurements have to be interpreted with caution, since particle formation between individual cells in the same culture is asynchronous; bulk material collected may thus represent a mixture of events initiated before and those initiated during the treatment phase. A role of actin in virus release and spread, but not in intracellular transport or assembly of the parti-cle, is not without precedent, as actin dynamics are essential for vaccinia virus transmission while not being relevant for the virus formation process (reviewed in reference39). In the case of mea-sles virus, jasplakinolide treatment was recently reported to spe-cifically affect the step of particle abscission at the plasma mem-brane (40). Investigation of the role of actin dynamics in the HIV-1 membrane abscission event by live-cell imaging, however, is currently prevented by the lack of a suitable microscopic read-out to monitor release events. Obviously, our data do not argue against the previously reported role of F-actin dynamics in retro-viral cell-cell transmission. Work from several laboratories has clearly shown that actin plays a role in the formation of virological synapses and in viral transmission through cell surface surfing, nanotubes, or cytonemes (reviewed in references13,41, and42), while the current study focused on the assembly of individual HIV-1 particles.
Previous cET studies indicated the presence of dense F-actin networks in the vicinity of HIV-1 budding sites and sometimes apparently associated with the budding site (18), and this was confirmed in the companion paper by Stauffer et al. (43). Our live-cell TIR-FM studies do not argue against such structures but suggest that the F-actin density does not detectably differ between budding sites and other regions of the plasma membrane. This is in agreement with the observation made by Stauffer et al. that actin was not enriched in HIV-1 particles compared to the average actin content of the corresponding host cell (43). Furthermore, although we cannot exclude the presence of short, dynamic, and possibly also more latrunculin-resistant actin oligomers (44,45), our studies did not reveal large actin-derived asters at HIV-1 bud-ding sites, as was reported in a previous AFM study (17). This difference cannot be explained at present, but our parallel cET study (43) did not detect a difference in actin association when the NC domain was replaced by a dimerizing leucine zipper, while AFM detection of asters was completely lost in this case (17).
Thus, the relationship between the aster structures uncovered by AFM and the actin networks detected by cET and TIR-FM is cur-rently unclear.
In summary, this work, together with the companion paper by Stauffer et al. (43), indicates that F-actin, F-actin dynamics, as well as the putative actin-binding NC domain of Gag are dispensable for HIV-1 assembly. Neither actin filaments (disrupted by LAT-B) nor actin treadmilling (disrupted by jasplakinolide) is required for HIV-1 Gag transport, for formation of new budding sites, or for assembly of the immature Gag shell.
ACKNOWLEDGMENTS
We are indebted to Maria Anders-O¨ sswein and Anke-Mareil Heuser for
expert technical assistance. We thank Michael Sixt, Martinsried, Ger-many, for plasmid pGFP-Lifeact and Nikolas Herold for providing pLifeact.mCherry. We gratefully acknowledge the distribution of the ImageJ spot detection plug-in by Peter Bankhead, Nikon Imaging Center Heidelberg.
This work was supported in part by the Deutsche Forschungsgemein-schaft through Ph.D. student fellowships to S.A.R. and P.K. (GRK1188) and through collaborative research grant SFB638 (project A9) to H.-G.K. B.M. and H.-G.K. are investigators of the CellNetworks Cluster of Excellence (EXC81).
REFERENCES
1.Sundquist WI, Kräusslich H-G.2012. HIV-1 assembly, budding, and
maturation. Cold Spring Harb. Perspect. Med.2:a006924.http://dx.doi
.org/10.1101/cshperspect.a006924.
2.Stachowiak JC, Brodsky FM, Miller EA.2013. A cost-benefit analysis of
the physical mechanisms of membrane curvature. Nat. Cell Biol.15:1019 –
1027.http://dx.doi.org/10.1038/ncb2832.
3.Anitei M, Hoflack B.2012. Bridging membrane and cytoskeleton
dynam-ics in the secretory and endocytic pathways. Nat. Cell Biol.14:11–19.http:
//dx.doi.org/10.1038/ncb2409.
4.Taylor MP, Koyuncu OO, Enquist LW.2011. Subversion of the actin
cytoskeleton during viral infection. Nat. Rev. Microbiol.9:427– 439.http:
//dx.doi.org/10.1038/nrmicro2574.
5.Chertova E, Chertov O, Coren LV, Roser JD, Trubey CM, Bess JW, Jr, Sowder RC, II, Barsov E, Hood BL, Fisher RJ, Nagashima K, Conrads TP, Veenstra TD, Lifson JD, Ott DE.2006. Proteomic and biochemical analysis of purified human immunodeficiency virus type 1 produced from
infected monocyte-derived macrophages. J. Virol.80:9039 –9052.http:
//dx.doi.org/10.1128/JVI.01013-06.
6.Ott DE, Coren LV, Johnson DG, Kane BP, Sowder RC, II, Kim YD, Fisher RJ, Zhou XZ, Lu KP, Henderson LE.2000. Actin-binding cellular
proteins inside human immunodeficiency virus type 1. Virology266:42–
51.http://dx.doi.org/10.1006/viro.1999.0075.
7.Ott DE, Coren LV, Kane BP, Busch LK, Johnson DG, Sowder RC, II, Chertova EN, Arthur LO, Henderson LE.1996. Cytoskeletal proteins
inside human immunodeficiency virus type 1 virions. J. Virol.70:7734 –
7743.
8.Liu B, Dai R, Tian CJ, Dawson L, Gorelick R, Yu XF.1999. Interaction of the human immunodeficiency virus type 1 nucleocapsid with actin. J.
Virol.73:2901–2908.
9.Wilk T, Gowen B, Fuller SD.1999. Actin associates with the nucleocapsid domain of the human immunodeficiency virus Gag polyprotein. J. Virol.
73:1931–1940.
10. Jolly C, Mitar I, Sattentau QJ.2007. Requirement for an intact T-cell actin and tubulin cytoskeleton for efficient assembly and spread of human
immunodeficiency virus type 1. J. Virol.81:5547–5560.http://dx.doi.org
/10.1128/JVI.01469-06.
11. Jolly C, Sattentau QJ.2004. Retroviral spread by induction of virological
synapses. Traffic5:643– 650.http://dx.doi.org/10.1111/j.1600-0854.2004
.00209.x.
12. Stolp B, Fackler OT.2011. How HIV takes advantage of the cytoskeleton
in entry and replication. Viruses 3:293–311.http://dx.doi.org/10.3390
/v3040293.
13. Sattentau QJ.2010. Cell-to-cell spread of retroviruses. Viruses2:1306 –
1321.http://dx.doi.org/10.3390/v2061306.
on November 7, 2019 by guest
http://jvi.asm.org/
14. Sasaki H, Nakamura M, Ohno T, Matsuda Y, Yuda Y, Nonomura Y.
1995. Myosin-actin interaction plays an important role in human immu-nodeficiency virus type 1 release from host cells. Proc. Natl. Acad. Sci.
U. S. A.92:2026 –2030.http://dx.doi.org/10.1073/pnas.92.6.2026.
15. Sasaki H, Ozaki H, Karaki H, Nonomura Y.2004. Actin filaments play an essential role for transport of nascent HIV-1 proteins in host cells.
Biochem. Biophys. Res. Commun. 316:588 –593. http://dx.doi.org/10
.1016/j.bbrc.2004.02.088.
16. Chen C, Weisz OA, Stolz DB, Watkins SC, Montelaro RC. 2004. Differential effects of actin cytoskeleton dynamics on equine infectious
anemia virus particle production. J. Virol.78:882– 891.http://dx.doi.org
/10.1128/JVI.78.2.882-891.2004.
17. Gladnikoff M, Shimoni E, Gov NS, Rousso I.2009. Retroviral assembly
and budding occur through an actin-driven mechanism. Biophys. J.97:
2419 –2428.http://dx.doi.org/10.1016/j.bpj.2009.08.016.
18. Carlson LA, de Marco A, Oberwinkler H, Habermann A, Briggs JA, Kräusslich H-G, Grünewald K.2010. Cryo electron tomography of native
HIV-1 budding sites. PLoS Pathog.6:e1001173.http://dx.doi.org/10.1371
/journal.ppat.1001173.
19. Ivanchenko S, Godinez WJ, Lampe M, Kräusslich H-G, Eils R, Rohr K, Bräuchle C, Müller B, Lamb DC.2009. Dynamics of HIV-1 assembly and
release. PLoS Pathog.5:e1000652.http://dx.doi.org/10.1371/journal.ppat
.1000652.
20. Müller B, Daecke J, Fackler OT, Dittmar MT, Zentgraf H, Kräusslich
HG.2004. Construction and characterization of a fluorescently labeled
infectious human immunodeficiency virus type 1 derivative. J. Virol.78:
10803–10813.http://dx.doi.org/10.1128/JVI.78.19.10803-10813.2004.
21. Lampe M, Briggs JA, Endress T, Glass B, Riegelsberger S, Kräusslich H-G, Lamb DC, Bräuchle C, Müller B.2007. Double-labelled HIV-1
particles for study of virus-cell interaction. Virology360:92–104.http://dx
.doi.org/10.1016/j.virol.2006.10.005.
22. Riedl J, Crevenna AH, Kessenbrock K, Yu JH, Neukirchen D, Bista M, Bradke F, Jenne D, Holak TA, Werb Z, Sixt M, Wedlich-Soldner R.
2008. Lifeact: a versatile marker to visualize F-actin. Nat. Methods5:605–
607.http://dx.doi.org/10.1038/nmeth.1220.
23. Koch P, Lampe M, Godinez WJ, Müller B, Rohr K, Kräusslich HG, Lehmann MJ.2009. Visualizing fusion of pseudotyped HIV-1 particles in
real time by live cell microscopy. Retrovirology6:84.http://dx.doi.org/10
.1186/1742-4690-6-84.
24. Godinez WJ, Lampe M, Worz S, Müller B, Eils R, Rohr K. 2009. Deterministic and probabilistic approaches for tracking virus particles in time-lapse fluorescence microscopy image sequences. Med. Image Anal.
13:325–342.http://dx.doi.org/10.1016/j.media.2008.12.004.
25. Abraham L, Bankhead P, Pan X, Engel U, Fackler OT.2012. HIV-1 Nef limits communication between linker of activated T cells and SLP-76 to re-duce formation of SLP-76-signaling microclusters following TCR
stimula-tion. J. Immunol. 189:1898 –1910. http://dx.doi.org/10.4049/jimmunol
.1200652.
26. Weichsel J, Herold N, Lehmann MJ, Kräusslich HG, Schwarz US.2010. A quantitative measure for alterations in the actin cytoskeleton
investi-gated with automated high-throughput microscopy. Cytometry A77:52–
63.http://dx.doi.org/10.1002/cyto.a.20818.
27. Jaehne B.1997. Digital image processing. Springer, Berlin, Germany. 28. Weichsel J, Urban E, Small JV, Schwarz US.2012. Reconstructing the
orientation distribution of actin filaments in the lamellipodium of migrat-ing keratocytes from electron microscopy tomography data. Cytometry A
81:496 –507.http://dx.doi.org/10.1002/cyto.a.22050.
29. Baumgärtel V, Ivanchenko S, Dupont A, Sergeev M, Wiseman PW, Kräusslich HG, Bräuchle C, Müller B, Lamb DC.2011. Live-cell
visu-alization of dynamics of HIV budding site interactions with an ESCRT
component. Nat. Cell Biol. 13:469 – 474. http://dx.doi.org/10.1038
/ncb2215.
30. Jouvenet N, Bieniasz PD, Simon SM.2008. Imaging the biogenesis of
individual HIV-1 virions in live cells. Nature454:236 –240.http://dx.doi
.org/10.1038/nature06998.
31. Jouvenet N, Zhadina M, Bieniasz PD, Simon SM.2011. Dynamics of ESCRT protein recruitment during retroviral assembly. Nat. Cell Biol.
13:394 – 401.http://dx.doi.org/10.1038/ncb2207.
32. Jouvenet N, Simon SM, Bieniasz PD.2009. Imaging the interaction of HIV-1 genomes and Gag during assembly of individual viral particles.
Proc. Natl. Acad. Sci. U. S. A.106:19114 –19119.http://dx.doi.org/10.1073
/pnas.0907364106.
33. Spector I, Braet F, Shochet NR, Bubb MR.1999. New anti-actin drugs in the study of the organization and function of the actin cytoskeleton.
Mi-crosc. Res. Tech.47:18 –37.http://dx.doi.org/10.1002/(SICI)1097-0029
(19991001)47:1⬍18::AID-JEMT3⬎3.0.CO;2-E.
34. Morton WM, Ayscough KR, McLaughlin PJ.2000. Latrunculin alters the actin-monomer subunit interface to prevent polymerization. Nat. Cell
Biol.2:376 –378.http://dx.doi.org/10.1038/35014075.
35. Bubb MR, Spector I, Beyer BB, Fosen KM.2000. Effects of jasplakinolide on the kinetics of actin polymerization. An explanation for certain in vivo
observations. J. Biol. Chem. 275:5163–5170.http://dx.doi.org/10.1074
/jbc.275.7.5163.
36. Gerisch G, Bretschneider T, Muller-Taubenberger A, Simmeth E, Ecke M, Diez S, Anderson K.2004. Mobile actin clusters and traveling waves in
cells recovering from actin depolymerization. Biophys. J.87:3493–3503.
http://dx.doi.org/10.1529/biophysj.104.047589.
37. Bubb MR, Senderowicz AM, Sausville EA, Duncan KL, Korn ED.1994. Jasplakinolide, a cytotoxic natural product, induces actin polymerization and competitively inhibits the binding of phalloidin to F-actin. J. Biol.
Chem.269:14869 –14871.
38. Sorensen PM, Iacob RE, Fritzsche M, Engen JR, Brieher WM, Charras G, Eggert US.2012. The natural product cucurbitacin E inhibits
depoly-merization of actin filaments. ACS Chem. Biol.7:1502–1508.http://dx.doi
.org/10.1021/cb300254s.
39. Smith GL, Murphy BJ, Law M.2003. Vaccinia virus motility. Annu. Rev.
Microbiol.57:323–342.http://dx.doi.org/10.1146/annurev.micro.57.030502
.091037.
40. Dietzel E, Kolesnikova L, Maisner A.2013. Actin filaments disruption and stabilization affect measles virus maturation by different mechanisms.
Virol. J.10:249.http://dx.doi.org/10.1186/1743-422X-10-249.
41. Mothes W, Sherer NM, Jin J, Zhong P.2010. Virus cell-to-cell
trans-mission. J. Virol.84:8360 – 8368.http://dx.doi.org/10.1128/JVI.00443-10.
42. Fackler OT, Kräusslich HG.2006. Interactions of human retroviruses
with the host cell cytoskeleton. Curr. Opin. Microbiol.9:409 – 415.http:
//dx.doi.org/10.1016/j.mib.2006.06.010.
43. Stauffer S, Rahman SA, de Marco A, Carlson LA, Glass B, Oberwinkler H, Herold N, Briggs JA, Müller B, Grünewald K, Kräusslich H-G.2014. The nucleocapsid domain of Gag is dispensable for actin incorporation into HIV-1 and for association of viral budding sites with cortical F-actin.
J. Virol.88:7893–7903.http://dx.doi.org/10.1128/JVI.00428-14.
44. Gowrishankar K, Ghosh S, Saha S, Mayor S, C R, Rao M.2012. Active remodeling of cortical actin regulates spatiotemporal organization of cell
surface molecules. Cell 149:1353–1367.http://dx.doi.org/10.1016/j.cell
.2012.05.008.
45. Collins A, Warrington A, Taylor KA, Svitkina T.2011. Structural organi-zation of the actin cytoskeleton at sites of clathrin-mediated endocytosis.
Curr. Biol.21:1167–1175.http://dx.doi.org/10.1016/j.cub.2011.05.048.