Thesis by
Siyang Zheng
In Partial Fulfillment of the Requirements for the Degree of
Doctor of Philosophy
California Institute of Technology Pasadena, California
2007
ii
© 2007
Siyang Zheng
Acknowledgements
There are so many people giving me help and support, which makes this thesis possible and my five years at Caltech an instructive and enjoyable journey.
I would like to thank my advisor, Dr. Yu-Chong Tai, who gave me the opportunity to become a member of Caltech Microfabrication Lab and led me to this wonderful world of micro science and technology. Without his guidance and valuable advice, my goals would not be accomplished in five years. I will always remember his persistence to the underlying fundamental theories, his efficiency for personal time management, and his effective leadership for the lab.
vi
My research is funded by NASA National Space Biomedical Research Institute (NSBRI) through NCC 9-58. I’d like to thank my collaborators of the on-chip blood count project. The progress of the project wouldn’t have gone so smoothly without the knowledge and guidance from Dr. Harvey Kasdan, the chief scientist from Iris Diagnostics, Inc. The efforts of Prof. Chih-Ming Ho, Nancy Li, and Charlotte Kwong from UCLA were indispensable for the success of the project.
I would like to thank my Ph.D. candidacy and defense committee members: Prof. Demetri Psaltis, Prof. Changhuei Yang, Prof. Morteza Gharib at Caltech and Dr. Harvey Kasdan from Iris Diagnostics Inc., for their insightful guidance and suggestions on my Ph.D. research.
Abstract
On-Chip Blood Count
Thesis by
Siyang Zheng
Doctor of Philosophy in Electrical Engineering California Institute of Technology
Blood count is one of the most common medical laboratory tests performed today. It provides information on patient’s oxygen carrying capacity, immune system functionality, and the overall hemapoiesis process for disease diagnosis and drug side-effect monitoring. Traditionally blood count is performed either manually or by conventional automated blood analyzers. With the advance of microfabrication, on-chip blood count has become a target for miniaturization aiming at providing cost-effective, functional, capable point-of-care devices and systems that use less than 100 nL of blood sample and generate measurement results within minutes. The focus of this thesis is on investigation of erythrocyte/leukocyte counting and leukocyte differential, which are the two key components in blood count, in microdevices.
viii
different channels by measuring different parameters. Similarly, in microdevices, it is desirable that erythrocytes and leukocytes can be separated before further analysis. Two types of hydrodynamic separation devices were investigated to continuously separate erythrocytes and leukocytes based on size. The principle of the device exploits the laminar flow in microdevices and design of streamlines which particles follow. Pillar-shaped devices with single geometrical design demonstrate a binary separation profile. With proper design, separation efficiency over 90% can be achieved. Channel-shaped devices, an improved design, can achieve similar separation efficiency with the added benefits of a smaller footprint, fewer requirements on flow control, and easier integration with downstream components.
beads of different diameters were used for validation, while diluted blood samples and leukocyte-rich plasma were used to successfully demonstrate the feasibility.
Table of Contents
List of Figures
... xvList of Tables
... xxiChapter 1 Introduction
... 11.1 Complete blood count... 1
1.1.1 Complete blood count and its clinical significance ... 1
1.1.2 Technology development for blood count ... 5
1.2 BioMEMS for cell analysis ... 8
1.3 Fabrication technologies... 10
1.3.1 Soft lithography ... 10
1.3.2 Integrated parylene technology... 12
1.4 Bibliography ... 17
Chapter 2 Blood Cell Separation
... 292.1 Introduction... 29
2.1.1 Blood cell composition and geometrical characteristics ... 30
2.1.2 Conventional cell separation techniques ... 32
2.1.3 Microscale cell separation ... 33
2.2 Pillar-shaped separator... 36
2.2.1 Principle... 36
2.2.2 Experiment... 38
2.2.2.1 Material ... 38
2.2.2.2 Device design and fabrication... 38
xii
2.2.3 Results and discussion ... 39
2.2.3.1 Device calibration ... 39
2.2.3.2 Human blood cell separation... 43
2.3 Channel-shaped separator... 47
2.3.1 Principle... 47
2.3.2 Simulation... 50
2.3.3 Device design... 53
2.3.4 Fabrication and testing setup ... 58
2.3.4.1 Device fabrication ... 58
2.3.4.2 Material ... 58
2.3.4.3 Device calibration and testing setup ... 59
2.3.5 Results and discussion ... 60
2.4 Conclusions... 68
2.5 Bibliography ... 70
Chapter 3 Electrical Impedance Sensing for Blood Cells
... 773.1 Introduction... 77
3.1.1 Coulter principle ... 77
3.1.2 Cellular model for impedance response ... 81
3.1.3 Problem of double-layer capacitance for microdevices... 82
3.1.4 Previous implementations for micro impedance sensors... 83
3.2 Platinum black electroplated micro impedance sensors ... 84
3.2.1 Principle and model ... 85
3.2.2 Device design and layout... 92
3.2.3 Device fabrication... 93
3.2.5 Platinum black electroplating ... 92
3.2.6 Impedance spactra measurement ... 99
3.2.7 Flow sensing of polystyrene beads ... 105
3.2.8 Flow sensing of human blood cells ... 107
3.3 Inductor-induced resonance impedance sensing... 110
3.3.1 Principle... 110
3.3.2 Device design and layout... 112
3.3.3 Device fabrication... 114
3.3.4 Testing material and setup ... 114
3.3.5 Impedance spectra measurement ... 115
3.3.5.1 Impedance spectra measurement of device I ... 115
3.3.5.2 Impedance spectra measurement of device II ... 120
3.3.6 Study on sensitivity... 123
3.3.7 Flow sensing of polystyrene beads ... 126
3.3.7.1 Flow sensing of polystyrene beads in device I ... 126
3.3.7.2 Flow sensing of polystyrene beads in device II ... 127
3.3.8 Flow sensing of human blood cells ... 128
3.3.8.1 Single-frequency sensing in Device I ... 129
3.3.8.2 Dual-frequency sensing in Device II... 132
3.3.8.3 Tumor cell differentiation using dual-frequency sensing.... 133
3.4 Conclusions... 135
3.5 Bibliography ... 137
Chapter 4 Leukocyte Differential in Undiluted Whole Blood
... 1414.1 Introduction... 141
4.1.1 Methods of leukocyte differential... 142
xiv
4.1.3 Acridine orange and other fluorescent dyes for leukocyte differential
... 147
4.2 Device design and fabrication ... 151
4.3 Material and testing setup... 152
4.3.1 Materials ... 152
4.3.2 Blood sample preparation and handling ... 152
4.3.3 Optical detection system construction ... 153
4.3.4 Optical detection system construction ... 156
4.4 Acridine orange staining study ... 156
4.4.1 Optimal staining concentration... 156
4.4.2 Photobleaching time constant measurement... 159
4.5 System calibration with 5 μm beads ... 161
4.6 Testing with undiluted whole blood ... 163
4.7 Conclusion and on-going work... 168
4.8 Bibliography ... 171
List of Figures
Figure 1-1: PDMS device fabrication process ….. ... 12
Figure 1-2: Chemical structures of parylene N, C, and D ... 13
Figure 1-3: Parylene deposition system and the involved chemical processes ... 16
Figure 1-4: Parylene microfluidic devices... 16
Figure 2-1: Design of pillar-shaped separator... 37
Figure 2-2: Navier-Stokes simulation with velocity field magnitude displayed ... 39
Figure 2-3: Separation of 5 μm (green), 8 μm (clear), and 10 μm (red) beads... 41
Figure 2-4: Statistical analysis of beads separation ... 41
Figure 2-5: Separation profiles under different flow rates... 42
Figure 2-6: Measurement of bead size distribution ... 42
Figure 2-7: Separation function curve ... 43
Figure 2-8: Separation of leukocyte (top) from erythrocyte (bottom)... 44
Figure 2-9: Statistical analysis of separation of blood fraction of concentrated leukocytes ... 45
Figure 2-10: Statistical analysis of separation of diluted whole blood sample... 46
Figure 2-11: Separation profile of stained leukocyte rich plasma ... 47
Figure 2-12: Principle of channeled shaped separation ... 49
Figure 2-13: Simulation study of the effect of side channel length L on critical particle size R... 52
Figure 2-14: Simulation study of the effect of side channel edge distance Δλ on critical particle size R... 52
Figure 2-15: Design of channel-shaped separation device I... 54
Figure 2-16: Design of channel-shaped separation device II... 54
xvi
Figure 2-18: 2D fluidic simulation at the crossing region of side channels of device II.. 57
Figure 2-19: Separation profile of 5 μm and 10 μm polystyrene beads in device I... 61
Figure 2-20: Typical trace of 5 μm fluorescent polystyrene beads in device II... 61
Figure 2-21: Typical trace of 10 μm fluorescent polystyrene beads in device II... 62
Figure 2-22: Separation profile of 5 μm and 10 μm beads in device II... 62
Figure 2-23: Typical trace of erythrocyte in device II as pointed by arrow... 64
Figure 2-24: Typical trace of leukocyte in device II... 65
Figure 2-25: Separation profile of erythrocytes and leukocytes in leukocyte-rich plasma ... 65
Figure 3-1: Conventional automated hemacytometers ... 79
Figure 3-2: Principle of Coulter counter... 79
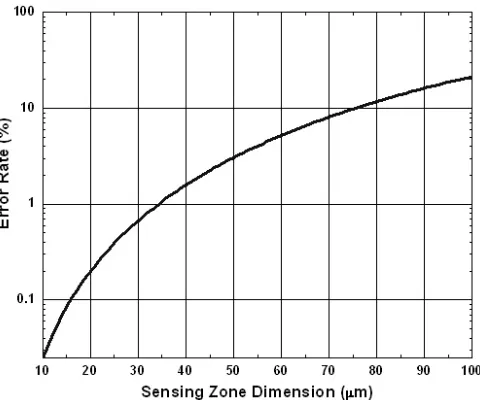
Figure 3-3: Relationship of channel resistance change to channel radius and particle diameter... 80
Figure 3-4: The relation between error rate and sensing zone dimension ... 81
Figure 3-5: System model of platinum black electroplated impedance sensor ... 86
Figure 3-6: Asymptotic behaviors of platinum black electroplated impedance sensors in Nyquist plot... 88
Figure 3-7: Bode plot of numerical simulation of impedance magnitude spectra of platinum black electroplated impedance sensor device I... 91
Figure 3-8: Bode plot of numerical simulation of impedance phase spectra of platinum black electroplated impedance sensor device I ... 91
Figure 3-9: Fabricated platinum black electroplated impedance sensor device I... 92
Figure 3-10: Design layout of platinum black electroplated impedance sensor device II 93 Figure 3-11: Fabrication process flow for platinum black electroplated impedance sensor device I ... 94
Figure 3-13: Assembled platinum black electroplated impedance sensor device I with jig ... 97 Figure 3-14: SEM pictures of platinum black electroplated electrodes... 98 Figure 3-15: AFM images of platinum electrode before electroplating (A) and after
electroplating (B) of device II ... 99 Figure 3-16: Bode plot of measured impedance magnitude response in different
environments of platinum black electroplated impedance sensor I ... 100 Figure 3-17: Bode plot of measured impedance phase response of platinum black
electroplated impedance sensor I ... 100 Figure 3-18: Nyquist plot of platinum black electroplated impedance sensor device I.. 102 Figure 3-19: Bode plot of simulated and measured system impedance magnitude (solid
lines) and phase (dash lines) response in electrolyte phosphate buffered saline (PBS) of platinum black electroplated impedance sensor device II
... 103 Figure 3-20: Nyquist plot of measured impedance data of platinum black electroplated
impedance sensor device II ... 104 Figure 3-21: Time trace of 8 μm beads tested at 10 kHz in platinum black electroplated
impedance sensor device II ... 106 Figure 3-22: A typical example peak of 8 μm beads tested at 10 kHz in platinum black
electroplated impedance sensor device II ... 106 Figure 3-23: Sensing signal depends on the size of polystyrene beads in platinum black
electroplated impedance sensor device II ... 107 Figure 3-24: Time trace of diluted human whole blood in platinum black electroplated
impedance sensor device II ... 108 Figure 3-25: Sensing cells from diluted human whole blood in platinum black
xviii
to erythrocyte ratio is about one to a thousand ... 109 Figure 3-27: Pulse height distribution of leukocyte rich plasma, in which leukocyte to
erythrocyte ratio is about one to ten... 109 Figure 3-28: System model of inductor-induced resonance impedance sensor...111 Figure 3-29: Design layout of inductor-induced resonance impedance sensor device I 113 Figure 3-30: Device design and fabricated device of inductor-induced resonance
impedance sensor device II ... 113 Figure 3-31: Bode plots of measured system impedance responses in different
environments and with various inductance values of inductor-induced resonance impedance sensor device I ... 117 Figure 3-32: Bode plot of simulated impedance response with various inductance values
of inductor-induced resonance impedance sensor device I... 117 Figure 3-33: Simulation and measurements for (A) resonance frequency and (B)
impedance magnitude at resonance frequency of inductor-induced resonance impedance sensor device I ... 120 Figure 3-34: Measured impedance magnitude (left axis and solid lines) and phase (right
axis and dotted lines) spectra of inductor-induced resonance impedance sensor device II without inductor connected and filled with air, DI water, and electrolyte PBS, as well as device in PBS with inductors of various values connected ... 121 Figure 3-35: Simulated impedance magnitude (left axis and solid lines) and phase (right
axis and dotted lines) spectra of inductor-induced resonance impedance sensor device II without inductor and with inductors of various values connected... 122 Figure 3-36: Simulation and measurements for (A) resonance frequency and (B)
Figure 3-37: Sensitivity study on inductor-induced resonance impedance sensor of device I ... 124 Figure 3-38: Sensitivity study on inductor-induced resonance impedance sensor of device
II... 125 Figure 3-39: Flow sensing of polystyrene beads in inductor-induced resonance impedance
sensor device I... 127 Figure 3-40: Testing with 5 μm and 10 μm polystyrene beads mixture in 20μm channel
dimension in inductor-induced resonance impedance sensor device II... 128 Figure 3-41: Time traces of flow sensing of human blood cells in inductor-induced
resonance impedance sensor device I ... 129 Figure 3-42: Impedance magnitude change with the particle volume... 130 Figure 3-43: Pulse height distribution of diluted human whole blood in inductor-induced
resonance impedance sensor device I ... 131 Figure 3-44: Pulse height distribution of leukocyte-rich plasma in inductor-induced
resonance impedance sensor device I ... 132 Figure 3-45: Scatter plots of testing with 200 times diluted human whole blood (A) and
1:1 diluted leukocyte-rich plasma (B) in 15 μm channel dimension inductor-induced resonance impedance sensor device I... 133 Figure 3-46: Scatter plots of testing with tumor cells spiked in diluted blood ... 134 Figure 4-1: Acridine orange molecular structure (top) and leukocyte staining results with
it (bottom) ... 150 Figure 4-2: Top view of the fabricated device ... 152 Figure 4-3: Optical system setup ... 156 Figure 4-4: Study the optimal acridine orange concentration of leukocyte staining in
xx
filter... 162 Figure 4-7: Histogram of centroids of bead images from CCD camera ... 162 Figure 4-8: 5 μm fluorescent beads detection with photodiode detector with long pass
emission filter. ... 163 Figure 4-9: Images extracted from video taken by CCD camera with long pass emission
filter ... 164 Figure 4-10: Time trace of amplified photodiode signal of acridine orange stained
undiluted whole blood with green emission filter centered at 525 nm... 165 Figure 4-11: Histogram of signal intensity from photodiode detector with green emission
filter centered at 525 nm... 166 Figure 4-12: Histogram of signal intensity from photodiode detector with red emission
filter centered at 650 nm... 167 Figure 4-13: (A) System based on modified microscope. (Courtesy Iris International, Inc.)
List of Tables
Table 1-1: Complete blood count and the normal ranges ... 3
Table 1-2: Leukocyte differential and the normal ranges ... 3
Table 1-3: Properties for parylene N, C, D, HT, and PDMS ... 14
Table 2-1: Comparison of human erythrocytes, leukocytes and platelets ... 31
Table 2-2: Components and size of human leukocytes... 31
Table 2-3: Design parameters and predicted critical particle sizes for device II ... 56
Table 3-1: Parameters obtained by fitting Nyquist plots to asymptotes of platinum black electroplated impedance sensor device II... 104
C
HAPTER
1
INTRODUCTION
1.1
Complete blood count
1.1.1 Complete blood count and its clinical significance
2
Table 1-1 Complete blood count and the normal ranges
WBC 4,500 to 11,000 /μL
Differential white cell count See Table 2
RBC 4.0 to 6.2 million /μL
Hematocrit
Women 35% to 47%
Men 8 to 64 yr 39% to 50%
Men 65 to 74 yr 37% to 51%
Hemoglobin concentration
Women 12 to 16 g/dL
Men 14 to 18 g/dL
RBC indices
Mean corpuscular volume (MCV) 82 to 93 μm3 Mean corpuscular Hgb (MCH) 26 to 34 pg Mean corpuscular Hgb concentration (MCHC) 31% to 38%
Platelet count 150,000 to 400,000 /μL
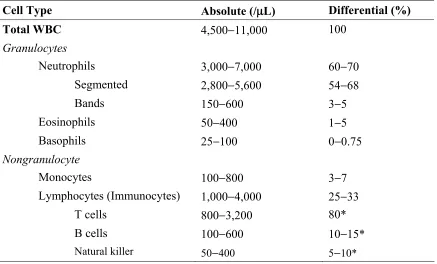
Table 1-2 Leukocyte differential and the normal ranges
Cell Type Absolute (/μL) Differential (%)
Total WBC 4,500−11,000 100
Granulocytes
Neutrophils 3,000−7,000 60−70
Segmented 2,800−5,600 54−68
Bands 150−600 3−5
Eosinophils 50−400 1−5
Basophils 25−100 0−0.75
Nongranulocyte
Monocytes 100−800 3−7
Lymphocytes (Immunocytes) 1,000−4,000 25−33
T cells 800−3,200 80*
B cells 100−600 10−15*
Natural killer 50−400 5−10*
[image:25.612.111.548.432.696.2]4
It turns out that the wealth of data provided by the CBC is extremely useful in diagnosing the presence, severity, and/or type of the following: anemia, certain cancers, infection, acute hemorrhagic states, various allergies, immunodeficiency, and certain drugs that cause blood dyscrasias [4]. The following sections go into more detail about how CBC data, specifically from leukocyte differential tests, is used to assist in the diagnoses of previously mentioned conditions.
Abnormal leukocyte (WBC) differential results are indicatives of disease processes and toxic challenges to the body [4−6]. Leukocyte abnormalities can be broadly classified into five categories: neutrophilia, eosinophilia, basophilia, monocytosis, and lymphocytosis.
a shift to the right can be considered a result of tissue damage or necrosis, whereas a shift to the left can be considered a result of an overwhelming infection.
Eosinophilia is an increase in the eosinophil count. Eosinophilia has been found to increase in the presence of parasitic infections, bronchoallergic reactions (i.e., asthma), allergic rhinitis, hay fever, and skin rashes.
Basophila is an increase in the basophil count. It is also the most uncommon cause of an elevated WBC count. Basophil increases have been known to occur in some hypersensitivity reactions, excessive radiation exposure, myeloproliferative disorders, (including polycythemia vera), myelofibrosis with myeloid metaplasia, and chronic granulocytic leukemia (CGL).
Monocytosis, as one can probably infer by now, is an increase in the monocyte
count. Monocytosis occurs late during either the acute phase of infection or with chronic infections such as tuberculosis and subacute bacterial endocarditis (SBE).
Lymphocytosis occurs in acute viral infections such as mononucleosis,
cytomegalovirus, measles, mumps, and rubella. Elevated lymphocyte counts will also be noted in patients during with a history of chronic infections and may be noted early in patients carrying the human immunodeficiency virus (HIV) disease. Severely elevated levels are seen in chronic lymphocytic leukemia (CLL).
1.1.2 Technology development for complete blood count
6
Leeuwenhoek in the 17th century. In 1852, Karl Vierordt published the first quantitative results of blood cell analysis based on a tedious and lengthy procedure [8]. Later in the 19th century, the improvement of tissue-staining techniques enabled the first manual blood count by means of a combination of hemacytomers and blood smear. Eosin was the first of these tissue-staining dyes discovered in 1856, followed by hematoxylin (discovered in 1865), and later by the metachromatic Romanowsky dyes. Amazingly, modern manual blood count methods are not significantly different from those used over a century ago and those are still the traditional reference method used for calibration of automated blood analyzers. Belonging to the Romanowsky dye family, Wright or Wright-Giemsa staining is the dye most commonly used for blood smear in North America, while May-Grunwald-Giemsa type staining is more popular in Europe and elsewhere [6].
8
methods have been proposed as a new reference method for blood count to replace the error-prone and statistically insufficient manual blood count reference method [19, 20].
1.2 BioMEMS for cell analysis
BioMEMS (Bio Micro Electro-Mechanical Systems) is a subset of MEMS technology, which generally refers to devices that have at least one dimension in the range of ~100 nm to 200 μm [21]. Concisely stated, BioMEMS is the application of MEMS fabrication technology to biological and biomedical fields. The origins of the field lie in microfabricated devices for molecular analysis, e.g., capillary electrophoresis (CE), gas-phase chromatography (GPC), and high-pressure liquid chromatography (HPLC) [22]. After the mid-1990s, polymer plastics, especially poly(dimethylsiloxane) (PDMS), replaced silicon and glass as the most popular materials. Fundamental and unique flow properties in microdomains, such as laminar flow without turbulence [23, 24] and electro-osmotic driven plugged flow [25], have been exploited. Just as integrated circuits have basic building blocks such as resistors, capacitors, and transistors, an analogous set of components, such as valves [26], pumps [27, 28], and mixers[29−31], have been demonstrated for microfluidic systems. Application of bioMEMS systems to resolve problems has emerged in areas such as screening conditions for protein crystallization [32, 33], high-throughput screening in drug development [34, 35], single cell manipulation and analysis [36−39], single molecule analysis [40, 41], and microreactor chemical synthesis [42, 43].
population can be studied with single cell analysis. These new tools create new opportunities for research areas, such as cell biology, developmental biology, and tissue engineering.
10
1.3 Fabrication
technologies
In this subsection, two microfabrication technologies used in later chapters are introduced. One is soft lithography. The other is integrated parylene technology.
1.3.1 Soft lithography
Soft lithography is a set of non-photolithographic microfabrication techniques that use a patterned elastomer as the stamp, mold, or mask (rather than a rigid photomask) to generate micropatterns and microstructures [70]. The pattern transfer process generally contains three steps: (1) fabricating a patterned master, (2) molding the master to generate a patterned stamp, (3) generating a replica of the original template in a functional material by applying the stamp [71]. Soft lithography can be categorized into replica molding, embossing, and microcontact printing. The fabrication technique used in this thesis is replica molding, which refers to transferring topographical features from a rigid or elastomeric mold into another material by solidifying a liquid in contact with the original pattern.
modulus of 1.8 MPa and elongation up to ~ 160%), and gas permeable. PDMS is considered to be a suitable reference material for the evaluation of the in vitro and in vivo biocompatibility of biomaterials [72]. The gas permeable property of PDMS makes it a desirable material for applications where gas transport is preferred (e.g., on-chip cell culture).
12
Figure 1-1 PDMS device fabrication process
The relative ease of processing, biocompatibility, low material and fabrication cost, and the previously enumerated properties of PDMS have made the PDMS-based soft lithography the most widely used fabrication technology in bioMEMS so far. Useful microfluidic components, such as pneumatic valves and pumps, can be integrated easily and reliably, which makes PDMS the key material for exploratory research [75]. Large scale fluidics integration has been demonstrated [76, 77].
1.3.2 Integrated parylene technology
number of applications for parylene has grown dramatically in electronics, medical devices, the automobile industry, and the military.
CH2 CH2 Cl
n CH2 CH2
Cl
n Parylene C
CH2 CH2 Cl
n Cl
CH2 CH2 Cl
n Cl
Parylene D CH2 CH2
n CH2 CH2
n Parylene N
Figure 1-2 Chemical structures of parylene N, C, and D
14
parylene is biocompatible (USP Class VI), which makes it one of the few materials best suited for long-term human implants. Parylene thin films are deposited using a room-temperature CVD process which makes parylene deposition a post-CMOS compatible process. Parylene thin films can be processed by conventional lithography processes and oxygen plasma etching in RIE (reactive ion etching) instrument. The newest commercially available parylene, parylene HT from Specialty Coating Systems (SCS), provides the highest temperature and UV stability and lowest dielectric and friction coefficients.
Table 1-3 Properties for parylene N, C, D, HT, and PDMS [79, 80].
Property Parylene-N Parylene-C Parylene-D Parylene HT PDMS [80]
Dielectric Strength
(V/mil), 1 mil film 7,000 5,600 5,500 5,400 610 [81] (1 mm film) Dielectric Constant 60 Hz 1 kHz 1 MHz 2.65 2.65 2.65 3.15 3.10 2.95 2.84 2.82 2.80 2.21 2.20 2.17
2.3−2.8
Young’s Modulus (psi) 350,000 400,000 380,000 ⎯ 52–126 Index of Refraction 1.661 1.639 1.669 ⎯ 1.4 Yield Strength (psi) 6,100 8,000 9,000 ⎯ 325 Elongation to Break (%) 20−250 200 10 ⎯ 210–310 [81] Coefficient of Friction
Static
Dynamic 0.25 0.25 0.29 0.29 0.33 0.31 0.145 0.130 0.43−0.51 [82] ⎯ Density (g/cm3)
1.10−1.12 1.289 1.418 ⎯ 9.7*10-4
Melting Point (℃) 420 290 380 > 450 -49.9–40
Thermal Conductivity at 25 ℃
(10-4 cal/(cm*s*℃))
3.0 2.0 ⎯ ⎯ 3.6
Specific Heat at 20 ℃ (cal/g*℃)
Fig. 1-3 shows the parylene deposition procedures, the involved chemical processes, and the instrument. The process includes vaporization, pyrolysis, and deposition. Beginning with the stable granular parylene dimmer (di-para-xylylene), the material is vaporized under vacuum (8−10 mTorr) and heated to 170 ℃ to form dimeric gas. The gas is then pyrolized to cleave the dimer to its monomeric form at 690 ℃. In the room-temperature deposition chamber, the monomer gas deposits on all exposed surfaces as a transparent polymer film (poly-para-xylylene). Although parylene N structure is used in Fig. 1-3, the deposition process is almost identical for all three common types of parylene, except for some slight differences in pyrolysis temperature and deposition pressure. The thickness of the parylene coating is controlled by the amount of the dimer used. Typical parylene coating thicknesses in a single deposition ranges from 0.1 to 20 μm. The normal deposition rate of parylene C under a deposition vapor pressure of 23 mTorr is about 5 μm per hour. The deposition rate is directly proportional to the square of the monomer concentration in the chamber and inversely proportional to the absolute temperature of the substrate on which parylene will be coated [83].
16
successfully demonstrated (Fig. 1-4) [84−89]. The bio-compatibility of parylene makes it a perfect material for implantable or bioprocessing devices [90].
CH2 CH2 n
Di-para-xylylene (Dimer)
para-xylylene (Monomer)
Poly(para-xylylene) (Polymer)
CH2 CH2 CH2 CH2 CH2 CH2
CH2 CH2
(a)
(c) (b)
(a) Vaporizer:170oC
(b) Pyrolysis: 690oC
(c)Deposition 25 0C
Cold Trap -70oC
Vacuum Pump
Figure 1-3 Parylene deposition system and the involved chemical processes
1.4 Bibliography
[1] "Blood," in Encyclopedia Britannica. Chicago: Encyclopedia Britannica, 1973. [2] C. Starr and R. Taggart, Biology: The Unity and Diversity of Life, 10th ed.
California: Brooks Cole, 2003.
[3] A. L. Komaroff, Harvard Medical School Family Health Guide, 1st ed.. Free Press, 1999.
[4] B. George-Gay and K. Parker, "Understanding the complete blood count with differential," Journal Of PeriAnesthesia Nursing, vol. 18, pp. 96−117, 2003. [5] S. B. McKenzie, Clinical Laboratory Hematology. Prentice Hall, 2004. [6] B. Houwen, "The differential cell count," Laboratory Hematology, vol. 7, pp.
89−100, 2001.
[7] M. M. Wintrobe, Blood, pure and eloquent: a story of discovery, of people, and of
ideas. New York: McGraw-Hill, 1980.
[8] K. Vierordt, "Zahlungen der blutkorperchen des menschen," Arch Physiol Heilk, vol. 11, 327, 1852.
[9] G. Mahouy, P. R. Lund, S. Chinn, and R. D. Barnes, "The use of automated image analysis in differential white cell counting," Scandinavian Journal Of
Haematology, vol. 10, pp. 315−318., 1973.
18
[11] H. M. Shapiro and N. G. Perlmutter, "Personal cytometers: Slow flow or no flow?" Cytometry Part A, vol. 69A, pp. 620−630, 2006.
[12] P. J. Crossland-Taylor, "A device for counting small particles suspended in fluid through a tube," Nature, vol. 171, 37, 1953.
[13] H. M. Shapiro, Practical flow cytometry, 4th ed. Hoboken, New Jersey: John Wiley & Sons, Inc., 2003.
[14] C. L. Johnston, "Leukocyte screening using the ELT-800WS," Blood Cells, vol. 11, pp. 241−255, 1985.
[15] C. J. Cox, T. M. Habermann, B. A. Payne, G. G. Klee, and R. V. Pierre,
"Evaluation of the Coulter counter model S-Plus IV," American Journal Clinical Pathology, vol. 84, pp. 297−306, 1985.
[16] W. Burgi and H. R. Marti, "Automated blood count analysis by trimodal size distribution with the Sysmex E-5000," Journal Of Clinical Chemistry And Clinical Biochemistry, vol. 27, 365−368, 1989.
[17] A. M. Saunders, "Development of automation of differential leukocyte counts by the use of cytochemistry," Clinical Chemistry, vol. 18, 783−788, 1972.
[18] H. P. Mansberg, A. M. Saunders, and W. Groner, "The Hemalog-D white cell differential system," Journal Of Histochemistry and Cytochemistry, vol. 22, 711−724, 1974.
[20] W. Hubl, G. Wolfbauer, S. Andert, G. Thum, J. Streicher, C. Hubner, A. Lapin, and P. M. Bayer, "Toward a new reference method, for the leukocyte five-part differential," Cytometry, vol. 30, 72−84, 1997.
[21] S. S. Saliterman, Fundamentals of BioMEMS and Medical Microdevices. SPIE, 2006.
[22] G. M. Whitesides, "The origins and the future of microfluidics," Nature, vol. 442, pp. 368−373, 2006.
[23] J. P. Brody, P. Yager, R. E. Goldstein, and R. H. Austin, "Biotechnology at low Reynolds numbers," Biophysical Journal, vol. 71, pp. 3430−3441, 1996.
[24] T. M. Squires and S. R. Quake, "Microfluidics: Fluid physics at the nanoliter scale," Reviews Of Modern Physics, vol. 77, pp. 977−1026, 2005.
[25] J. G. Santiago, "Electroosmotic flows in microchannels with finite inertial and pressure forces," Analytical Chemistry, vol. 73, pp. 2353−2365, 2001.
[26] K. W. Oh and C. H. Ahn, "A review of microvalves," Journal Of Micromechanics And Microengineering, vol. 16, pp. R13−R39, 2006.
[27] D. J. Laser and J. G. Santiago, "A review of micropumps," Journal Of Micromechanics And Microengineering, vol. 14, pp. R35−R64, 2004.
[28] N. T. Nguyen, X. Y. Huang, and T. K. Chuan, "MEMS-micropumps: A review,"
Journal Of Fluids Engineering⎯Transactions Of The ASME, vol. 124, pp. 384−392, 2002.
20
[30] V. Hessel, H. Lowe, and F. Schonfeld, "Micromixers⎯a review on passive and active mixing principles," Chemical Engineering Science, vol. 60, pp. 2479−2501, 2005.
[31] N. T. Nguyen and Z. G. Wu, "Micromixers⎯a review," Journal Of Micromechanics And Microengineering, vol. 15, pp. R1−R16, 2005.
[32] C. L. Hansen, E. Skordalakes, J. M. Berger, and S. R. Quake, "A robust and scalable microfluidic metering method that allows protein crystal growth by free interface diffusion," Proceedings Of The National Academy Of Sciences Of The United States Of America, vol. 99, pp. 16531−16536, 2002.
[33] B. Zheng, J. D. Tice, L. S. Roach, and R. F. Ismagilov, "A droplet-based, composite PDMS/glass capillary microfluidic system for evaluating protein crystallization conditions by microbatch and vapor-diffusion methods with on-chip X-ray diffraction," Angewandte Chemie-International Edition, vol. 43, pp. 2508−2511, 2004.
[34] P. S. Dittrich and A. Manz, "Lab-on-a-chip: microfluidics in drug discovery,"
Nature Reviews Drug Discovery, vol. 5, pp. 210−218, 2006.
[35] J. Pihl, M. Karlsson, and D. T. Chiu, "Microfluidic technologies in drug discovery," Drug Discovery Today, vol. 10, pp. 1377−1383, 2005.
[36] J. Voldman, "Engineered systems for the physical manipulation of single cells,"
Current Opinion In Biotechnology, vol. 17, 532, 2006.
[38] A. R. Wheeler, W. R. Throndset, R. J. Whelan, A. M. Leach, R. N. Zare, Y. H. Liao, K. Farrell, I. D. Manger, and A. Daridon, "Microfluidic device for single-cell analysis," Analytical Chemistry, vol. 75, pp. 3581−3586, 2003.
[39] A. A. Werdich, E. A. Lima, B. Ivanov, I. Ges, M. E. Anderson, J. P. Wikswo, and F. J. Baudenbacher, "A microfluidic device to confine a single cardiac myocyte in a sub-nanoliter volume on planar microelectrodes for extracellular potential recordings," Lab On A Chip, vol. 4, pp. 357−362, 2004.
[40] S. M. Stavis, J. B. Edel, K. T. Samiee, and H. G. Craighead, "Single molecule studies of quantum dot conjugates in a submicrometer fluidic channel," Lab On A Chip, vol. 5, pp. 337−343, 2005.
[41] P. S. Dittrich and A. Manz, "Single-molecule fluorescence detection in
microfluidic channels⎯the Holy Grail in mu TAS?" Analytical And Bioanalytical Chemistry, vol. 382, pp. 1771−1782, 2005.
[42] A. J. deMello, "Control and detection of chemical reactions in microfluidic systems," Nature, vol. 442, pp. 394−402, 2006.
[43] V. Hessel and H. Lowe, "Chemical microprocess engineering: Current trends and issues to be resolved," in Microreactor Technology And Process Intensification,
Acs Symposium Series, vol. 914, pp. 23−46 2005.
[44] J. El-Ali, P. K. Sorger, and K. F. Jensen, "Cells on chips," Nature, vol. 442, pp. 403−411, 2006.
[45] C. E. Sims and N. L. Allbritton, "Analysis of single mammalian cells on-chip,"
22
[46] H. Andersson and A. van den Berg, "Microfluidic devices for cellomics: a review," Sensors And Actuators B⎯Chemical, vol. 92, pp. 315−325, 2003. [47] S. N. Bhatia, M. L. Yarmush, and M. Toner, "Controlling cell interactions by
micropatterning in co-cultures: Hepatocytes and 3T3 fibroblasts," Journal Of Biomedical Materials Research, vol. 34, pp. 189−199, 1997.
[48] A. Sivaraman, J. K. Leach, S. Townsend, T. Iida, B. J. Hogan, D. B. Stolz, R. Fry, L. D. Samson, S. R. Tannenbaum, and L. G. Griffith, "A microscale in vitro physiological model of the liver: Predictive screens for drug metabolism and enzyme induction," Current Drug Metabolism, vol. 6, pp. 569−591, 2005. [49] M. J. Powers, K. Domansky, M. R. Kaazempur-Mofrad, A. Kalezi, A. Capitano,
A. Upadhyaya, P. Kurzawski, K. E. Wack, D. B. Stolz, R. Kamm, and L. G. Griffith, "A microfabricated array bioreactor for perfused 3D liver culture,"
Biotechnology And Bioengineering, vol. 78, pp. 257−269, 2002.
[50] E. Leclerc, B. David, L. Griscom, B. Lepioufle, T. Fujii, P. Layrolle, and C. Legallaisa, "Study of osteoblastic cells in a microfluidic environment,"
Biomaterials, vol. 27, pp. 586−595, 2006.
[51] G. M. Walker, J. Q. Sai, A. Richmond, M. Stremler, C. Y. Chung, and J. P. Wikswo, "Effects of flow and diffusion on chemotaxis studies in a
microfabricated gradient generator," Lab On A Chip, vol. 5, pp. 611−618, 2005. [52] N. L. Jeon, H. Baskaran, S. K. W. Dertinger, G. M. Whitesides, L. Van de Water,
and M. Toner, "Neutrophil chemotaxis in linear and complex gradients of
[53] V. V. Abhyankar, M. A. Lokuta, A. Huttenlocher, and D. J. Beebe, "Characterization of a membrane-based gradient generator for use in cell-signaling studies," Lab On A Chip, vol. 6, pp. 389−393, 2006.
[54] P. J. Lee, P. J. Hung, R. Shaw, L. Jan, and L. P. Lee, "Microfluidic application-specific integrated device for monitoring direct cell-cell communication via gap junctions between individual cell pairs," Applied Physics Letters, vol. 86, 2005. [55] M. S. Yang, C. W. Li, and J. Yang, "Cell docking and on-chip monitoring of
cellular reactions with a controlled concentration gradient on a microfluidic device," Analytical Chemistry, vol. 74, pp. 3991−4001, 2002.
[56] J. El-Ali, S. Gaudet, A. Gunther, P. K. Sorger, and K. F. Jensen, "Cell stimulus and lysis in a microfluidic device with segmented gas-liquid flow," Analytical Chemistry, vol. 77, pp. 3629−3636, 2005.
[57] X. Y. Hu, P. H. Bessette, J. R. Qian, C. D. Meinhart, P. S. Daugherty, and H. T. Soh, "Marker-specific sorting of rare cells using dielectrophoresis," Proceedings Of The National Academy Of Sciences Of The United States Of America, vol. 102, pp. 15757−15761, 2005.
[58] A. Y. Fu, C. Spence, A. Scherer, F. H. Arnold, and S. R. Quake, "A
microfabricated fluorescence-activated cell sorter," Nature Biotechnology, vol. 17, pp. 1109−1111, 1999.
[59] M. M. Wang, E. Tu, D. E. Raymond, J. M. Yang, H. C. Zhang, N. Hagen, B. Dees, E. M. Mercer, A. H. Forster, I. Kariv, P. J. Marchand, and W. F. Butler,
24
[60] A. Revzin, K. Sekine, A. Sin, R. G. Tompkins, and M. Toner, "Development of a microfabricated cytometry platform for characterization and sorting of individual leukocytes," Lab On A Chip, vol. 5, pp. 30−37, 2005.
[61] W. C. Chang, L. P. Lee, and D. Liepmann, "Biomimetic technique for adhesion-based collection and separation of cells in a microfluidic channel," Lab On A Chip, vol. 5, pp. 64−73, 2005.
[62] D. Di Carlo, C. Ionescu-Zanetti, Y. Zhang, P. Hung, and L. P. Lee, "On-chip cell lysis by local hydroxide generation," Lab On A Chip, vol. 5, pp. 171−178, 2005. [63] D. Irimia, R. G. Tompkins, and M. Toner, "Single-cell chemical lysis in
picoliter-scale closed volumes using a microfabricated device," Analytical Chemistry, vol. 76, pp. 6137−6143, 2004.
[64] D. Di Carlo, K. H. Jeong, and L. P. Lee, "Reagentless mechanical cell lysis by nanoscale barbs in microchannels for sample preparation," Lab On A Chip, vol. 3, pp. 287−291, 2003.
[65] F. T. Han, Y. Wang, C. E. Sims, M. Bachman, R. S. Chang, G. P. Li, and N. L. Allbritton, "Fast electrical lysis of cells for capillary electrophoresis," Analytical Chemistry, vol. 75, pp. 3688−3696, 2003.
[66] M. A. Burns, B. N. Johnson, S. N. Brahmasandra, K. Handique, J. R. Webster, M. Krishnan, T. S. Sammarco, P. M. Man, D. Jones, D. Heldsinger, C. H.
Mastrangelo, and D. T. Burke, "An integrated nanoliter DNA analysis device,"
Science, vol. 282, pp. 484−487, 1998.
[67] J. Han and H. G. Craighead, "Separation of long DNA molecules in a
[68] N. Lion, T. C. Rohner, L. Dayon, I. L. Arnaud, E. Damoc, N. Youhnovski, Z. Y. Wu, C. Roussel, J. Josserand, H. Jensen, J. S. Rossier, M. Przybylski, and H. H. Girault, "Microfluidic systems in proteomics," Electrophoresis, vol. 24, pp. 3533−3562, 2003.
[69] T. Vilkner, D. Janasek, and A. Manz, "Micro total analysis systems. Recent developments," Analytical Chemistry, vol. 76, pp. 3373−3385, 2004.
[70] Y. N. Xia and G. M. Whitesides, "Soft lithography," Annual Review Of Materials Science, vol. 28, pp. 153−184, 1998.
[71] B. D. Gates, Q. B. Xu, J. C. Love, D. B. Wolfe, and G. M. Whitesides,
"Unconventional nanofabrication," Annual Review Of Materials Research, vol. 34, pp. 339−372, 2004.
[72] M. C. Belanger and Y. Marois, "Hemocompatibility, biocompatibility, inflammatory and in vivo studies of primary reference materials low-density polyethylene and polydimethylsiloxane: A review," Journal Of Biomedical Materials Research, vol. 58, pp. 467−477, 2001.
[73] M. A. Unger, H. P. Chou, T. Thorsen, A. Scherer, and S. R. Quake, "Monolithic microfabricated valves and pumps by multilayer soft lithography," Science, vol. 288, pp. 113−116, 2000.
[74] F. Abbasi, H. Mirzadeh, and A. A. Katbab, "Modification of polysiloxane polymers for biomedical applications: a review," Polymer International, vol. 50, pp. 1279−1287, 2001.
[75] G. M. Whitesides and A. D. Stroock, "Flexible methods for microfluidics,"
26
[76] T. Thorsen, S. J. Maerkl, and S. R. Quake, "Microfluidic Large-Scale Integration," Science, vol. 298, pp. 580−584, 2002.
[77] F. K. Balagadde, L. C. You, C. L. Hansen, F. H. Arnold, and S. R. Quake, "Long-term monitoring of bacteria undergoing programmed population control in a microchemostat," Science, vol. 309, pp. 137−140, 2005.
[78] http://www.scscoatings.com/parylene_knowledge/history.cfm. Indianapolis, IN, U.S.A: Specialty Coating Systems.
[79] http://www.scscoatings.com/parylene_knowledge/specifications.cfm. Indianapolis, IN, U.S.A: Specialty Coating Systems.
[80] J. E. Mark, Polymer data handbook. New York: Oxford University Press, 1999. [81] J.-H. Lee and W. Y. Ji, "Electrical and Mechanical Properties of Silicone Rubber
for High Voltage Insulation," presented at International Conference on Properties and Applications of Dielectric Materials, Nagoya, Japan, 2003. [82] B. Bhushan and Z. Burton, "Adhesion and friction properties of polymers in
microfluidic devices," Nanotechnology, vol. 16, pp. 467−478, 2005.
[83] Specifications and properties of Parylene, SCS_Parylene. Cookson Electronics: Specialty Coating Systems, 2005.
[84] L. Licklider, X. Q. Wang, A. Desai, Y. C. Tai, and T. D. Lee, "A micromachined chip-based electrospray source for mass spectrometry," Analytical Chemistry, vol. 72, pp. 367−375, 2000.
[85] J. Xie, Y. Miao, J. Shih, Q. He, J. Liu, Y. C. Tai, and T. D. Lee, "An
[86] H. S. Noh, P. J. Hesketh, and G. C. Frye-Mason, "Parylene gas chromatographic column for rapid thermal cycling," Journal of Microelectromechanical Systems, vol. 11, pp. 718−725, 2002.
[87] X. Q. Wang and Y. C. Tai, "Normally closed in-channel micro check valve,"
presented at the 13th IEEE International Conference on Micro Electro
Mechanical Systems (MEMS 2000), Miyazaki, Japan, 2000.
[88] J. Xie, X. Yang, X. Q. Wang, and Y. C. Tai, "Surface micromachined leakage proof parylene check valve," presented at the 14th IEEE International Conference on Micro Electro Mechanical Systems (MEMS 2001), Interlaken, Switzerland, 2001.
[89] J. Xie, J. Shih, and Y. C. Tai, "Integrated surface-micromachined mass flow controller," presented at the 16th IEEE International Conference on Micro
Electro Mechanical Systems (MEMS 2003), Kyoto, Japan, 2003.
[90] D. C. Rodger and Y. C. Tai, "Microelectronic packaging for retinal prostheses,"
C
HAPTER
2
BLOOD CELL SEPARATION
2.1
Introduction
30
impedance sensors from diluted whole blood samples. Leukocytes are counted and differentiated into 3- or 5-parts in another channel by a combination of DC and AC electrical impedance sensing and/or multi-parameter light scattering with hemolyzed blood samples. Sometimes differential lysing is needed to differentiate basophils from the rest of the leukocytes before these basophils are counted in another channel. Often, platelets are counted in one additional channel. Separating the whole blood sample into several subgroups of specific cell types enables the sensitivity of the sensors to be significantly improved because the sensors are designed for one specific type of blood cell, instead of all the blood cells. In this chapter, separation of erythrocytes and leukocytes are studied in microdomain. The goal of this research aims specifically to develop a simple, reusable, continuous separation method using microfluidics for erythrocyte and leukocyte separation without the need for lysing chemicals.
2.1.1 Blood cell composition and geometrical characteristics
the challenge of size-based separation of erythrocytes and leukocytes can come from the size overlap between erythrocytes and the small lymphocytes, which are dominated by T-lymphocytes.
Table 2-1 Comparison of human erythrocytes, leukocytes, and platelets [1, 4−6]
Cell Type Cell Shape Diameter Average (μm)
Diameter Range (μm)
Height (μm)
Count (109/L)
Erythrocytes biconcave disk 8 7−9 1.5−3.0 3.8−5.9×10³
Leukocytes sphere 13 6−20 6−20 4.5−11.0
Platelets irregular ⎯ 2-4 ⎯ 1.5−3×10²
Table 2-2 Components and size of human leukocytes [1, 5, 6]
Leukocyte Type Diameter Range (μm)
Absolute Count (μL)
Percentage (%) Total WBC 6−20 4,500−11,000 100
Lymphocytes
(Immunocytes)† 7−18 1,000−4,000 25−33
T cells 6−9 800−3,200 80*
B cells 9−15 100−600 10−15*
Natural killer ⎯ 50−400 5−10*
Granulocytes 10−18 3,000−7,500 60−75
Neutrophils†
13−18 3,000−7,000 59−70
Segmented 13−17 2,800−5,600 54−68
Band 16−18 150−600 3−5
Eosinophils† 12−15 50−400 1−5
Basophils† 10−14 25−100 0−0.75
Monocytes†
12−20 100−800 3−7
32
2.1.2 Conventional cell separation techniques
Cells can be extremely heterogeneous, and a good example is cells in human blood. Although the majority of cells are erythrocytes, a mixture of leukocytes inside human blood has very important immunological functions [1]. Even rarer inside blood are circulating tumor cells [7, 8] and hematopoietic stem cells [9].
turning off the magnetic field. [14]. Fluorescent activated cell sorting (FACS) is the most widely used technique for cell separation. Target cells are labeled with fluorophore-conjugated antibodies before flowing into a flow cytometer. The flow cytometer sorts the cells electrically and/or mechanically based on the fluorescent signal [2].
2.1.3 Micro scale cell separation
Recently, there are increasing efforts toward cell separation in microscale. Field-flow fractionation is a group of technologies that requires continuous elution. An electric field is placed perpendicular to the fluid flow, which is laminar due to the microscale geometry. Particles are levitated by the field to different stream laminae, and separated due to different flow velocity in the parabolic laminar flow profile. Particles can be differentiated by the nature of the field applied. For example, investigators from Giddings’ group use sedimentation field-flow fractionation to separate erythrocytes in less than five minutes [15, 16]. In another attempt, Gascoyne’s group uses electrorotation to measure cell membrane capacitance of T- and B- lymphocytes, monocytes, and granulocytes [17]. The difference of cell membrane capacitance among these cell types, according to the single-shell dielectric model, enables separation of T- (or B-) lymphocytes from monocytes, T- (or B-) lymphocytes from granulocytes, and monocytes from granulocytes in a dielectrophoretic/gravitational field-flow fractionation device[18]. The same approach also demonstrates separation of cultured human breast cancer MDA-435 cells from normal blood cells [19].
34
erythrocytes and other blood cells is exploited. The most paramagnetic cell in the body is the deoxygenated erythrocyte. The approximate 109 iron atoms carried by hemoglobin protein in each erythrocyte make the cell paramagnetic, unlike other cells in blood. Even in its oxygenated state, the erythrocytes are less diamagnetic than other blood cells. Both diamagnetic capture mode [21, 22] and paramagnetic capture mode [23] have been demonstrated. The other approach is a more general method using antibody conjugated magnetic beads. CD45-covered micro magnetic beads were used to label leukocytes and separate them from blood [24].
Several biomimetic microdevices have been demonstrated for cell separation or enrichment. A unique device based on the intrinsic features of blood flow in the microcirculation, such as plasma skimming and leukocyte margination, was proposed to separate leukocytes directly from whole blood [25]. 34-fold enrichment was achieved. In another study, a whole blood sample is forced to flow in a lattice of channels designed to mimic the capillary channels hydrodynamically. The leukocytes self-fractionate into the different types due to a combination of stretch-activated adhesion of cells with the walls, stochastic sticking probabilities, and hetero-avoidance between granulocytes and lymphocytes [26]. Chang et al. fabricated an array of square or slender offset pillars coated with E-selectin IgG chimera inside microfluidic channels to mimic physiological process of leukocyte recruitment to blood vessel walls. HL-60 and U-937 cells can be enriched or partially separated by interaction with the antibody-coated wall of the device [27].
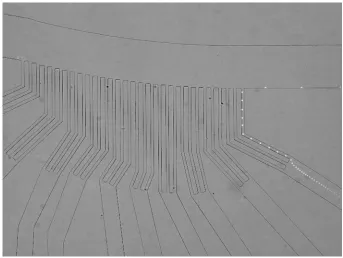
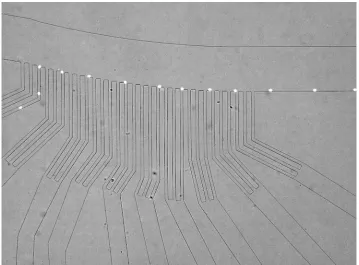
continuously separate particles from medium with high efficiency in microchips assembled by anisotropic etched silicon chamber with glass lid [29]. Separation of erythrocytes from lipid microemboli in whole blood has been reported. In this case, the width of the channel is chosen to correspond to half the ultrasonic wavelength, thereby creating a resonator between the side walls of the flow channel in which a standing wave can be formed. Lipid particles are collected in the pressure antinodes by the side walls and erythrocytes in the pressure node [30, 31].
36
[36−39]. In these devices, particles exit into multiple side branch channels determined by their center positions relative to the streamlines going into the side channels. Beads and cells of different sizes were separated inside the devices. Fluidic resistance calculation was used to calculate the fluidic width inside the main channel that goes into side channel, thus the critical particle sizes.
In the following sections of this chapter, two size-based hydrodynamic separators are presented. The pillar-shaped separator can separate particles with high resolution, while the channel-shaped separator reduces chip footprint significantly and has less requirement for flow control.
2.2 Pillar-shaped
separator
2.2.1 Principle
The device is composed of a separation chamber filled by an array of cylindrical pillars as well as inlets and outlets. Each row of pillars has the same center-to-center distance λ and edge-to-edge distance d, and is staggered by a finite displacement from the previous row Δλ (Fig. 2-1B). Because of small channel dimension (on the order of 10−100 μm) and flow rate (on the order of 0.01−1 μL/min), the Reynolds number (<10-2)
separation lines will flow from the left-hand side of the pillars, while particles at the right-hand side of separation lines will flow from the right-hand side. The critical separation size is defined as twice the minimum distance between the edge of pillar and the nearest division line. For a given geometrical design, there is one corresponding critical separation size.
Figure 2-1 Design of pillar-shaped separator. (A) Device for blood separation. (B)
Detailed device structure with geometrics labeled. (C) A small particle moves in zigzag
mode and a large particle moves in displacement mode with four separation lanes for
Δλ=λ/4.
When the particles are not interacting with walls, it is assumed they will not change the flow pattern and will follow the streamlines. The interactions between particles are also neglected for simplicity of the model. This is a good approximation for blood diluted over ten times, but might not be appropriate for undiluted blood. If the
Δλ= λ/4
1 23 4
Flow
Δλ= λ/4
1 23 4
Flow
C
60 μm λd
4Δλ
A
38
diameter of a particle is smaller than the critical separation size, it can follow a separation lane exactly resulting in a zigzag flow pattern, which follows the net fluid flow direction over a long distance. On the other hand, if the diameter of a particle is larger than the critical separation size, it flows in displacement mode. The particle does not remain in one separation lane all the time, and changes between lanes as it is unable to make sudden turns around pillars. These particles flow diagonally and do not follow the net fluid flow direction.
2.2.2 Experiment
2.2.2.1 Material
PDMS (polydimethylsiloxane) (Sylgard 184) was obtained from Dow Corning, MI, USA. Polystryrene beads were purchased from Duke Scientific Corporations, CA, USA.
2.2.2.2 Device design and fabrication
2.2.2.3 Device simulation
The flow pattern inside the device is simulated by solving a 2D incompressible Navier-Stokes equation with FEMLAB. No-slip boundary conditions are used for the device walls. Also assumed are parabolic velocity field profile at the inlet and zero pressure at the outlet. Fig. 2-2 shows the simulated streamlines for the modeled device. The colors are coded for magnitude of the velocity field. The critical separation size derived by simulation is 7.1 μm.
Figure 2-2 2D Navier-stokes simulation with velocity field magnitude displayed.
2.2.3 Results and discussion
2.2.3.1 Device calibration
40
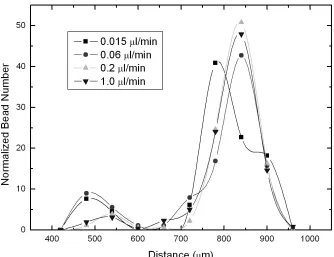
Central flow rate was kept at 0.2 μL/min and sheath flows were 1.2 μL/min. Bead concentrations were on the order of 103 /μL.
All beads 5 μm (green) or 7 μm (red) in diameter followed the “zigzag mode.” In contrast, 10 μm (red) diameter beads followed the “displacement mode.” Finally, the 8
μm diameter (clear) beads did not strictly follow either mode and exited between the 10 μm and 7 μm beads (Figs. 2-3 and 2-4).
Figure 2-3 Separation of 5 μm (green), 8 μm (clear), and 10 μm (red) beads
1
1
1 2
2 3
2 4
1
1
1 2
2 3
2 4
Figure 2-4 Statistical analysis of bead separation. Inset is taken with fluorescent
microscope. Beads with label 1, 2, 3, and 4 are 5 μm, 7 μm, 8 μm, and 10 μm in
42
[image:64.612.121.455.100.357.2]Figure 2-5 Separation profiles under different flow rates
Figure 2-7 Separation function curve
2.2.3.2 Human blood cell separation
44
Diluting blood with Ficoll-Paque Plus enables us to run an experiment over one hour without severe sedimentation.
The use of a hemacytometer yielded a measured leukocyte-to-erythrocyte ratio of 1:43. As shown in Fig. 2-8, two groups of cells following different flow patterns were identified. Statistical analysis concluded that the ratio of cells traveling displacement to those traveling zigzag was 1:38 (Fig. 2-9), very consistent with the leukocyte-to-erythrocyte ratio.
Figure 2-8 Separation of leukocyte (top) from erythrocyte (bottom). Picture was
Figure 2-9 Statistical analysis of separation of blood fraction of concentrated leukocytes.
Left inset is a close up of leukocyte data. Right inset shows one leukocyte (arrow pointed)
among erythrocytes.
46
Figure 2-10 Statistical analysis of separation of diluted whole blood sample. Inset is a
close up of leukocyte data.
Figure 2-11 Separation profile of stained leukocyte rich plasma. Insert is an event of
leukocyte flow through the detection region.
2.3 Channel shaped separator
2.3.1 Principle
48
is illustrated with 2D fluidic simulation of undisturbed streamlines. The flow is from right to left and top to bottom. A stagnation point can be identified, which is normally very close to the downstream vertex of the device wall. At this point, the flow has zero velocity. From this stagnation point, a division line can be drawn that separates the fluid region into two parts. The vertical distance between the division line and device wall at the upstream vertex of the side exit channel defines the critical particle size, R, for separation. The collection zone is defined by the area between the division line and the device walls, including the side channel.
Figure 2-12 Principle of channeled shaped separation. Top drawing shows the T-shape
channel with crossing region labeled by a box. Bottom drawing is a detailed illustration
of the boxed area. Background is 2D fluidic field simulation with color coded
streamlines. The flow is from right to left, top to down. Stagnation point, division line
and collection zone are labeled. Also labeled is the upstream vertex, where the critical
particle size for separation R is defined. Length of side channel L and vertical distance
between downstream and upstream vertices of side channel walls Δλ are shown. Traces
of two particles with radius larger than R (orange color) and smaller than R (green
50
2.3.2 Simulation
The separation is determined by the critical particle size R. Two factors that can be used to control R were studied. The T-shape channel served as our model. The effects were studied by a 2D FEMLAB simulation of the Navier-Stokes equation. Aqueous solution was simulated as flowing inside the device. A parallel velocity profile with maximal velocity of 1 mm/sec was applied at the inlet. Zero pressure was used for outlets. The no-slip condition was assumed at the device walls. If not specified otherwise, 1000 μm was used as the channel length for the inlet channel, the main outlet channel, and side branching channels. 100 μm was used as the channel width for both the inlet and main outlet channel. 10 μm was used as the channel width of the side channels.
First, the effect of the length of side channel L is examined. As the solid line in Fig. 2-13 shows, increasing side channel length decreases critical particle size. This is caused by greater fluidic resistance in the side channel and hence a reduced flow rate in the side channel. For low Reynolds number flow in a long tube, the pressure difference is proportional to flow rate. The ratio of pressure difference and flow rate defines fluidic resistance. In 2D geometry, fluidic resistance can be expressed as
3
1
12
W
R
L
μ
=
the main outlet and side channel, and assuming a parabolic flow profile of the velocity field in the main inlet, the width of fluid in the main inlet channel that went into the side channel was calculated. The result was plotted in Fig. 2-13 as a dash line. The values calculated with the fluidic resistance model were always larger than those obtained by simulation. This is because only at upstream far from the upstream vertex (where the critical particle size was defined) could the parallel velocity profile be assumed. Therefore, the critical particle size calculated by the fluidic resistance model was the distance between the division line and the main channel wall far upstream of the upstream vertex. This was confirmed by simulation. From the simulation, the distance measured between division line and main channel wall far upstream matched well with the results from the fluidic resistance calculation.
52
Figure 2-13 Simulation study of the effect of side channel length L on critical particle
size R. Solid line is 2D Navier-Stokes simulation results. Dash line is critical particle
size calculated from flow resistance model.
.
Figure 2-14 Simulation study of the effect of side channel edge distance Δλ on critical
2.3.3 Device design
Two devices were designed, fabricated, and tested. For device I, only the effect of local geometry change was tested. Side channel length L was kept the same for all side exit channels, and only the vertical distances Δλ of downstream and upstream vertices of side channels were changed. To optimize the device for blood cell separation, in device II, both L and Δλ were changed to achieve a wider range of critical particle sizes.
The devices contained one sample inlet, one buffer inlet, one main outlet, and multiple side channel outlets (Fig. 2-15 and Fig. 2-16). Three side channels with the same local geometry were grouped into one downstream channel. There are eleven groups in device I and ten in device II. After sample flow met buffer flow, the sample flow was squeezed by the buffer flow in the pinch flow region. Relative flow rates were adjusted so that all particles in the sample flow pinched against the main inlet channel wall before they entered the separation region. The pinch flow region was 500 μm long so that the flow was stabilized before it entered the separation region. The separation region consisted of an array of side exit channels perpendicular to the main channel, each with a corresponding critical particle size.
54
Figure 2-15 Design of channel-shaped separation device I
Figure 2-17 Prediction of critical particle sizes for different side channel groups in
device I
To optimize the device for blood cell separation, a device with larger span of critical particle size is desirable. Erythrocytes average 8 μm in diameter and can range from 7 μm to 9 μm. Leukocytes have a wider range from 6 μm to 20 μm. The ratio of erythrocytes to leukocytes in whole human blood is in the magnitude of thousands to one. For device II, from upstream to downstream, Δλ increases from 0 μm to 9 μm in 1 μm increments and the length of the exit channels decreases linearly from 22000 μm to 2200
56
particles of radii from 1 μm to 10 μm. At the upstream vertex, where a particle loses its contact with the device wall, its center position is compared against the division line. The particle might flow into a side channel without interaction with the downstream device wall, as is the case for particles 1 and 2 in Fig. 2-18a. It might collide with the downstream vertex of the device wall as do particles 4 to 10 in Fig. 2-18a or the downstream device wall as do particle 3 in Fig. 2-18a, particles 4 and 5 in Fig. 2-18b and particle 10 in Fig. 2-18c. Depending on its center position relative to the division line, the particle will moved into the main channel or side channel. Particles 4 and 5 in Fig. 2-18b are interesting cases, where the particles collide with the side channel wall but the fluidic drag force moves them up into the main channel.
Table 2-3 Design parameters and predicted critical particle sizes for device II
Side Channel Group
Number Length L (Side Channel μm) Edge Distance (μm) Δλ
Critical Particle Size R (μm)
Figure 2-18 2D fluidic simulation at the crossing region of side channels of device II.
Spherical particles with radii from 1 μm to 10 μm with 1 μm increments were also drawn
to illustrate their trajectories. Each particle is shown twice. One is at the moment when
58
it is closest to the downstream device wall. The direction of the undisturbed velocity field
at the center of the particle is labeled with an arrow. A: side channel number 1, B: side
channel number 6, C: side channel number 10.
2.3.4 Fabrication and testing setup
2.3.4.1 Device fabrication
PDMS was chosen for the device because of its blood compatibility and ease of use. The mold for PDMS was fabricated by Deep Reactive Ion Etching (DRIE) on silicon wafer with photoresist AZ4620 as a mask. The channel height for device I is 40
μm and that of device II is 20 μm. HMDS (1,1,1,3,3,3-hexamethyldisilazane) was used to treat the mold before applying a homogenous mixture of PDMS part A and part B (10:1). PDMS was cured in the mold at 80 ℃ for 25 minutes. Then it was separated from the mold, cut into pieces, and holes were punched on each piece with a Luer stub adapter (gauge 20, Becton Dickinson, NJ, USA). PDMS pieces were then ultrasonically cleaned in acetone for 10 minutes, and rinsed with acetone, then IPA. Finally PDMS pieces were mounted on clean glass slides by overnight baking at 80 ℃.
2.3.4.2 Material
with Wintrobe tubes. One milliliter of bubble-free fresh whole blood was filled into the tube. The tube was laid on flat surface for thirty minutes to an hour. Then it was gradually tilted up to a vertical position. The upper, clear, plasma part was carefully transferred to a clean container.
2.3.4.3 Device calibration and testing setup
Calibration of device I and device II were accomplished with fluorescent polystyrene beads of 5 μm and 10 μm in diameter. Sample flow rate was kept at 0.06
μL