University of Southern Queensland
Faculty of Health, Engineering & Sciences
Non-invasive methods for testing the integrity of bulkheads
and/or deckheads during a fire
A dissertation submitted by
Michael Gall
in fulfilment of the requirements of
ENG4111 and ENG4112 Research Project
towards the degree of
Bachelor of Engineering (Honours) (Mechanical)
Abstract
The project aimed to investigate and evaluate a possible non-invasive test method to
assess the integrity of bulkheads and/or deckheads during a fire. Currently there is not
an accurate method for determining the integrity of a bulkheads and/or deckheads during
a fire on-board a ship. This leads to a higher risk being placed on fire fighters.
A literature review was conducted, following which it was determined that Air
Cou-pled Ultrasonics (ACU) was the most viable non-invasive test method for the project.
Optimisation of the ACU test method was conducted for use under fire conditions.
Alu-minium, GFRP and CFRP plates were placed under fire conditions using a LPG bottle
and burner. The plates underwent ACU testing at 10◦C increments. Results were
eval-uated in relation to suitability for use of the chosen non-invasive test method, impact
of temperature on results and material properties, and structural integrity issues. The
results showed the lamb wave velocity greatly changed as the elastic properties of the
material changed due to the thermal loading on the plates caused by the fire.
Even though the results showed that the lamb wave velocity greatly changed as the
material underwent a significant change in elastic properties, before ACU is suitable
for in-service implementation, further research and development is required. Further
research and development is required into ultrasonic transducer bandwidth, waveform
generator pulse, oscilloscope, depth of penetration and portability to ensure accuracy
University of Southern Queensland
Faculty of Health, Engineering & Sciences
ENG4111/2 Research Project
Limitations of Use
The Council of the University of Southern Queensland, its Faculty of Health, Engineering
& Sciences, and the staff of the University of Southern Queensland, do not accept any
responsibility for the truth, accuracy or completeness of material contained within or
associated with this dissertation.
Persons using all or any part of this material do so at their own risk, and not at the risk of
the Council of the University of Southern Queensland, its Faculty of Health, Engineering
& Sciences or the staff of the University of Southern Queensland.
This dissertation reports an educational exercise and has no purpose or validity
be-yond this exercise. The sole purpose of the course pair entitled “Research Project” is to
contribute to the overall education within the student’s chosen degree program. This
document, the associated hardware, software, drawings, and other material set out in
the associated appendices should not be used for any other purpose: if they are so used,
it is entirely at the risk of the user.
Dean
Certification of Dissertation
I certify that the ideas, designs and experimental work, results, analyses and conclusions
set out in this dissertation are entirely my own effort, except where otherwise indicated
and acknowledged.
I further certify that the work is original and has not been previously submitted for
assessment in any other course or institution, except where specifically stated.
Michael Gall
Acknowledgments
I would like to acknowledge the following people:
John Billingsley for his supervision and guidance.
Ian Raymond for his supervision, guidance and sponsoring the project.
Mathew Ryan for his assistance with experimental testing, circuitry and review and
critique of my report.
Keith Mackie for his review and critique of my report.
To my parents and partner, who have patiently supported me during my studies, in
particular throughout this past year.
Contents
Abstract i
Acknowledgments iv
List of Figures xiv
List of Tables xx
List of Acronyms xxii
List of Nomenclature xxiv
Chapter 1 Introduction 1
1.1 Background . . . 1
1.2 Outline of the Project . . . 2
CONTENTS vii
1.4 Research Objectives . . . 3
1.5 Methodology Summary . . . 4
1.6 Project Contributions . . . 4
1.7 Consequential Effects . . . 5
1.8 Risk Assessment . . . 5
1.9 Project Timeline and Resource Requirements . . . 7
1.9.1 Project Timeline . . . 7
1.9.2 Resource Requirements . . . 7
1.10 Dissertation Outline . . . 7
1.10.1 Chapter 2 - Literature Review . . . 8
1.10.2 Chapter 3 - Methodology . . . 8
1.10.3 Chapter 4 - System Design . . . 8
1.10.4 Chapter 5 - Results and Discussion . . . 9
1.10.5 Chapter 6 - Further Work . . . 9
1.10.6 Chapter 7 - Conclusion and Recommendations . . . 10
Chapter 2 Literature Review 11 2.1 Infrared Thermal Sensing . . . 11
CONTENTS viii
2.3 Acoustic Emission . . . 14
2.4 Ultrasonics . . . 16
2.4.1 Longitudinal Waves . . . 17
2.4.2 Shear Waves . . . 17
2.4.3 Rayleigh Waves . . . 17
2.4.4 Lamb Waves . . . 18
2.4.5 Critique . . . 19
2.5 Low Frequency (Vibration) . . . 20
2.5.1 Global Method . . . 20
2.5.2 Local Method . . . 20
2.5.3 Critique . . . 21
2.6 Dye Penetrant Testing . . . 21
2.7 Magnetic Powder . . . 22
2.8 Radiography . . . 24
2.8.1 X-ray . . . 24
2.8.2 Gamma-ray . . . 24
2.8.3 Neutron Radiography . . . 25
CONTENTS ix
Chapter 3 Methodology 27
3.1 Introduction . . . 27
3.2 Air-Coupled Ultrasonics . . . 30
3.2.1 Acoustic Impedance . . . 31
3.2.2 Transmission Coefficient for a Plate . . . 33
3.2.3 Wave Propagation at Incident in Homogeneous Media . . . 35
3.2.4 Wave Propagation in Non-Homogeneous Media . . . 38
3.2.5 Attenuation . . . 39
3.2.6 Lamb Waves . . . 42
3.2.7 Ultrasonic Velocity and Wavelength with Temperature . . . 43
3.2.8 Doppler Shift . . . 44
3.2.9 Material Properties . . . 45
3.2.10 Material Defects . . . 47
3.3 Aluminium Under Fire . . . 49
3.4 Composites Under Fire . . . 52
Chapter 4 System Design 56 4.1 System Requirements . . . 56
CONTENTS x
4.2.1 Function Generator . . . 58
4.2.2 Ultrasonic Transducer . . . 61
4.2.3 Oscilloscope . . . 64
4.2.4 Piezo Driver . . . 66
4.2.5 Pre-Amplifier . . . 70
4.2.6 Power Source . . . 72
4.3 Bulkhead and Deckhead Materials . . . 77
4.3.1 Aluminium . . . 77
4.3.2 Glass Fibre Reinforced Plastic . . . 78
4.3.3 Carbon Fibre Reinforced Plastic . . . 80
4.4 Fire Simulation . . . 81
4.5 Temperature Reading . . . 84
4.6 Air Coupled Ultrasonics Test Method Schematic . . . 89
Chapter 5 Results and Discussion 94 5.1 Room Temperature Results . . . 94
5.1.1 Aluminium . . . 95
5.1.2 GFRP . . . 98
CONTENTS xi
5.2 Fire Condition Results . . . 103
5.2.1 Aluminium . . . 103
5.2.2 GFRP . . . 113
5.2.3 CFRP . . . 120
5.3 Discussion . . . 127
Chapter 6 Further Work 131 6.1 Air Coupled Ultrasonics Test Method . . . 131
6.1.1 Ultrasonic Transducer . . . 131
6.1.2 Waveform Generator . . . 132
6.1.3 Oscilloscope . . . 132
6.1.4 Depth of Penetration . . . 133
6.2 In-Service Application . . . 133
6.2.1 Distance . . . 133
6.2.2 Feedback . . . 134
Chapter 7 Conclusion and Recommendations 135
References 137
CONTENTS xii
Appendix B Risk Assessment 148
Appendix C Timeline 155
Appendix D Resource Requirements Cost 157
Appendix E Ultrasonic Transducer Data Sheet 162
Appendix F Oscilloscope Certificate of Calibration 167
Appendix G Piezo Driver Data Sheet 172
Appendix H Glass Fibre Data Sheet 179
Appendix I Carbon Fibre Data Sheet 181
Appendix J Epoxy Resin Data Sheet 184
Appendix K Arduino M0 Pro Function Generator Code 193
Appendix L Arduino Zero Function Generator Code 196
Appendix M Temperature Calibration Code 197
Appendix N Temperature Readings Code 202
CONTENTS xiii
List of Figures
2.1 Infrared Sensing NDT (Lappe 2013). . . 12
2.2 Eddy Current NDT (Olympus 2016). . . 13
2.3 Acoustic Emissions NDT (Non Destructive Testing Resource Center 2016). 15
2.4 Rayleigh Wave Mechanical Displacement (David & Cheeke 2012). . . 18
2.5 Lamb Waves (G Alleman & Groves 2014). . . 18
2.6 Global Method Low Frequency NDT (Kapadia n.d.). . . 21
2.7 Fluorescence of Dye Penetrant NDT (International Atomic Energy Agency
1988). . . 22
2.8 Magnetic Particle NDT (International Atomic Energy Agency 1988). . . . 23
2.9 Radiography NDT (Jobs 2013). . . 25
3.1 Air-Coupled Ultrasonic System Block Diagram. . . 31
3.2 Reflection and Transmission at normal incidence for (a) planar interface
LIST OF FIGURES xv
3.3 Transmission Coefficient Aluminium. . . 35
3.4 Transmission Coefficient GFRP at 3km/s. . . 35
3.5 Reflection and Transmission at a liquid-solid interface with incidence (David
& Cheeke 2012). . . 36
3.6 Reflection coefficient of an air-aluminium interface (Chimenti 2014). . . . 37
3.7 Phase velocity dispersion curves for a unidirectional fibre reinforced
com-posite plate parallel to the direction of fibre alignment (Rose 2004). . . 38
3.8 Phase velocity dispersion curves for a unidirectional fibre reinforced
com-posite plate perpendicular to the direction of fibre alignment (Rose 2004). 39
3.9 Lamb Wave Dispersion Curve for Aluminium Plate (Humphries n.d.). . . 42
3.10 Thermal Broadening (University of Colorado 2016). . . 44
3.11 Pulse-Echo Time of Flight Measurement (Non Destructive Testing Database
2000). . . 48
3.12 5083 Thermal Expanison with Temperature (P Summers, Allen, Mouritz,
Case & Lattimer 2015). . . 50
3.13 5083 Young’s Modulus with Temperature (P Summers et al. 2015). . . 50
3.14 5083 Ultimate Tensile Strength with Temperature (P Summers et al. 2015). 51
3.15 5083 Yield Strength with Temperature (P Summers et al. 2015). . . 51
LIST OF FIGURES xvi
3.17 Schematic of fire damage through FRP Composite (Gardiner & Mathys
2002). . . 54
4.1 System Requirements Model. . . 57
4.2 Arduino M0 Pro. . . 59
4.3 Arduino M0 Pro 100 KHz Square Wave. . . 59
4.4 Arduino Zero. . . 60
4.5 Arduino Zero 100 KHz Square Wave. . . 61
4.6 100 KHz Ultrasonic Transducer. . . 62
4.7 100 KHz Directivity in Overall Sensitivity (Multicomp 2010). . . 62
4.8 TDS3054C. . . 65
4.9 MX200 Piezo Driver. . . 66
4.10 50mm Time of Flight. . . 68
4.11 Operational Amplifier Circuit. . . 69
4.12 Operational Amplifier Circuit. . . 70
4.13 Pre-Amplifier Circuit (Silicon Chip Magazine 1994). . . 71
4.14 Pre-Amplifier. . . 72
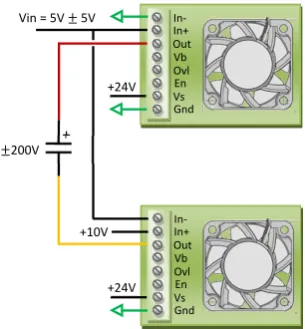
4.15 Dual Power Supply. . . 73
LIST OF FIGURES xvii
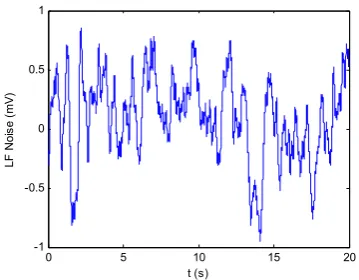
4.17 Dual Power Supply Noise. . . 74
4.18 Voltage Regulator Circuit (Texas Instruments 2013). . . 75
4.19 Voltage Regulator. . . 76
4.20 Battery Supply. . . 77
4.21 Aluminium 5083 H116 Plate. . . 78
4.22 Composite Plates (McConaghy Boats 2016). . . 79
4.23 Fire Triangle (Elite Fire 2013). . . 81
4.24 Burner. . . 83
4.25 Grill. . . 83
4.26 MAX31855 (Adafruit 2016b). . . 85
4.27 Thermocouple Seperation. . . 86
4.28 Temperature Calibration. . . 87
4.29 SHT-31D (Adafruit 2016a). . . 88
4.30 Schematic Diagram of Experimental ACU Set Up. . . 89
4.31 Transmit Air Coupled Ultrasonic Set Up. . . 90
4.32 Receive Air Coupled Ultrasonic Set Up. . . 91
4.33 Air Coupled Ultrasonic Set Up. . . 92
LIST OF FIGURES xviii
4.35 Air Coupled Ultrasonic Set Up with Aluminium Plate. . . 93
5.1 Room Temperature Lamb Wave Response Aluminium. . . 95
5.2 ACU Reflections Model Aluminium. . . 97
5.3 FFT Room Temperature Aluminium. . . 98
5.4 Room Temperature Lamb Wave Response GFRP. . . 98
5.5 FFT Room Temperature GFRP. . . 100
5.6 Room Temperature Lamb Wave Response CFRP. . . 100
5.7 FFT Room Temperature CFRP. . . 102
5.8 Aluminium Testing Under Fire. . . 103
5.9 Aluminium Lamb Wave Response Under Fire 30 to 100◦C. . . 104
5.10 Aluminium Lamb Wave Response Under Fire 110 to 180◦C. . . 105
5.11 Aluminium Lamb Wave Response Under Fire 190 to 260◦C. . . 106
5.12 FFT Aluminium Under Fire. . . 107
5.13 Ambiguity Function Aluminium Under Fire. . . 109
5.14 Aluminium Temperature Readings. . . 111
5.15 Burnt Lamb Wave Response Aluminium. . . 112
5.16 GFRP Testing Under Fire. . . 113
LIST OF FIGURES xix
5.18 GFRP Lamb Wave Response Under Fire 100 to 160◦C. . . 115
5.19 FFT GFRP Under Fire. . . 116
5.20 GFRP Temperature Readings. . . 118
5.21 Burnt Lamb Wave Response GFRP. . . 119
5.22 GFRP Post Fire . . . 119
5.23 CFRP Testing Under Fire. . . 120
5.24 CFRP Lamb Wave Response Under Fire 30 to 90◦C. . . 121
5.25 CFRP Lamb Wave Response Under Fire 100 to 160◦C. . . 122
5.26 FFT CFRP Under Fire. . . 123
5.27 CFRP Temperature Readings. . . 125
5.28 Burnt Lamb Wave Response CFRP. . . 126
List of Tables
3.1 Attenuation in Air. . . 41
4.1 Function Generator Max Frequencies. . . 58
4.2 Oscilloscope Sample Rates. . . 64
4.3 MX200 Maximum Frequency (Hz) with capacitive load (Piezo Drive 2016). 67 4.4 Power Requirements. . . 73
4.5 Aluminium 5083 H116 Thermal Properties (Aerospace Specification Met-als Inc 2016). . . 78
4.6 GFRP Thermal Properties (Colan Australia 2007). . . 80
4.7 CFRP Thermal Properties (AZOM 2003). . . 81
4.8 Flame Colour Temperatures (ELGas 2016). . . 82
4.9 MAX31855 Specifications (Adafruit 2016a). . . 85
LIST OF TABLES xxi
4.11 SHT-31D Specifications (Adafruit 2016a). . . 88
5.1 Aluminium ACU Fire Test Results. . . 110
5.2 GFRP ACU Fire Test Results. . . 117
5.3 CFRP ACU Fire Test Results. . . 124
C.1 Project Timeline. . . 155
D.1 Non-Invasive Test Method Resource Costing. . . 158
D.2 Temperature Evaluation Resource Costing. . . 159
D.3 Test Materials Costing . . . 160
D.4 Fire Resource Costing. . . 160
D.5 Work Health and Safety (WHS) Resources Costing. . . 160
D.6 Miscellaneous Resources Costing. . . 161
List of Acronyms
ACU Air Coupled Ultrasonics.
CFRP Carbon Fibre Reinforced Plastic.
COTE Coefficient of Thermal Expansion.
FRP Fibre Reinforced Plastic.
GFRP Glass Fibre Reinforced Plastic.
HAZ Heat Affected Zone.
LPG Liquefied Petroleum Gas.
N/A Not Available.
OFC Oxygen Free Copper.
Op-Amp Operational Amplifier.
PK-PK Peak to Peak.
PWM Pulse Width Modulation.
List of Acronyms xxiii
TOF Time of Flight.
WHS Work Health and Safety.
List of Nomenclature
Cijk Stiffness Tensor.
CL Load Capacitance.
G Shear Modulus (GPa).
Iav Current Limit.
V /us Voltage SLew Rate (V/us).
VL Longitudinal Velocity (m/s).
VS Shear Velocity (m/s).
VP−P Voltage Peak-Peak (V).
VP L Plate Velocity (m/s).
α Attenuation.
λ Lame’s First Parameter.
λ Wavelength.
ν Poisson’s Ration.
ρ Density (kg/m3).
List of Nomenclature xxv
σ Conductivity (mhom-1).
θ Angle (◦).
εijk Strain Tensor.
◦C Degrees Celcius.
f Frequency (Hz).
dB Desibels.
KHz Kilo Hertz.
mm Millimeters.
mV Millivolts.
pF PicoFarad.
us Microseconds.
Chapter 1
Introduction
1.1
Background
Currently there is not an accurate method for determining the integrity of a bulkheads
and/or deckheads during a fire on-board a ship. When a ship is constructed from
ma-terials such as Aluminium, Glass Fibre Reinforced Plastic (GFRP) and Carbon Fibre
Reinforced Plastic (CFRP), due to their comparatively low temperature resistance this
can be a significant structural integrity risk. Aluminium loses 50% of its original strength
at approximately 200◦C (Beatrice Faggiano 2004). Therefore, at temperatures even
be-low 200◦C, a fire can have a catastrophic effect on the structural integrity of a ship.
Consequently, it is of great importance that a fire on a ship be extinguished particularly
early if damage or harm is to be prevented or minimised.
Measuring the temperature of a bulkhead and/or deckhead using an infra-red sensor
is currently the only analysis technique employed during incidents of fire on a ship.
However, a limitation of an infra-red sensor is that it only provides the temperature
of the material face with which it is physically aimed at. Information on the material
1.2 Outline of the Project 2
As a result, a higher risk being placed on fire fighters as they are required to enter an
environment during an active fire without being able to assess if the bulkhead and/or
deckhead holding the compartment together is structurally sound.
Non-invasive testing is a way to inspect, test or evaluate the properties of a material
without causing damage. The project aimed to investigate and evaluate a possible
non-invasive test method to assess the integrity of bulkheads and/or deckheads during a fire.
1.2
Outline of the Project
The project began with a review of current non-invasive test methods to assess their
advantages and limitations. From the findings of this review the most viable test method
was determined. The most suitable non-invasive test method was investigated further
to allow for optimisation with respect to the project. Research into Aluminium, GFRP
and CFRP material properties and integrity issues under high temperatures and fire
was conducted to optimise the test method design to acquire this information. Through
testing and evaluation this test method was further developed to optimise the results
achieved. The optimised test method design was evaluated for feasibility for in-service
use.
1.3
Problem Outline
The project aimed to investigate and evaluate a non-invasive test method to assess the
integrity of bulkheads and/or deckheads during a fire.
Through testing and evaluation an optimum design configuration of the chosen
non-invasive test method was determined. The material properties and integrity results
1.4 Research Objectives 3
end-user understand the incumbent fire. This optimised design was evaluated for
feasi-bility for in-service use.
1.4
Research Objectives
The research objectives were derived from the Project Specification at Appendix A
• Research non-invasive methods for testing integrity of materials during a fire.
– Covered in Chapter 2.
• Design a potential non-invasive test method to determine integrity of a material.
– Covered in Chapter 3 and 4.
• Test the chosen non-invasive method on Aluminium and GFRP under fire
condi-tions up to 200◦C.
– Covered in Chapter 5.
• Evaluate the results achieved from the chosen non-invasive test.
– Covered in Chapter 5.
• Evaluate the feasibility of this chosen non-invasive test method.
– Covered in Chapter 5.
• As time and resources permit:
– Test the chosen non-invasive method against CFRP and evaluate results.
∗ Covered in Chapter 5.
– Re-design the chosen non-invasive test method to be fully portable and
suit-able for a fire hazardous environment.
1.5 Methodology Summary 4
1.5
Methodology Summary
Due to the large number of non-invasive test methods currently available, a literature
review was undertaken to determine the most suitable test method for the project. From
this review air-coupled ultrasonic testing was selected for further design development.
Aluminium, GFRP and CFRP material properties and integrity issues under high
tem-peratures and fire was investigated to optimise the design configuration for acquiring
this information. This was important to understand, to ensure that the information
ac-quired from the test method is suitable, relevant and most importantly, beneficial to the
end-user.
The results of preliminary testing at room temperature were evaluated, allowing for
further optimisation of the design configuration before testing under fire conditions was
conducted. Aluminium was heated to 260 ◦C and, GFRP and CFRP were heated to
160 ◦C using a gas bottle and burner to simulate fire conditions. The materials underwent
testing at 10◦C temperature increments. The test results were evaluated in relation to:
• suitability of the chosen non-invasive test method;
• impact of temperature on results;
• material properties and integrity issues evaluated;
• suitability of the results to be used as a baseline response at a set temperature; and
• limitations of this non-invasive test method.
1.6
Project Contributions
The anticipated contribution of the project to the literature includes the development of
1.7 Consequential Effects 5
CFRP under fire. The project should also assist in the understanding of the interaction
between a fire and Aluminium, GFRP and CFRP material properties and integrity at
temperature increments.
1.7
Consequential Effects
During a fire on-board a ship there is currently no accurate method of determining the
integrity of a bulkhead and/or deckhead. This leads to a higher risk being placed on
fire fighters. Fire fighters are required to enter an environment without knowing if it is
structurally sound. The aim of the project being to design and evaluate a non-invasive
test method for use during a fire that will evaluate the integrity of a material.
A greater understanding of fire impacts increases the chances of stopping a fire before
it is able to cause irreversible damage to the ship, harm and injury to personnel and
damage to the surrounding ecosystem. By providing vital information on the integrity
of the bulkhead and/or deckhead that is supporting the ships structure, fire fighters will
have an understanding on whether this structure is capable of supporting the load, or
if it is about to fail. This will likely impact their approach to fighting the fire. If the
information that is provided is inaccurate then this will lead to fire fighters entering
an environment that is extremely unsafe which could lead to catastrophic consequences,
including, personal injury or death.
1.8
Risk Assessment
To ensure that the project was undertaken in a safe and appropriate manner for all
parties involved, all hazards must be identified and managed. All hazards identified and
1.8 Risk Assessment 6
From the hazards identified at Appendix B, there were three with a risk level of high or
above. These hazards are detailed below to ensure that the associated risk was
under-stood and an appropriate action plan was in place and continuously reviewed.
The first hazard with a risk level of high associated with the project was Respirable fibres.
Respirable fibres are fibres less than 3 microns in diameter and greater than 5 microns in
length (Department of Justice & Attorney General 2015). Safe Work Australia provides
guidance on the time weighted average of 0.5 fibres per mL of air for respirable fibres
to minimise upper respiratory tract irritation (Safe Work Australia 2012). It was these
fibres that may present a health risk during the experiment. There was a risk of these
fibres becoming airborne from the plates burning at high temperatures. To manage this
high risk, the experiment was undertaken outdoors to ensure adequate ventilation and
the composite plates used in the experiment were undamaged with no exposed frayed
fibres.
The second hazard with a risk level of high associated with the project was fumes and
smoke. As the plate heats up there was a possibility of the plate burning. As the plate
burns it will create smoke and fumes which by breathing in can lead to health issues such
as metal fume fever. Metal fume fever can cause such health issues as malaise, myalgias,
arthralgias, headache and nausea (Royal Australian College of General Practitioners
2012). To manage this high risk, the experiment was undertaken outdoors to ensure
adequate ventilation, diffusion and to minimise possible exposure time.
The third hazard with a risk level of high associated with the project was the use of a
motor vehicle. Use of a motor vehicle was required for the procurement of resources to
undertake the project and travel to and from the experiment location. To manage this
high risk, while using a motor vehicle all road rules were obeyed. Further, the motor
1.9 Project Timeline and Resource Requirements 7
1.9
Project Timeline and Resource Requirements
1.9.1 Project Timeline
To ensure that deadlines were met and progress through the Project Specification was
maintained, a timeline detailing approximate start and completion date for each aspect
was necessary. This timeline is detailed in Appendix C.
1.9.2 Resource Requirements
A number of resources were required to undertake the project. These are broken into the
following categories with the cost breakdown associated detailed in Appendix D:
• Non-invasive test method (Table D.1)
• Temperature Evaluation (Table D.2)
• Test Materials (Table D.3)
• Fire (Table D.4)
• WHS (Table D.5)
• Miscellaneous (Table D.6)
• Calibrated Test Equipment (Table D.7)
Detailed specification and function of the components is provided in Chapter 4.
1.10
Dissertation Outline
1.10 Dissertation Outline 8
1.10.1 Chapter 2 - Literature Review
This chapter provides a comprehensive literature review of non-invasive test methods.
The review highlighted that an ACU non-invasive test method was the most viable
method for the hazardous environment of interest to the project.
1.10.2 Chapter 3 - Methodology
This chapter presents the methodology for the key design aspects of the chosen
non-invasive test method. Further, it outlines the material properties and integrity issues for
Aluminium, GFRP and CFRP under high temperatures and fire conditions.
The key design aspects of ACU were acoustic impedance, transmission coefficient for a
plate, wave propagation at incident in homogeneous media, wave propagation in
non-homogeneous media, attenuation, lamb waves, ultrasonic velocity with temperature,
Doppler shift, material properties and material defects.
A review of material properties under fire showed that the elastic modulus of Aluminium
greatly decreases after 200◦C and for Composite greatly decrease after Glass Transition
Temperature (Tg1).
1.10.3 Chapter 4 - System Design
This chapter details the requirements, components and processes required to achieve the
project specification.
An ACU test method was designed to transmit a pulsed ultrasonic waveform through
the air, impinging on the test material, thereby generating a lamb wave. The ACU test
1.10 Dissertation Outline 9
symmetric and antisymmetric modes of the lamb wave required capture to ensure the
response was able to be fully analysed and provide ample feedback.
1.10.4 Chapter 5 - Results and Discussion
This chapter presents an analysis of the results of testing Aluminium under fire conditions
up to 260◦C and, GFRP and CFRP under fire conditions up to 160◦C at 10◦C increments
using the designed non-invasive test method.
The results showed that ACU utilising commercially available components was suitable
for testing under fire conditions. As the plates undergo thermal loading due to fire
conditions, the elastic properties of the material begin to change as the material moves
away from solid state. This material state change impacts the resulting lamb wave
response. The results also showed there were number of limitations due to design which
required further research.
1.10.5 Chapter 6 - Further Work
This chapter details further work required to ensure that the design is suitable for
in-service applications. It also details other possible testing or design validation
require-ments for further improverequire-ments in the design.
The result showed there were a number of limitations due to design which require further
research. These limitations requiring further work were categorised as either ACU design
1.10 Dissertation Outline 10
1.10.6 Chapter 7 - Conclusion and Recommendations
This chapter summarises the project, analyses the results achieved, compares the results
Chapter 2
Literature Review
This chapter provides a comprehensive literature review of non-invasive test methods.
The review highlighted that an ACU non-invasive test method was the most viable method
for the hazardous environment of interest to the project.
2.1
Infrared Thermal Sensing
Infrared sensors work by reading the infrared energy from the target in its field of view.
As the target gets hotter, more infrared energy is emitted and detected by the infrared
thermometer. There are two types of infrared sensors, first uses a thermopile which
produces an electronic signal based on the temperature of the target. The second type
uses a quantum detector which creates an electronic signal as the detector is struck by
the photon energy radiating from the target (Lappe 2013).
The area for which the temperature is read works off the distance to spot ratio (D:S).
For low end IR sensors the D:S ratio can be as low as 1:1, which compared to high end
2.2 Eddy Current 12
Figure 2.1: Infrared Sensing NDT (Lappe 2013).
To allow the temperature reading of objects from a safe location or through a boundary
an infrared inspection window is installed to allow for the transmission of the infrared
signal. The inspection window allows for a small field of view where temperature readings
are able to be taken from (Robinson 2009).
Oliveira (2004) reported that the presence of inhomogeneities such as holes and cracks
are able to be detected due to the local thermal property changes. Further, Cheng &
Lu (2011) reported the limitations of these sensors in that they can only measure the
surface temperature of the part instead of the state of the entire part.
Due to the limitations of infrared thermal sensing in only providing information at the
time of reading, readings in the sensors direct line of site and limitations on the detection
of flaws and defects, further analysis and development was not feasible for the project.
2.2
Eddy Current
Eddy current testing is the use of an alternating electric current passing through a coil
2.2 Eddy Current 13
material, it induces eddy current flow in the material by electromagnetic induction. This
eddy current flow produces its own magnetic field, which modulates the impedance of
the exciting coil or a secondary coil that is compared to the original coil impedance.
This comparison is measured and analysed for changes in magnitude and phase of the
signal to find flaws, determine conductivity, permeability and dimensions of the material.
This test method is limited to use with conductive materials and near surface defects
(Olympus 2016).
Figure 2.2: Eddy Current NDT (Olympus 2016).
For eddy current testing, the two important parameters that must be controlled are
frequency and probe geometry. The frequency is the key parameter when it comes to
examining surface or sub-surface defects as it determines the depth of penetration. The
depth of penetration is defined as the depth at which the eddy current is 0.37 of its
surface value (Olympus 2016). Olympus (2016) provides the equation for which this is
calculated:
2.3 Acoustic Emission 14
where d is the depth of penetration in m, f is the frequency of the alternating current
in Hz, u is the magnetic permeability in Hm-1 and σ is the electrical conductivity in
mhom-1.
The probe geometry is directly related to the shape of the induced eddy-current path.
For a circular core probe the induced eddy current path in an electrically conducting
isotropic and homogenous material is circular. Larger coils allow for a greater inspection
volume since the magnetic field flows deeper into the test piece, whereas, smaller coils
are more sensitive to small defects (Olympus 2016).
Z Zhang & Zhao (2016) showed that eddy current has been used for the detection of
surface defects in continuous casting slabs up to 1100◦C, with the equipment also being
suitable for operation in these high temperatures.
Summerscales (1990) examined the use of eddy current testing in composites and noted
that it was only suitable in CFRP with a volume fraction of 40% or higher. It was also
noted that eddy current testing is not suitable for GFRP (Summerscales 1990). Due
to testing only being suitable for conductive materials it was not feasible for use in the
project.
2.3
Acoustic Emission
Acoustic emission is the examination of transient elastic waves generated from sudden
redistribution of stress in a material (Oliveira 2004). Acoustic emission provide
informa-tion on the initiainforma-tion and evoluinforma-tion of damage, it is unable to provide quantitative results
about size, depth and overall integrity of a part. Sources of acoustic emissions may be
stress release from crack growth, plastic deformation, dislocation movement, phase
trans-formation and friction mechanisms (Non Destructive Testing Resource Center 2016).
2.3 Acoustic Emission 15
Figure 2.3: Acoustic Emissions NDT (Non Destructive Testing Resource Center 2016).
signals are burst signals that correspond to discrete mechanical events in a material.
Such bursts are random in time and have the aspect of damped sinusoid, with starting
and end points deviating clearly from background noise (Oliveira 2004). Continuous
signals are observed when the acoustic emission activity overlaps and, generally, results
from the combination of electronic noise with the environmental acoustic noise in the
emissions bandwidth (Oliveira 2004).
Joseph Johnson, Zhang, Wu & Jiang (2014) analysed the feasibility of acoustic emissions
for use in high temperatures, they summarised that the limiting factor was the
piezo-electric transducer. Joseph Johnson et al. (2014) utilised a Yttrium Calcium OxyBorate
(YCOB) single crystals piezoelectric transducer which allowed for use in temperatures
up to 1000◦C. Portable acoustic emissions controllers are also available for use in high
temperature environments with the appropriate piezo and cable however they are limited
to only active flaws/defects (Testing & Research 2016).
Acoustic emission is a dynamic process, in that only active events are able to be detected
during the occurrence (Non Destructive Testing Resource Center 2016). The event must
also be of a load which causes an acoustic event, otherwise it will not be detected (Non
Destructive Testing Resource Center 2016). Due to this acoustic emission is not suitable
for the project, as the damage that may have already been caused before testing is done
2.4 Ultrasonics 16
2.4
Ultrasonics
Ultrasonics is the use of sound waves at high energy for material inspection (Resource
Center n.d.). As the ultrasonic wave propagates through the material it is modified
by the boundaries encountered, the material itself and the presence of flaws or defects
(Resource Center n.d.). Ultrasonic inspection is capable of being undertaken through
contact transducers, wave-guided or medium coupled.
Contact and wave-guided transducers are typically in the range of 500 to 20,000 KHz
(International Atomic Energy Agency 1988). The transducer is in direct contact with
the material under inspection allowing for higher frequencies. Through the use of such
high frequencies small and microstructure flaws and defects are able to be detected.
Medium coupled ultrasonics is a non-contact inspection technique which utilises
typi-cally water or less commonly air as a medium for the transfer of an ultrasonic wave
from a transducer to the component. Air-coupled ultrasonics operate in the range of 25
to 1,000 KHz due to the limitation of attenuation in air (Kommareddy 2003).
Water-coupled ultrasonics cannot be applied to water-sensitive or porous materials and is
diffi-cult for in the field applications (Kommareddy 2003).
Ultrasonic inspection is undertaken through either an A-scan, B-scan or C-scan. A-scan
involves the transmittance of a signal from a transducer into the material and receipt
of the signal by another transducer (Non Destructive Testing Resource Center 2016).
A-scan only provides information about the section of material through which the signal
travelled. B-scan involves moving the transducer used for an A-scan in a plane parallel
to the surface. This permits the estimation of the depth or length of a defect along the
axis of transducer movement (Non Destructive Testing Resource Center 2016). C-scan
is the most complex scanning method, in that it conducts a scan of the whole material
reproducing a colour map showing the extent of defects in plan view (Non Destructive
2.4 Ultrasonics 17
2.4.1 Longitudinal Waves
Longitudinal waves are a compressional wave where the particle motion is parallel to
the direction of energy transfer. The velocity is determined by the elastic properties of
the material (David & Cheeke 2012). Longitudinal waves propagate in both liquids and
solids.
VL=
s
C11
ρ (2.2)
2.4.2 Shear Waves
Shear waves are a transverse wave where the particle motion is perpendicular to the
direction of energy transfer (David & Cheeke 2012). Shear waves typically have a velocity
around half of the longitudinal wave velocity in the same material (David & Cheeke 2012).
Shear waves only propagate in solids.
VS =
s
C44
ρ (2.3)
2.4.3 Rayleigh Waves
Rayleigh waves also commonly referred to as surface acoustic waves, are waves confined
to within a wavelength or so of the surface along which they propagate (David & Cheeke
2012). This type of wave only travels on a surface that is bounded on one side by
strong elastic of the solid and on the other side by elastic forces of the gas molecules
(International Atomic Energy Agency 1988). The longitudinal and shear velocities are
intimately coupled together, meaning they travel at a common velocity. Rayleigh waves
2.4 Ultrasonics 18
capable of travelling around corners (International Atomic Energy Agency 1988).
Figure 2.4: Rayleigh Wave Mechanical Displacement (David & Cheeke 2012).
2.4.4 Lamb Waves
If a Rayleigh wave is introduced into a material that has a thickness equal to three
wavelengths or less then a Lamb Wave results (International Atomic Energy Agency
1988). Lamb waves propagate in the plane of the structure, bound by its parallel surfaces.
There are two types of lamb wave modes, antisymmetric (A0) and symmetric (S0) (David
& Cheeke 2012).
2.4 Ultrasonics 19
For Symmetric Mode:
VP L = 2VS−
VS2
VL2
(2.4)
VS
√
2< VP L < VL (2.5)
For Antisymmetric Mode:
VP =
VP Lβb
2√3 (2.6)
2.4.5 Critique
F Cegla & Davies (2011) investigated the use of ultrasonics at high temperature and
noted it was suitable for use at high temperatures and that laser ultrasonics was the
most suitable however due to the very high price laser ultrasonics has limited feasibility.
Currently there are a number of portable ultrasonic detectors on the market however
they are limited to flaw and defect detection, provide no information on the materials
strength, require skilled technician placement of the transducers and are very limited for
a hazardous environment.
This leads to the conclusion that for ultrasonics to be suitable for the project. Further
investigation would be required into the material properties obtained through
ultrason-ics, impact of the hazardous environment on testing, material properties under fire and
end-user compatibility would be required. Detailed investigation into ultrasonics is
2.5 Low Frequency (Vibration) 20
2.5
Low Frequency (Vibration)
Low frequency vibration methods are those in which bulk disturbances are excited in
the structure (Kapadia n.d.). The frequency of vibration is the materials natural or
resonance frequency (Kapadia n.d.). Any changes to the structure due to the presence
of flaws or defects affect the modal properties of the structure (Pant 2014). Pant (2014)
found that damage will decrease the mass and stiffness and increase the damping ratio.
L Nelson, Jones & Smith (2008) reported that sensitivity is highly dependent on defect
depth and size limiting application to large or shallow defects. L Nelson et al. (2008)
demonstrated that low frequency inspection was possible with access to only one side
without diminishing results.
There are two types of methods used low frequency, global and local.
2.5.1 Global Method
Global method measures the vibration response of the entire structure from a single
point (Kapadia n.d.). The properties measured are modal frequency, modal damping
and mode shape (Kapadia n.d.). Kapadia (n.d.) states that the global method is less
sensitive than local methods because the influence of a flaw is spread over the whole
structure rather than concentrated in the region of testing. Consequently, they are less
effective at detecting small, localised defects (Kapadia n.d.).
2.5.2 Local Method
Local method is undertaken through either of two methods. The first method where
the excitation is applied at a single point and the response measured at several other
locations; and the second is where the excitation is applied and the response measured
2.6 Dye Penetrant Testing 21
Figure 2.6: Global Method Low Frequency NDT (Kapadia n.d.).
2.5.3 Critique
Low frequency testing would be able to provide information on the integrity of the
ma-terial, however further investigation would be required into the undertaking of this
in-spection at high temperatures as only limited information currently exists. Additionally,
this test method would require direct contact with the material from the end user, which
would raise a safety issue when it is at 200◦C and not meet the requirements for
porta-bility. Due to this, low frequency is not suitable for the project.
2.6
Dye Penetrant Testing
Dye penetrant testing is a technique used for the detection of surface flaws or
discon-tinuities in non-porous materials (International Atomic Energy Agency 1988). A liquid
dye penetrant is applied to the surface of the material for a period of time to allow the
flow of the liquid dye penetrant into any surface flaws through capillary action. The
excess liquid is wiped off the surface leaving the dye entrapped in the flaw or
discontinu-ity. This provides contrast between materials and the flaw (International Atomic Energy
Agency 1988).
applica-2.7 Magnetic Powder 22
Figure 2.7: Fluorescence of Dye Penetrant NDT (International Atomic Energy Agency 1988).
tions (Khan 1999). Z Zhang & Zhao (2016) states that dye penetrant testing is suitable
for use in high temperature environments however, the penetrant can only be in contact
with the high temperature artefact for a short period of time without damaging the dye,
therefore it requires the test speed to be fast (Z Zhang & Zhao 2016).
Dye penetrant testing has a number of disadvantages, including but not limited to, only
surface flaws can be detected, pre-cleaning of the material is critical as contaminants may
mask defects, direct access to the surface is required and the flaw must be of sufficient
size to allow the ingress of dye penetrant. If the defect is not of sufficient size, then
enough dye will not penetrant to bleed out, allowing for detection by the human eye or
satisfy the dimensional thresholds of fluorescence.
Due to dye penetrant testing being limited to the detection of surface flaws or
disconti-nuities in non-porous materials it was not deemed feasible for the project.
2.7
Magnetic Powder
Magnetic particle testing is the inspection of surface and just below surface flaws in
materials that are able to be easily magnetised. The test piece must first be magnetised,
2.7 Magnetic Powder 23
magnetic field. Any surface or near surface flaw will therefore interrupt the flow of
the magnetic field and be visible once magnetic particles are sprinkled on the material
(International Atomic Energy Agency 1988).
Figure 2.8: Magnetic Particle NDT (International Atomic Energy Agency 1988).
Dry powder magnetic particle inspection is capable of being conducted at temperatures
up to 316◦C (Inspection for Industry 2012). For temperatures up to 399◦C a black
coated powder is available (Inspection for Industry 2012). Dry powder is limited by
the iron or iron oxide coating that is used to enhance visibility. The iron or iron oxide
coating breaks down under high temperatures, thereby limiting the mobility of particles.
As the temperature increases there is a decrease in magnetic permeability of the iron
particles and a decrease in magnitude of the magnetic poles on opposite sides of the
flaws (Inspection for Industry 2012). International (2008) further states that magnetic
powder is combustible, albeit the fire hazard is very low.
International (2008) states that through the use of a magnetic slurry/paint examination
of vertical or overhead surfaces is possible. Khan (1999) further states that to achieve
best results the magnetic field must be orientated perpendicular to the discontinuity.
Due to this and the limitation on determining internal material integrity issues magnetic
2.8 Radiography 24
2.8
Radiography
Radiography can be used for the inspection of internal flaws or defects (Hashemite
University n.d.). There are three common types of radiography, x-rays,γ-rays and
neu-tron radiography (Engineers Handbook n.d.).
2.8.1 X-ray
The inspected component is exposed to X-ray radiation for the detection of flaws or
defects. X-rays utilise a photographic film placed on the other-side of the material that
captures the differences in intensity from the produced source. The shadow picture
pro-duced is know as a radiograph. The absorption of a material undergoing x-rays will
increase with increasing atomic number (Oliveira 2004). The effectiveness of X-rays is
improved through the use of an opaque penetrating fluid such as hydrogenated
hydro-carbons (Oliveira 2004). If sufficient time is allowed from injecting, the fluid will spread
into the damaged regions increasing sensitivity to the x-ray. A limitation is that the
opaque fluid must be injected into the area of concern, therefore internal delaminations
require a hole to be drilled into the material to allow for fluid penetration (Oliveira 2004).
Meaning the material must be damage for the test to be conducted.
2.8.2 Gamma-ray
Gamma(γ)-ray utilise a similar operation method to x-ray however a different source is
required. Hashemite University (n.d.) states that γ-rays are the most energetic form
of electromagnetic radiation. The difference between the sources is in that the shortest
wavelength in the x-ray spectrum is equal to the penetrating power of the γ-ray, but
the rest of the wavelengths are far less penetrating (Blom & Gradin 1990). γ-ray has
2.8 Radiography 25
Figure 2.9: Radiography NDT (Jobs 2013).
lighter and more robust equipment. The penetrating power ofγ-rays is governed by the
isotope selected and elapsed time limiting its tailorability.
2.8.3 Neutron Radiography
Neutron radiography uses flux neutrons, which are absorbed by the material being
in-spected. Neutron radiography is produced from sources such as nuclear reactors, electron
sources or isotopes sources (Svab & Balasko n.d.). The neutron radiation is absorbed
more into materials containing hydrogen and least absorbed by materials with a high
atomic number. A screen is placed before a x-ray film which is sensitive to the neutron
2.8 Radiography 26
2.8.4 Critique
International Atomic Energy Agency (2005) states that radiography is suitable for high
temperature environments. The limitations of radiography lies in that access to both
sides of the material is required, exposure to radiation and must be used in a highly
controlled environment. Due to access being restricted to one side of the material,
expo-sure to harmful radiation and the uncontrolled environment testing will be undertaken
Chapter 3
Methodology
This chapter presents the methodology for the key design aspects of the chosen
non-invasive test method. Further, it outlines the material properties and integrity issues for
Aluminium, GFRP and CFRP under high temperatures and fire conditions.
The key design aspects of ACU were acoustic impedance, transmission coefficient for
a plate, wave propagation at incident in homogeneous media, wave propagation in
non-homogeneous media, attenuation, lamb waves, ultrasonic velocity with temperature, Doppler
shift, material properties and material defects.
A review of material properties under fire showed that the elastic modulus of Aluminium
greatly decreases after 200◦C and for Composite greatly decrease after Glass Transition
Temperature (Tg1).
3.1
Introduction
The test method chosen must not require contact with the material undergoing testing,
3.1 Introduction 28
distance from the hot material. Additionally, the test method must be non-invasive and
non-impact to ensure the material will not be negatively affected by the test. If the test
method chosen required contact with a hot bulkhead and/or deckhead which had reached
a plastic state then any excessive force applied by personnel conducting the test could
lead to extreme damage to the bulkhead and/or deckhead or at worst personel falling
into the hot material.
From the literature review it was determined that ultrasonic testing was the most suitable
non-invasive test method for further design development. Specifically, ACU testing was
chosen as the most suitable non-invasive test method for further development as it does
not require direct contact with the hazardous material, is non-invasive, and provides the
benefits of ultrasonic testing.
The key design aspects of ultrasonics are detailed in Chapter 3.2.
Aluminium, GFRP and CFRP material properties and integrity issues under high
tem-peratures and fire were investigated to optimise the design configuration to acquire
rele-vant information. This information was used to optimise the non-invasive test method by
ensuring information acquired was suitable, relevant and most importantly beneficial to
the end-user. This information allowed understanding of what happens to our materials
under fire, it was also the baseline for which to compare results. This information is
detailed in Chapter 3.3 and 3.4.
The results of preliminary testing at room temperature were evaluated, allowing for
fur-ther optimisation of the design configuration before testing under fire conditions. Signal
processing and analysis was undertaken in MATLAB. The testing at room temperature
allowed for the determination of the feasibility of the design and determination of what
further optimisation or re-design needed to be undertaken. Optimisation of the design
was undertaken by examining the reasons why favourable results were not achieved and
3.1 Introduction 29
Due to the cost involved in the procurement of the Aluminium, GFRP and CFRP plates,
three plates of each were available for the project. Furthermore, the irreversible damage
caused to the plates when placed under fire conditions limits them to being tested once.
If a plate was to be tested more then once, the previous damage to the plates would
negatively impact the reliability of the results. Therefore, testing at room temperature
ensured that the optimal non-invasive test method design was used when the materials
were placed under fire conditions and resources were not wasted.
Aluminium was heated to 260◦C, while GFRP and CFRP were heated to 160◦C. A
Liq-uefied Petroleum Gas (LPG) gas bottle and burner were used to simulate fire conditions.
A grill was placed above the burner to break the flame thereby limiting flame high points
and ensuring even flame distribution. Secondly, a minimal air gap was placed between
the flame and the plate to minimise burning and maximise heat loading.
The materials underwent non-invasive testing at 10◦C temperature increments. The test
results were evaluated in relation to:
• suitability of the chosen non-invasive test method;
• impact of temperature on results;
• material properties and integrity issues;
• suitability of the results to be used as a baseline response at a set temperature; and
• limitations of this non-invasive test method.
If time permitted a re-design of the chosen non-invasive test method to be fully portable
and suitable for a fire hazardous environment would have been undertaken. If resources
and time permitted a prototype of this new design was to be built for in-service testing,
with verification and validation of results against a calibrated oscilloscope. Due to the
time taken to optimise results received at room temperature, no time was available to
3.2 Air-Coupled Ultrasonics 30
3.2
Air-Coupled Ultrasonics
Ultrasonics are used in the inspection of metals, fibre-reinforced plastics, concrete and
many other materials. Most commonly this technique is undertaken using water as a
coupling agent or contact transducers. Both techniques are not suitable or feasible for
the hazardous environment for which the project is examining due to requiring direct
contact with the bulkhead and/or deckhead which may cause damage. To overcome
this ACU testing was deemed the most suitable non-invasive test method for further
development. ACU was chosen due to not requiring direct contact with the hazardous
material, while providing the benefits of ultrasonic testing.
The non-invasive test method chosen must be feasible with access to only one side of
the material, therefore through transmission ultrasonics was not suitable. For the
oper-ation of a ACU transducer, a high voltage (VP−P) is required to produce the waveform.
Therefore, this limits a transducer to being used for only transmit or receive.
Further-more, due to the size of the transducers a separation angle is required to align them
meaning pulse-echo ultrasonics cannot be utilised. Therefore, lamb waves were used for
air-coupled ultrasonic testing.
A block diagram of a lamb wave air-coupled ultrasonic test method is shown in Figure
3.1.
The key design aspects of air-coupled ultrasonics requiring further investigation were:
• Acoustic Impedance;
• Transmission Coefficient for a Plate;
• Wave Propagation at Incident in Homogeneous Media;
• Wave Propagation in Non-Homogeneous Media;
3.2 Air-Coupled Ultrasonics 31
Figure 3.1: Air-Coupled Ultrasonic System Block Diagram.
• Lamb Waves;
• Ultrasonic Velocity with Temperature;
• Doppler Shift;
• Material Properties; and
• Material Defects
The hardware configuration utilised is outlined in Chapter 4.2.
3.2.1 Acoustic Impedance
The material characteristic that defines the amount of energy transmitted is the acoustic
3.2 Air-Coupled Ultrasonics 32
densityρ and the velocity of sound V in that material.
Z =ρ∗V (3.1)
When a propagating wave-front hits an interface between two materials, there are
par-tial reflection and transmission coefficients due to the difference in acoustic properties
between two media. Figure 3.2 shows the reflection and transmission relationship. The
characteristic impedance of the two media is defined as Z1 and Z2. David & Cheeke
(2012) specified that since the two media must stay in intimate contact at a perfect
interface, the boundary conditions are the continuity of pressure and velocity. The
re-flection coefficient R, is defined as the fraction of the incident waveform that is reflected
back towards the source. Since the acoustic impedance of air is extremely low when
compared to most materials, only a small fraction of energy is transmitted into the other
medium. Therefore, a high acoustic impedance was present for the project due to the
use of air as the coupling medium and aluminium, GFRP and CFRP as the inspection
material.
Rp=
Z2−Z1
Z2+Z1
(3.2)
The transmission coefficient Tp is given calculated by
Tp=
1Z2
Z2+Z1
(3.3)
3.2 Air-Coupled Ultrasonics 33
Figure 3.2: Reflection and Transmission at normal incidence for (a) planar interface and (b)
layer of thickness d between two bulk media (David & Cheeke 2012).
3.2.2 Transmission Coefficient for a Plate
A plate of thickness d and acoustic impedance Z2, inserted between materials of acoustic
impedances Z1 and Z3 is shown in Figure 3.2 (b). When the propagating wave travelling
through material 1 impinges onto material 2, a fraction of the wave is transmitted and
the remaining wave is reflected. When the transmitted wave in material 2 hits the
material 2/3 interface, a fraction of the wave is reflected again and the remaining wave
is transmitted into material 3. The reflected wave from the 2/3 interface travels back to
the material 1/2 interface.
Kommareddy (2003) obtained the expression for the amplitude reflection coefficient Ra
for a two material interface:
Ra=
Pr
Pi
= (1−
Z1
Z3)cos(k2d) +j( Z2 Z3 −
Z1
Z2)sin(k2d)
(1 +Z1Z3)cos(k2d) +j(Z2Z3 +Z1Z2)sin(k2d)
(3.5)
3.2 Air-Coupled Ultrasonics 34
transmission reduces to:
T = 1
1 +14(Z2Z1 −Z1Z2)2sin2(k 2d)
(3.6)
Using the ratio for two acoustic impedances m = Z1/Z3, d for the plate thickness, λfor
the wavelength and the relationship from Equation 3.4, Equation 3.6 becomes:
T = √ 1
1 +14(m− m1)2sin2(2πd λ )
(3.7)
R=
s
1 4(m−
1
m)2sin2( 2πd
λ )
1 +14(m−m1)2sin2(2πd λ )
(3.8)
If the incident wave is of single frequency, the individual waves are intensified or weakened
depending on the phase position. Due to this interface, the transmission and reflection
coefficients have a series of maxima and minima. Kommareddy (2003) summarised the
relationship between plate thickness and maximum reflection and maximum transmission
due to this periodical relationship.
M inima of R and maxima of T occur at d/λ= 0, 1
2, 2 2,
3
2et seq. (3.9)
M axima of R and minima of T occur at d/λ= 1
4, 3 4,
5
4et seq. (3.10)
The dependence of the energy transmission coefficient on the sample thickness is provided
3.2 Air-Coupled Ultrasonics 35
Figure 3.3: Transmission Coefficient
Aluminium.
Figure 3.4: Transmission Coefficient
GFRP at 3km/s.
3.2.3 Wave Propagation at Incident in Homogeneous Media
When the propagating wave-front hits with incidence, a longitudinal and shear wave
component are introduced into the solid due to mode conversion, as shown in Figure 3.5.
The refraction of these waves is governed by Snell’s Law:
sinθi
v1
= sinθr
v1
= sinθl
VL
= sinθs
VS
(3.11)
whereVLandVS are the longitudinal and shear wave velocities through the solid
respec-tively.
For wave propagation there exists angle of incidence where the refracted waves become
critical, these are known as first and second critical angles (David & Cheeke 2012). At
these angles, no energy propagates into the solid, instead propagation occurs along the
interface between two media. This is known as interface waves. The reflection coefficient
for a given angle of incidence is given as:
R = ZLcos
22θ
S+ZSsin22θS−Z1
ZLcos22θS+ZSsin22θS+Z1
3.2 Air-Coupled Ultrasonics 36
Figure 3.5: Reflection and Transmission at a liquid-solid interface with incidence (David &
Cheeke 2012).
From Equation 3.12 the shear and longitudinal wave pressure transmission coefficients
can be calculated
TL=
ρ1
ρ2
ZLcos22θS
ZLcos22θS+ZSsin22θS+Z1
(3.13)
TS =
ρ1
ρ2
ZSsin22θS
ZLcos22θS+ZSsin22θS+Z1
(3.14)
where Z1, ZL and ZS are given by
Z1 =
ρ1v1
cosθi
, ZL=
ρ2vL
cosθL
, ZS =
ρ1vS
cosθS
3.2 Air-Coupled Ultrasonics 37
David & Cheeke (2012) simplified the pressure reflection coefficient by defining an
effec-tive impedance Zeff for the individual longitudinal and shear impedances.
Zef f =ZLcos22θS+ZSsin22θS (3.16)
R= Zef f −Z1
Zef f +Z2
(3.17)
Due to the difference in wave-speeds between air and solids, a critical angle exists where
all sound will be reflected back into the air. From Equation 3.12 this relationship is
plotted for an air-aluminium interface, as shown in Figure 3.6. Therefore, the angle of
incidence used must maximise wave transmission.
3.2 Air-Coupled Ultrasonics 38
3.2.4 Wave Propagation in Non-Homogeneous Media
In homogeneous and isotropic media, bulk waves propagate with the same velocity
and displacement properties independent of frequency, this is not the case for
non-homogeneous or anisotropic media. In non-non-homogeneous media (e.g. GFRP, CFRP)
the structure and dimensions of micro-structured media determine the properties of the
propagating waves leading to dispersive solutions and are directionally dependent.
Daw-son (2010) investigated the influence of angle of incidence relative to the fibre orientation
on velocity by plotting the phase velocity dispersion curves for parallel and perpendicular
incidence, as shown in Figure 3.7 and Figure 3.8.
Figure 3.7: Phase velocity dispersion curves for a unidirectional fibre reinforced composite
plate parallel to the direction of fibre alignment (Rose 2004).
Wang & Rokhlin (2002) summarised the findings of Rose, Rokhlin & Adler (1987),
Hosten (1992) and Lobkis, Chimenti, Zhang & Rudolph (2000), specifically, that
non-homogeneous composites may be considered as an effective non-homogeneous medium when
using low frequency ultrasonics. Therefore, the same procedures developed for a
homo-geneous layer can be used to reconstruct the effective elastic constants from the wave
3.2 Air-Coupled Ultrasonics 39
Figure 3.8: Phase velocity dispersion curves for a unidirectional fibre reinforced composite
plate perpendicular to the direction of fibre alignment (Rose 2004).
3.2.5 Attenuation
Attenuation is the loss of sound energy as the ultrasonic beam passes through the material
(Kommareddy 2003). Attenuation results in the change in amplitude of a travelling
wave over a given distance (R Nishanth & Babu n.d.). Attenuation is composed of
two components, absorption and scattering. Absorption is the loss of energy due to
mechanisms such as dislocation, damping, hysteresis losses and thermoelastic effects.
Scattering is the loss of energy due to interaction with the materials polycrystalline
structure when the wavelength approaches the grain size.
Attenuation in the material is measured by finding the amplitude difference between the
two back-surface signals and dividing by the path travelled. Kumar & Pandey (2010)
provided an equation for the determination of attenuation (dB/mm):
α= 1
2X20log10[
1 (m−n)
In
Im
] (3.18)
3.2 Air-Coupled Ultrasonics 40
respectively and X is the specimen thickness (Kumar & Pandey 2010).
Attenuation is also able to be used as a detection method for early stages of fatigue
damage (S Buxbaum & Green 1979). Dislocation motion is a prerequisite to plastic
deformation and attenuation is sensitive to dislocation motion and damping, therefore
a precise attenuation measurement gives valuable information about the initiation of
fatigue damage (S Buxbaum & Green 1979). Green & Joshi (1972) further analysed this
theory to show that change in attenuation during a fatigue test provides much better
results then the appearance of a reflected signal (echo).
The effects of air as the coupling medium also need to be examined for attenuation. The
speed of sound in air is directly related to the temperature in the air as can be seen in
Equation 3.19
cr = 331.31
r
T
273.16 (3.19)
Sound energy propagating through air decreases exponentially as a result of the
atmo-spheric absorption, humidity content, temperature and frequency (International Atomic
En-ergy Agency 1988).
P =POe−0.1151αx (3.20)
where P is the final pressure, PO is the initial pressure, x is the beam path in meters and
α is the attenuation coefficient.
3.2 Air-Coupled Ultrasonics 41
temperature T in kelvin, humidity and atmospheric pressure in (kPa).
α= 8.686f2([1.84x10⁻¹¹(pa
pr
)−1(T
Tr
)12] + (T
Tr
)52(0.01275[exp(−2239.1
T )][
fro
f2
ro+fro2
]
+ 0.1068[exp(−3352
T )][
frN
f2
ro+fro2
])
(3.21)
Therefore as the frequency and temperature increase attenuation also normally increases.
The attenuation at frequencies of 100 KHz and 175 KHz is provided in Table 3.1,
calcu-lated from Equation 3.21.
Temperature Humidity Frequency (KHz) Attenuation (dB/m)
20 60 100 3.282
100 60 100 3.612
150 60 100 8.838
200 60 100 8.802
20 60 175 6.712
100 60 175 8.869
150 60 175 16.159
200 60 175 23.796
Table 3.1: Attenuation in Air.
As can be seen in Table 3.1, the hotter the air the greater the attenuation will normally
be. As the plate warms up it will cause the air surrounding the plate to heat up due to
convection producing a column of hot air rising vertically called the natural convection
current (W Wright, Carpenter & Jansen 1998). To overcome this the distance between
the ultrasonic transducer and inspection material must be kept to a minimum while
ensuring that the near fie