Int. J. Electrochem. Sci., 13 (2018) 5630 – 5644, doi: 10.20964/2018.06.16
International Journal of
ELECTROCHEMICAL
SCIENCE
www.electrochemsci.org
Impact of Li
2O/Metal Mole Ratio on Lithium-ion Battery Anode
Performance
Muharrem Kunduraci1,*, Turkan Gamze Ulusoy Ghobadi2,3, Eda Yilmaz2
1
Department of Mechanical Engineering, Faculty of Engineering, University of Turkish Aeronautical Association, Ankara 06790, Turkey
2
UNAM – National Nanotechnology Research Center and Institute of Materials Science and Nanotechnology, Bilkent University, Ankara 06800, Turkey
3
Department of Energy Engineering, Faculty of Engineering, Ankara University, Ankara 06830, Turkey
*
E-mail: [email protected]
Received: 23January 2018 / Accepted: 23 March 2018 / Published: 10May 2018
In this study the electrochemical impact of Li2O/metal mole ratio on the cycle life of lithium-ion battery anode materials is demonstrated. For this purpose, nanostructured layered LiNi1/3Mn1/3Co1/3O2 (LiNMC) and spinel LiMn1.5Ni0.5O4 (LiMNO) materials, traditionally known as cathode materials, are evaluated as anode materials and compared against their lithium-free versions NMC (Ni:Mn:Co=1:1:1) and MNO (Mn:Ni=3:1). The Li2O/metal ratio in fully lithiated states are 2.0 for lithium containing (LiNMC and LiMNO) and 1.3 for lithium-free (NMC and MNO) samples. Battery tests show that capacity fading of lithium containing samples is 3 to 4 times larger than lithium-free samples. The differences in the electronic conductivities and voltages profiles of lithium containing and lithium-free anode materials are suggested to be the origin of such electrochemical disparity.
Keywords: lithium battery, conversion anode, composite,
1. INTRODUCTION
From this perspective, the structure in discharged state is actually a composite material. We know from materials science that the physical properties of composite materials such as strength and ductility are highly dependent on the type, size, shape and volume fraction of dispersed phase or filler material. If we use a similar analogy here, the conversion efficiency of metal oxides should be dependent on the type of metal used, the size of metal nanoparticles at the end of discharge step and the mole ratios of Li2O host and MNP filler materials. Just to demonstrate the idea about the last item, this ratio can range from 0.5 for Cu2O, 1.0 for NiO, 1.33 for Co3O4 to 3.0 for MoO3 as summarized below.
Cu2O + 2Li 2Cu + Li2O (1)
NiO + 2Li Ni + Li2O (2)
Co3O4 + 8Li 3Co + 4Li2O (3)
MoO3 + 6Li Mo + 3Li2O (4)
In this work, we demonstrate the significance of Li2O/metal mole ratio at the end of full lithiation on the capacity retention of anode material. To the best of our knowledge, this is the first time this has been attempted. However, we should acknowledge the work by Gu [6] who synthesized MnOx anode materials with varying average manganese valency. Among the MnO2, Mn2O3, Mn3O4 and MnO that were synthesized, MnO seems to have the best performance in our opinion. The authors did not put out any argument about the Li2O/metal mole ratio
In this work, we synthesized layered LiNi2+1/3Mn4+1/3Co3+1/3O2 (LiNMC) and spinel LiMn4+1.5Ni2+0.5O4 (LiMNO), which are commonly used as cathode materials in literature [7-10]. They were evaluated as anode materials and compared against their lithium-free counterparts with the same transition metal ratios NMC (Ni:Mn:Co=1:1:1) and MNO (Mn:Ni=3:1), respectively. Our results show a much faster capacity fading for LiNMC and LiMNO anode materials than their lithium-free counterparts.
2. EXPERIMENTAL
2.1. Material Synthesis
The anode materials LiNi2+1/3Mn4+1/3Co3+1/3O2 (LiNMC), LiMn4+1.5Ni2+0.5O4 (LiMNO) and their lithium-free versions with the same transition metal ratios NMC and MNO were synthesized by Pechini process. The details of the process are provided elsewhere [11]. This process was chosen because of its ability to enable atomic scale mixing of multiple elements. At the end of wet synthesis step, the anode materials were ground and initially heated to 450 oC for 1 h in air to burn the organic residues. Following the first heating step, LiNMC and NMC were later heated to 800 oC for 10 h in air to obtain crystalline structures. On the other hand, LiMNO and MNO were heated to 700 oC for 10 h in air as this temperature was known to be high enough to obtain well crystallized materials.
2.2. Materials Characterization
ray spectroscopy (EDX) analysis was also performed for elemental analysis. Powder X-ray diffraction (PXRD) has been carried out by Panalytical X’pert Multi-Purpose and the patterns have been collected in the range of 2θ = 20–80° using Bragg–Brentano geometry (Cu Kα radiation, 𝛌= 0.15418 nm). X-ray photoelectron spectroscopy (XPS, Thermoscientic K-Alpha, Al K-Alpha radiation, hʋ = 1486.6 eV) measurements were performed at survey mode by operating flood gun to prevent surface charging with the pass energy and step size set to 30 eV and 0.1 eV, respectively. Peak position correction was calibrated by referencing the C1s peak position (284.8 eV) and shifting other peaks in the spectrum accordingly. For oxidation state determination; depth profiling was carried out by using XPS with Ar+ ions having energy of 1000 eV. The depth profiles of the samples were generated in 10 cycles, each XPS spectrum collected after exposing the sample to the gas cluster ion beam for 200 s.
2.3. Electrochemical Characterization
The anode slurries were prepared by first dissolving Polyvinylidene fluoride (PVDF) binder in N-methyl-2-pyrrolidone solvent. After the clear solution was obtained, conductive agent Super P followed by anode active material (LiNMC, NMC, LiMNO or MNO) were added to the PVDF/NMP solution. The slurry was stirred for overnight at 500 rpm. The slurry consisted of 70 wt% anode material, 15 wt% PVDF and the remaining 15 wt% conductive carbon material in cases of LiNMC and NMC anodes. The formulation was 50:25:25 wt%, respectively for LiMNO and MNO. The electrode materials were vacuum dried at 70 °C overnight, then rapidly put into argon filled glovebox (O2 <0.5 ppm, H2O <0.5 ppm) to prevent air exposure. Swagelok type cells were used to build lithium half cells. Celgard C480 separators were utilized at anode while separators of the cathodes were glass microfiber filter (GF/C). The electrolyte solutions of the cells were composed of 280 µL of 1 M LiTFSI dissolved in EC:DMC (1:1) solution. The cells were sealed after the assembly to prevent interaction with the atmosphere, and rested at room temperature for 8 hours prior to testing. Electrochemical tests were conducted with Landt CT2001 multichannel potentiostat/ galvanostat at 100 mA/g current rate between 0.2 V and 3 V potential window. The active anode mass ranged from 1.1 mg to 2.6 mg. The AC impedance spectroscopy analysis was carried out at the end of first charge (delithiation) step by applying 5 mV alternating voltage. The frequency range was from 1 kHz to 0.01 Hz. The impedance data were normalized with respect to the active material amount in coin cells.
3. RESULTS AND DISCUSSION
elemental analysis was carried out. The elemental mole ratios of Ni, Mn and Co atoms are provided in Table 1. The deviation from the intended compositions is less than 3%, thereby being in excellent agreement with desired values.
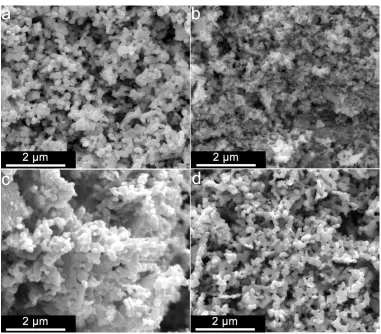
Figure 1. Scanning electron microscopy images of nanostructured a) LiNMC b) NMC c) LiMNO and d) MNO materials
Table 1. Summary of X-ray diffraction phase analyses and SEM-EDS elemental analyses of four anode materials
XRD phase analysis Phase Description SEM-EDX elemental analysis Ni Mn Co Ni Mn Co
(normalized) LiNMC single phase LiNi1/3Mn1/3Co1/3O2 (LiMO2 layered) 18.19 18.94 19.09 0.32 0.34 0.34
NMC 0.15NiO + 0.85(Ni,Mn)(Co,Mn)2O4 (rock salt + AB2O4 spinel) 24.45 22.97 23.47 0.35 0.32 0.33
LiMNO single phase LiMn1.5Ni0.5O4 (Li2A3BO8 spinel) 14.46 41.18 - 0.52 1.48 -
MNO single phase (Ni0.75Mn0.25)Mn2O4 (AB2O4 spinel) 16.12 48.83 - 0.50 1.50 -
[image:4.596.120.501.133.467.2] [image:4.596.62.534.577.663.2]
match to MNO material in the database was NiMn2O4 spinel material with PDF number 98-018-1111. However, we know that Mn-to-Ni ratio in our material is 3-to-1. Therefore, the actual composition of MNO is corrected as (Ni0.75Mn0.25)Mn2O4 which is a AB2O4 type spinel structure. For sample NMC, a primary phase of AB2O4 type spinel and a small amount (15%) of rock salt type NiO phase were identified. While an exact assignment of metals for each position is challenging due to the ternary nature of the NMC sample, we think that A site is mostly occupied by nickel atoms and cobalt atoms occupy exclusively B site with manganese atoms distributed over both sites.
Figure 2. X-ray diffraction spectra a) LiNMC (LiNi1/3Mn1/3Co1/3O2) b) NMC [NiO+(Ni,Mn,Co)3O4] c) LiMNO (LiMn1.5Ni0.5O4) and d) MNO (Ni0.75Mn2.25O4) materials
[image:5.596.105.514.204.532.2]
manganese ions adopt mixed oxidation states having +2, +3 and +4 valencies [18]. The best fitting of manganese spectra was achieved when we assumed all three manganese oxidation states co-exist. The Mn2+, Mn3+ and Mn4+ peaks are available in Figure 3.i and are consistent with earlier reports [19-20]. Based on the composition of (Ni0.75Mn0.25)Mn2O4 anode material as well as the XPS spectra results, average oxidation state of manganese ions was calculated to be 2.89 for MNO.
Figure 3. X-ray photoelectron spectroscopy Mn 2p3/2 Ni 2p3/2 and Co 2p3/2 peaks of fresh LiNMC (a-c), NMC (d-f), LiMNO (g-h) and MNO (i-j) materials
[image:6.596.99.516.170.622.2]
A significant point needs to be made clear before further continuing with electrochemical testing results. The assignment of lattice positions and oxidation states of metal ions were done judicially for all four materials based on XRD and XPS results as well as available literature. While the task was quite straightforward for LiNMC and LiMNO, the oxidation states of manganese ions as well as their distribution over two lattice sites cannot be exact for NMC and MNO. However, since all materials disintegrate into metal nanoparticles dispersed in a Li2O matrix upon discharging, the Li2O/metal ratio in the final structure will be same whether the fresh anode material has two Mn3+ ions or one of each Mn2+ and Mn4+ ions. However, we cannot comment on the impact this will have on the size of nano metal grains at discharged state.
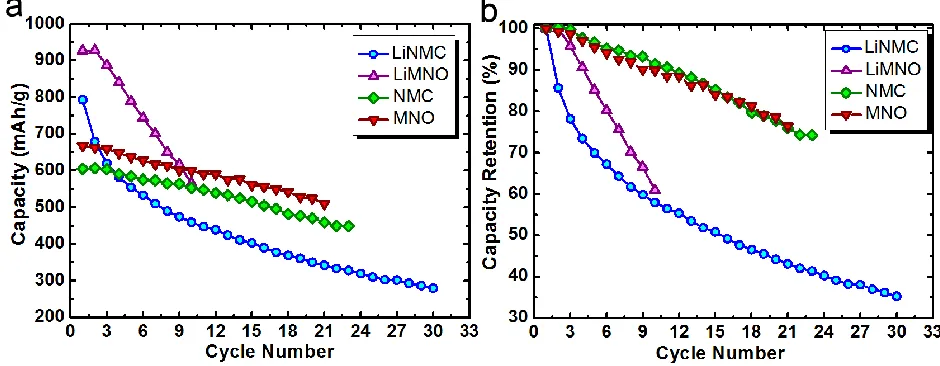
Figure 4. a) Charge capacity (mAh/g) and b) percent capacity retention values of four anode materials as a function of cycle number
The electrochemical impact of Li2O/metal mole ratio in the fully discharged state was studied by evaluating the charge-discharge behaviors of LiNMC and NMC anode materials. Their charge capacities at different cycle numbers are given in Figure 4.a. The first cycle discharge (lithiation) capacities of LiNMC and NMC are 1027 and 993 mAh/g, respectively.
Table 2. First cycle lithiation mechanism of four anode materials with final Li2O/metal ratios in fully lithiated states
LiNi2+1/3Mn4+1/3Co3+1/3O2 + 3Li+ +3e- 1/3(Ni0 + Mn0 +Co0) + 2Li2O (Li2O/M=2)
0.15Ni2+O + 0.85[Ni2+0.9Co3+1.05Mn2.90+1.05]O4 + 7.1Li+ +7.1e-0.90(Ni0 + Mn0 + Co0) + 3.55Li2O (Li2O/M=1.31)
LiMn4+1.5Ni2+0.5O4 + 7Li+ +7e- 1.5Mn0 + 0.5Ni0 + 4Li2O (Li2O/M=2)
Ni2+0.75Mn 2.89+
2.25O4 + 8Li +
+8e- 2.25Mn0 + 0.75Ni0 + 4Li2O (Li2O/M=1.33)
[image:7.596.73.543.242.425.2]
interfacial storage was excluded in the calculation of theoretical capacities [21]. Based on the ratios of theoretical and actual discharge capacities, it can be concluded that both anode materials perform similarly. The 10-20% extra capacities above the theoretical values should stem from charge loss to SEI formation as well as possible interfacial lithium storage. Despite similar discharge behavior, a very noticeable difference is observed in charge (delithiation) capacities. The LiNMC has a 1st cycle charge capacity of 793 mAh/g while NMC can only achieve 605 mAh/g (delithiation capacities of similar materials from literature are provided for comparison in Table 3 in supporting information). These numbers correspond to about 77% and 61% coulombic efficiencies for LiNMC and NMC anode materials, respectively (Figure S1). These results were confirmed with sister cells. Given that both anode electrodes had the same formulation, such a disparity between two anode materials with the same metal composition might be explained by the difference in average metal nanoparticle diameters in their fully lithiated states as well as the availability of extra Li2O matrix in LiNMC.
Looking at the charge and discharge reactions in Table 2 for LiNMC and NMC anode materials, we can notice that Li2O/metal mole ratio is 2.0 for LiNMC and 1.3 for NMC in their fully discharged states. The volume fraction of metal nanoparticles in fully discharged state can be approximated using equation 1 given below.
Equation 1.
where ρLi2O=2.01 g/cc (density of Li2O), ρM=8.90 g/cc (density of metal), AWM=58 g/mol (atomic weight of metal), MWLi2O=29.9 g/mol (molecular weight of Li2O) and (Li2O/M) is the mole ratio of Li2O to metal nanoparticles at the end of discharged state.
Using the above equation, the volume fraction of metal nanoparticles is calculated to be 18% for LiNMC and 25% for NMC materials. While an undisputable conclusion cannot be drawn from these numbers alone, we think that the average diameter of metal nanoparticles in fully discharged state is smaller in case of LiNMC. This is a reasonable speculation as metal nanoparticles would be more diluted inside Li2O matrix and end up with a smaller size with LiNMC anode material. Since the oxidation conversion reaction in charging step takes place at the Li2O/metal interface, smaller metal particles are expected to have better reversibility, thereby explaining larger coulombic efficiency for LiNMC than NMC. Besides the size effect, it can be reasoned that the extra amount of Li2O (about 50% more) in the case of LiNMC will make it easier for transition metal atoms to get oxidized during charging step.
was done with the intention to mitigate the thoughts about the role of electrode’s electronic conductivity.
[image:9.596.81.516.392.714.2]The discharge mechanisms of LiMNO and MNO are provided in Table 2. Similar to LiNMC and NMC anodes, in the fully discharged state Li2O/metal mole ratio is 2.0 and 1.33 for LiMNO and MNO, respectively. Therefore, as far as Li2O/metal mole ratio is concerned, LiNMC and LiMNO are equals just as NMC and MNO are. The charge capacities as well as percent capacity retentions of LiMNO and MNO anode materials as a function of cycle number are plotted in Figure 4.a-b. We can see that LiMNO and MNO couple behave just like LiNMC and NMC couple. The capacity loss rate is 40.2 mAh/g for LiMNO and 7.5 mAh/g for MNO, corresponding to 4.3% and 1% loss per cycle. The first cycle coulombic efficiency is 72% for LiMn4+1.5Ni2+0.5O4 and 60% for Ni2+0.75Mn2.89+2.25O4. The larger number for LiMNO suggests that it is the one with smaller metal nanoparticles just like the case with LNMC and NMC anode materials. However, both numbers are smaller than those of LiNMC and NMC. The reason might lie in the binary vs. ternary nature of both systems. From materials science perspective the presence of more metals would hinder the growth of metal nuclei. Therefore, it can be speculated that the ternary LiNMC anode material has higher first cycle coulombic efficiency than its binary LiMNO counterpart because the former has smaller diameter metal nanoparticles in discharged state. With that said, we cannot rule out the possibility that cobalt atoms have a better reversiblity than both manganese and nickel atoms.
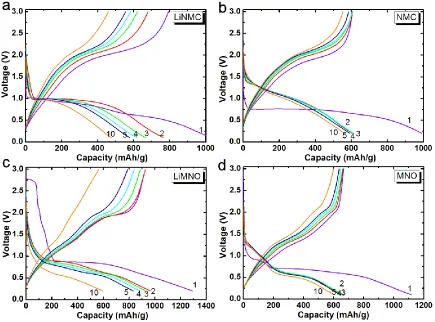
In order to explain the difference in the capacity fading rates of Li-rich and Li-free anode materials, their charge and discharge voltage profiles were examined. In Figure 5.a-d, 1st, 2nd, 3rd, 4th, 5th and 10th cycle voltage profiles are shown. A clear difference in the discharge profiles of LiNMC and NMC can be easily noticed in Figure 5.a and b. While there is a distinct and wide,plateau at 1.0 V in case of LiNMC anode material, the discharge voltage profile of NMC is rather sloping and lacks any distinctive character. Similarly but less noticeably, it can be argued that the voltage profiles of LiMNO are flatter than those of MNO anode material. These observations suggest that the mechanisms of lithiation and delithiatin processes are somewhat different for rich (LiNMC and LiMNO) and Li-free (NMC and MNO) anode materials despite the same chemical compositions. Such a difference should stem from the distribution of transition metals within the matrix at the end of lithiation step. Whether Co, Mn and Ni atoms segregate into individual metallic grains or form binary or ternary grains would explain such anomaly. We think that this point deserves much investigation using advanced atomic probing techniques.
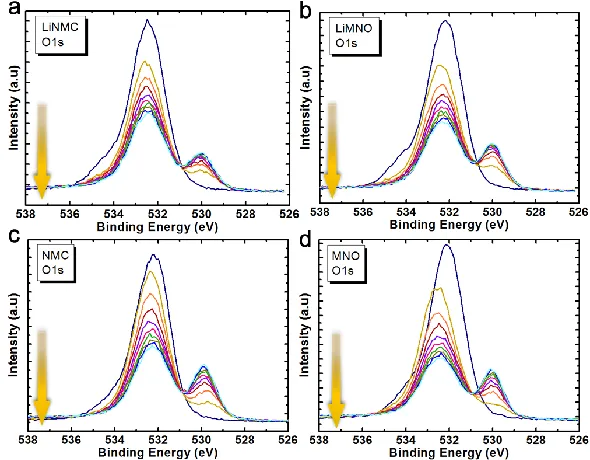
X-ray photoelectron spectroscopy studies were performed at the end of first charging (delithiation) step to reveal oxidation states of transition metals. The Mn 2p3/2 peak is centered around 641.5 eV in all materials as shown in Figure 6.a-d.
[image:10.596.105.515.374.705.2][image:11.596.103.513.292.617.2]
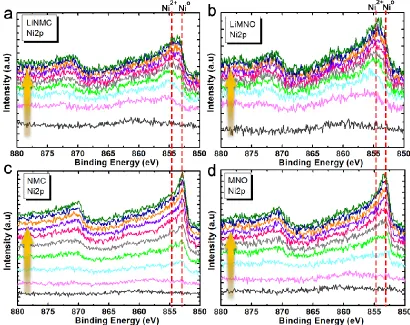
This peak has been assigned to Mn3+ previously [22]. However, small shoulders at 642.5 eV and 640.3 eV can also be noticed, corresponding to Mn4+ and Mn2+, respectively. We concluded that manganese ions are oxidized to an average oxidation states of 3+ in all anode materials. As for cobalt ion, it seems to have 2+ and 3+ oxidation states in both LiNMC and NMC anode materials [23] as shown in Figure s2. Unlike manganese and cobalt ions which showed similar XPS spectrum for both Li-rich and Li-free anode material, we think that the distinction was more obvious with nickel ions. We can see a sharp peak located at 853 eV and a small peak on the right shoulder at 854 eV in cases of NMC and MNO anode material (Figure 7.c-d). These peaks have been assigned to Ni0 and Ni2+, respectively [24]. This result is in agreement with our previous work [25] that nickel atom has a smaller tendency for re-oxidation. We also noticed that the intensity of Ni0 peak increases towards the core of the anode particle, suggesting poorer reversibility in the core of the anode material than at the center. On the other hand, Ni0 peak is not as sharp in cases of LiNMC and LiMNO (Figure 7. a-b).
Figure 7. X-ray photoelectron spectroscopy Ni 2p3/2 peaks of four anode materials at the end of first delithiation step. Dashed lines were added to help guide eye. The arrows point the direction of etching (i.e. towards the bulk of the sample).
electronic conductivity of the very same anode materials. Therefore, we argue that the better cycle life of Li-free anode materials might be partially explained by their higher electronic conductivities.
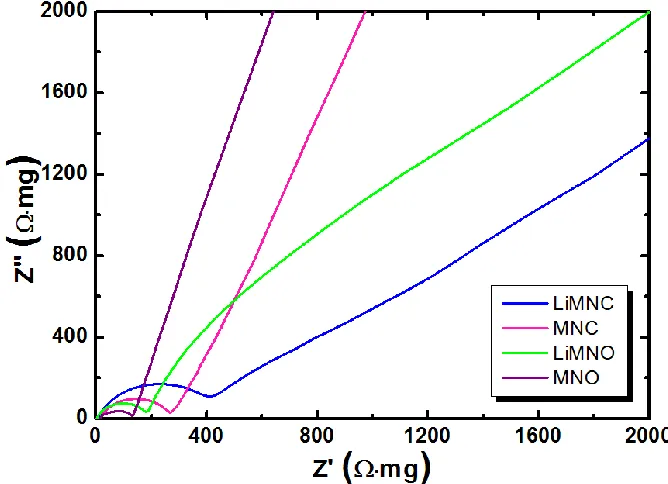
Impedance spectroscopy analyses of anode materials were carried out to gain deepeer insights into the role of electronic conductivity. The spectra were collected at the end of first charging (delithiation) step for all samples. The Z-plot data of all four samples are provided in Figure 8. All four spectra have a high frequency arc which represents the charge transfer resistance (Rct) followed by a low frequency Warburg slope. First thing to point out is that the charge transfer resistances of LiMNO and MNO couple are smaller than those of LiNMC and NMC couple. This might be explained by the larger amount of conductive carbon in the former couple. Secondly, in both couples lithium-free anode electrodes (i.e. NMC and MNO) have smaller Rct than LiNMC and LiMNO electrodes. And finally, the slope of Warburg line is around 45o for LiNMC and LiMNO while it is noticeable larger for NMC and MNO electrodes.
Figure 8. Z-plots of four anode materials at the end of first delithiation step.
The larger slope can be interpreted as more capacitive behavior. These two observations are consistent with the above argument that there are unoxidized nanosized metal grains in lithium-free anode materials at the end of charging step. These metallic nanograins increase the electronic conductivity and capacitive behavior of lithium-free anode materials, thereby helping charge transfer resistance and lithium capacity.
4. CONCLUSION
[image:12.596.141.475.292.534.2]
anode materials and compared against each other. Lithium-free NMC and MNO anode materials exhibited much smaller fading rates than LiNMC and LiMNO, thereby highlighting the positive impact of low Li2O/metal mole ratio in fully lithiated state. We argued that two factors might be at play to explain the electrochemical disparity. Firstly, lithium-free NMC and MNO are suggested to have higher electronic conductivities than LiNMC and LiMNO due to the incomplete re-oxidation of nickel atoms in the former two anode materials. Secondly and probably more importantly, we think that upon initial lithiation the transition metal atoms take a distribution (i.e. chemical uniformity of nano metallic grains) in the final composite structure that is more favorable to cycle life in cases of NMC and MNO anode materials. The differences in the charge and discharge voltage profiles of lithium-rich and lithium-free anode materials suggest different pathways during lithiation and delithiation processes. We believe that these results can develop new interest in this area and advanced techniques that can probe at atomic scale can be utilized in the future for a complete understanding of this phenomena.
[image:13.596.43.548.374.529.2]SUPPORTING INFORMATION
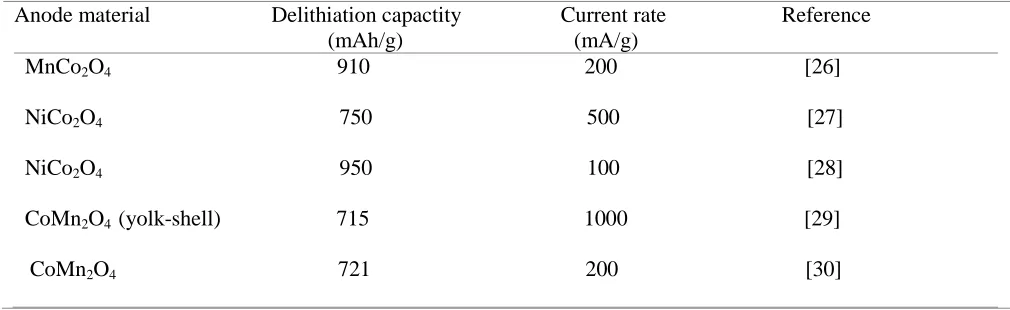
Table 3. List of some AB2O4 type anodes for lithium-ion batteries
Anode material Delithiation capactity Current rate Reference (mAh/g) (mA/g)
MnCo2O4 910 200 [26]
NiCo2O4 750 500 [27]
NiCo2O4 950 100 [28]
CoMn2O4 (yolk-shell) 715 1000 [29]
CoMn2O4 721 200 [30]
[image:13.596.174.435.387.723.2]
Figure S2. X-ray photoelectron spectroscopy Co 2p3/2 peaks of LiNMC and NMC anode materials at the end of first delithiation step. Dashed lines were added to help guide eye. The arrows point the direction of etching (i.e. towards the bulk of the sample).
[image:14.596.149.444.466.696.2]
References
1. P. Poizot, S. Laruelle, S. Grugeon, L. Dupont, J.M. Tarascon, Nature, 407 (2000) 496
2. B. Varghese, M.V. Reddy, Z. Yanwu, C.S. Lit, T.C. Hoong, G.V.S. Rao, B.V.R. Chowdari, A. T. S. Wee, C.T. Lim, C.H. Sow, Chem. Mater., 20 (2008) 3360
3. L. Zhan, S. Wang, L.X. Ding, Z. Li, H. Wang, Electrochim. Acta, 135 (2014) 35
4. J. Yuan, X. Zhang, C. Chen, Y. Hao, R. Agrawal, C. Wang, W. Li, H. Yu, Y. Yu, X. Zhu, Z. Xiong, Y. Xie, Mater. Lett., 190 (2017) 37
5. X. Sun, Y. Xu, P. Ding, M. Jia, G. Ceder, J. Power Sources, 244 (2013) 690 6. X. Gu, J. Yue, L. Li, H. Xue, J. Yang, X. Zhao, Electrochim. Acta, 184 (2015) 250
7. L. Li, L. Wang, X. Zhang, M. Xie, F. Wu, R. Chen, ACS Appl. Mater. Interfaces, 7 (2015) 21939 8. K.W. Nam, W.S. Yoon, X.Q. Yang, J. Power Sources, 189 (2009) 515
9. K.R. Chemelewski, E.S. Lee, W. Li, A. Manthiram, Chem. Mater., 25 (2013) 2890
10.M. Letiche, M. Hallot, M. Huve, T. Brousse, P. Roussel, C. Lethien, Chem. Mater., 29 (2017) 6044
11.M. Kunduraci, G.G. Amatucci, J. Electrochem. Soc., 153 (2006) A1345
12.W. Wei, Z. Wang, Z. Liu, Y. Liu, L. He, D. Chen, A. Umar, L. Guo, J. Li, J. Power Sources, 238 (2013) 376
13.M.Y. Cheng, Y.S. Ye, T.M. Chiu, C.J. Pan, B.J. Hwang, J. Power Sources, 253 (2014) 27
14.L. Leveau, B. Laik, J.P. Pereira-Ramos, A. Gohier, P. Tran-Van, C.S. Cojocaru, J. Power Sources,
316 (2016) 1
15.Z. Chen, J. Wang, D. Chao, T. Baikie, L. Bai, S. Chen, Y. Zhao, T. C. Sum, J. Lin, Z. Shen,
Scientific Reports, 6 (2016) 25771
16.Z. Lu, Y. Liu, X. Lu, H. Wang, G. Yang, Y. Chao, W. Li, F. Yin, J. Power Sources, 360 (2017) 409 17.S. Kim, M. Kim, I. Choi, J. J. Kim, J. Power Sources, 336 (2016) 316
18.E. Jabry, G. Boissier, A. Rousset, R. Carnet, A. Lagrange, J. Phys. Colloque., 47 (1986) C1 19.A. Ramirez, P. Hillebrand, D. Stellmach, M. M. May, P. Bogdanoff, S. Fiechter, J. Phys. Chem. C,
118 (2014) 14073
20.S. Lee, K. Lee, K. Kim, M. Park, Procedia Eng., 168 (2016) 1279
21.P. Balaya, A. J. Bhattacharyya, J. Jamnik, Y. F. Zhukovskii, E. A. Kotomin, J. Maier, J. Power
Sources, 159 (2006) 171
22.J. S. McCloy, C. Leslie, T. Kaspar, W. Jiang, R. K. Bordia, J. Appl. Physics, 111 (2012) 07E1491 23.Z. Pu, H. Zhou, Y. Zheng, W. Huang, X. Li, Appl. Surface Science, 410 (2017) 14
24.S. Song, S. Yao, J. Cao, L. Di, G. Wu, N. Guan, L. Li, Appl. Catalysis B, 217 (2017) 115 25.T.G.U. Ghobadi, M. Kunduraci, E. Yilmaz, J. Alloys Comp., 730 (2018) 96
26.R. Jin, Y. Meng, Y. Ma, H. Li, Y. Sun, G. Chen, Electrochim. Acta, 209 (2016) 163 27.K. Wang, Y. Huang, M. Wang, M. Yu, Y. Zhu, J. Wu, Carbon, 125 (2017) 375
28.J. Xu, L. He, W. Xu, H. Tang, H. Liu, T. Han, C. Zhang, Y. Zhang, Electrochim. Acta, 145 (2014) 185
29.L.X. Zhang, Y.L. Wang, H.F. Jiu, W.H. Zheng, J.X. Chang, G.F. He, Electrochim. Acta, 182 (2015) 550
30.X. Pan, J. Ma, R. Yuan, X. Yang, Mater. Chem. Phys., 194 (2017) 137
![Figure 2 . X-ray diffraction spectra a) LiNMC (LiNi1/3Mn1/3Co1/3O2) b) NMC [NiO+(Ni,Mn,Co)3O4] c) LiMNO (LiMn1.5Ni0.5O4) and d) MNO (Ni0.75Mn2.25O4) materials](https://thumb-us.123doks.com/thumbv2/123dok_us/1789010.133237/5.596.105.514.204.532/figure-diffraction-spectra-linmc-lini-limno-limn-materials.webp)