Int. J. Electrochem. Sci., 14 (2019) 598 – 605, doi: 10.20964/2019.01.47
International Journal of
ELECTROCHEMICAL
SCIENCE
www.electrochemsci.org
Short Communication
Metal Element Doping Graphene for the Oxygen Electrode: A
Density Functional Calculation
L. Q. Cai1, H Zhu1,*, Ye Liu2, Z. Y. Jiang2, H. Y. Liu1, Z. D. Yu1
1 School of Energy and Power Engineering, Jiangsu University of Science and Technology, Zhenjiang 212003, China
2 Bohai Shipyard Group Co. Ltd, Huludao 125003, China
E-mail: [email protected]
Received: 8 September 2018 / Accepted: 24 October 2018 / Published: 30 November 2018
As the fundamental electrochemical reactions, the sluggish kinetics of the oxygen reduction reaction (ORR) and oxygen evolution reaction (OER) limit the commercialization of the renewable fuel cells. Alternative to the commercial precious metal catalysts, the development of inexpensive and efficient dual-functional catalysts is of prominent importance. Herein, based on the density functional theory calculation, the ORR/OER activity of the functional graphene is systematically investigated where the 3d transition metal elements (Sc, Ti, V, Cr, Mn, Fe, Co, Ni, Cu and Zn) are selected as the doping components, aiming to screen out the efficient candidates for the oxygen electrocatalysis.
Keywords: Oxygen electrod, 3d–TM doped graphene, Fuel cells, DFT
1. INTRODUCTION
The concerns over the hasty depletion of the fossil fuel have compelled society to explore the clean energy technologies[1-8]. Considering the hydrogen economic, the recyclable fuel cells have received great attention due to its high energy density and environmental friendliness[1, 2]. However, the sluggish kinetics of oxygen reduction reaction (ORR) and oxygen evolution reaction (OER) reduces the relative energy efficiency and limits its commercialization, even catalyzed by the noble metal (Pt for ORR) or metal oxide (IrO2, RuO2 for OER)[9, 10]. To overcome the mentioned limitations, the development of the inexpensive and highly efficient dual-function ORR/OER catalysts is of prominent importance[10, 11].
on the graphene leads to the inferior ORR/OER activity[13]. Li et al. found that the OER/ORR activity of the graphene is promoted by the N doping[14]. The origin is attributed to the different N/C electronegativity, leading to the redistribution electronic structure and creating the active center. Similarly, the improvement effect of the relative B/P/S/F doping elements on the activity is observed [15-18]. That is, nonmetallic element doping is an effective method to enhance the adsorption ability and improve electrocatalysis performance[19].
On the other hand, the metal-embedded graphene shows excellent performance for the gas detectors and the catalysts[20]. Tang et al.[21] systematically investigate the influence of gas adsorption on the geometry, electronic structure and magnetic properties of graphene, where Co doped graphene could be the sensor for the SO2, CO and HCN molecules due to the transformation of the electronic structures. Furthermore, the metal-doped graphene has possessed superior activity of the CO oxidation at the room-temperature, such as Fe-graphene[22], Cu-graphene[23] as well as Al-graphene[24]. Besides, the N2O dissociation could be catalyzed by the metal-doped graphene[25]. That is, the embedment of the metal element graphene generally creates the adsorption site and significantly enhance the corresponding reactions[20]. In addition to the gas-phase reactions, the ORR activity on the metal-doping graphene is studied[26, 27]. Inspired by the mentioned works, our interest is focused on the metal embedded graphene for the bifunctional oxygen electrode materials.
In the manuscript, the activity of 3d transition metal-doped graphene as an ORR/OER dual-function electrochemical catalyst is systematically studied by the DFT calculations within an electrochemical framework. In particular, the adsorption of the ORR intermediates is calculated and the corresponding thermodynamic ORR free energy is evaluated. The data provide the fundamental understanding the electrochemical activity and further identifies optimal candidate as catalysts.
2. MODEL
All calculations are performed within the DFT framework as implemented in DMol3 code[28, 29]. The generalized gradient approximation with the PerdewBurkeErnzerhof (PBE) functional is employed to describe exchange and correlation effects[30]. The DFT Semi-core Pseudopots (DSPP) core treat method is implemented for relativistic effects, which replace core electrons by a single effective potential and introduce some degree of relativistic correction into the core[31]. The double numerical atomic orbital augmented by a polarization function (DNP) is chosen as the basis set[28]. A smearing of 0.005 Ha (1 Ha = 27.21 eV) to the orbital occupation is applied to achieve accurate electronic convergence. In the geometry structural optimization, the convergence tolerances of energy, maximum force and displacement are 1.0×10⁻⁵ Ha, 0.002 Ha/Å and 0.005 Å, respectively.
According to the computational hydrogen electrode (CHE) model developed by Nørskov et. al. where the chemical potential of proton/electron (H+ + e-) in solution is equal to the half of the chemical potential of a gas-phase H2[32]. The ∆E(U) for every elemental step at the potential U can be determined as following:
where ∆E is the electronic energy difference based on DFT calculations. The effect of the bias voltage on the reaction is to simulate the shift of the ΔE energy value by -eU, where e is the basic charge cell of the electron and U is the bias voltage. ΔE(U) < 0 corresponds to an exothermic adsorption process. It is assumed that the energy barrier for proton/electron pair transfer can easily be overcome at room temperature. That is, the reaction barrier of the ORR process is neglected.
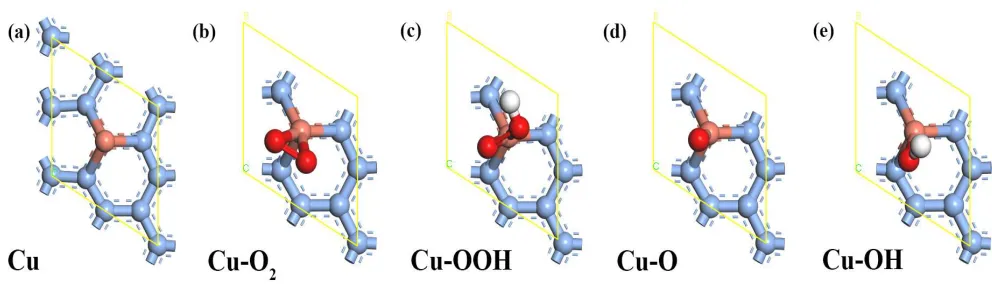
[image:3.596.48.544.215.358.2]Herein, the TM-doped graphene as well as its adsorption configurations are schematically illustrated in Figure 1.
Figure 1. The adsorption configurations of the Cu/G.
3. RESULTS AND DISCUSSION
Table 1.Calculation of adsorption energy of intermediate products.
Sc (eV)
Ti (eV)
V (eV)
Cr (eV)
Mn (eV)
Fe (eV)
Co (eV)
Ni (eV)
Cu (eV)
Zn (eV) O2 -3.21 -2.75 -3.28 -2.81 -2.29 -1.61 -1.35 -1.33 -1.13 -1.11 OOH -3.62 -3.05 -3.38 -2.91 -3.30 -3.00 -2.81 -2.50 -2.18 -2.51 O -5.85 -4.76 -6.11 -5.21 -5.28 -4.84 -4.43 -4.37 -3.51 -3.45 OH -4.75 -3.47 -4.90 -4.42 -4.59 -4.20 -4.03 -3.67 -3.49 -3.90
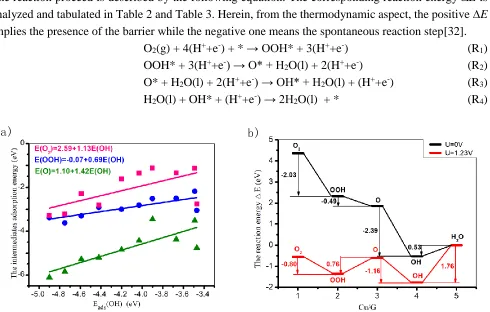
Furthermore, the scaling relationship among the intermediates is clearly observed in Figure 2(a), which is in line with the previous results[35]. That is,
E(O2)=2.59+1.13E(OH) (2)
E(OOH)=-0.07+0.69E(OH) (3)
E(O)=1.10+1.42E(OH) (4)
The presence of the linear curves allows the dependence of the ORR/OER electrochemical activity on the adsorption strength[36].
To evaluate the ORR activity, it is assumed that the four-step OOH formation mechanism is occurred on the TM/G, including the formation of OOH, the formation of O, the formation of OH, and the formation of H2O, which is supported by the relative theoretical and experimental works[34, 36]. The reaction proceed is described by the following equation. The corresponding reaction energy ∆E is analyzed and tabulated in Table 2 and Table 3. Herein, from the thermodynamic aspect, the positive ∆E implies the presence of the barrier while the negative one means the spontaneous reaction step[32].
O2(g) + 4(H++e-) + * → OOH* + 3(H++e-) (R1) OOH* + 3(H++e-) → O* + H2O(l) + 2(H++e-) (R2) O* + H2O(l) + 2(H++e-) → OH* + H2O(l) + (H++e-) (R3) H2O(l) + OH* + (H++e-) → 2H2O(l) + * (R4)
a) b)
[image:4.596.59.549.390.702.2]
The Figure 2(b) describes the reaction energy ∆E of Cu/G. At the potential of 0V, the downshift of the reaction energy is observed for the steps R1, R2 and R3 with the exothermic valves of -2.03, -0.49 and -2.39 eV, respectively. However, the endothermic step of the H2O formation is found, implying the thermodynamic barrier of 0.53 eV. As the potential increased to 1.23V (the theoretical potential of the ORR), the △E profile is significantly changed. The R1 and R3 are maintained as the exothermic reactions whereas the R2 and R4 possess the thermodynamic barriers. The corresponding △E are 0.80, 0.76, -1.16, and 1.76 eV, respectively. Herein, R4 is the rate-determining step (RDS) for the Cu/G. Analogously, from the ∆E data, the R4 is the RDS for the 3d-TM doping systems.
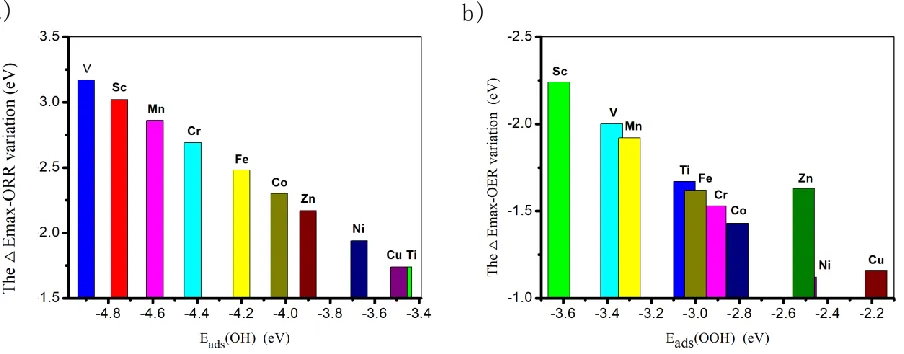
Figure 3(a) describes the △Emax-ORR variation as a function of the OH adsorption energy, where
△Emax-ORR stands for the △E of the RDS. As shown, the increasing of the OH binding strength leading to the increasing of the △Emax-ORR value deteriorating the ORR activity. The corresponding activity follows the order of Ti ≈ Cu > Ni > Zn > Co > Fe > Cr > Mn > V > Sc. According to the Sabatier principle, the optimal ORR catalysts possess the compromise adsorption ability[37]. From the previous works, the RDS of ORR would be the insufficient of O2 activation ( the OOH formation) or the poisoning of OH (the H2O formation)[38]. That is, too strong suffers from the slow rate-determining remove of the O intermediates whereas too weak implies the difficulty in OOH formation, both of which is considered as the origin of the sluggish kinetics[10, 39, 40]. Herein, the 3d-TM/G systems suffers from the OH poisoning phenomenon. Therefore, weakening the interaction between the O intermediates and the catalysts would boost ORR activity[35]. That is the reason for the outstanding ORR performances of Ti/G and Cu/G.
a) b)
Figure 3. The thermodynamic barriers of RDS for ORR (a) and OER (b) at the potential of 1.23V.
[image:5.596.63.515.431.608.2]
OER are located at O2 formation for the other TM/G systems. Furthermore, as shown in Figure 3(b), the increasing of the OOH adsorption energy generally leads to the △Emax-OER upshifts, except the Zn/G system. The corresponding order of OER activity is Ni > Cu > Co > Cr > Fe > Zn > Ti > Mn > V > Sc. Herein, Ni/G and Cu/G are screened out as the potential candidates for the OER electrocatalysis. Table 2.The reaction energy △E at the potential 0 V.
Sc (eV) Ti (eV) V (eV) Cr (eV) Mn (eV) Fe (eV) Co (eV) Ni (eV) Cu (eV) Zn (eV) R1 -3.47 -2.90 -3.23 -2.76 -3.15 -2.85 -2.66 -2.35 -2.03 -2.36 R2 -1.37 -0.86 -1.88 -1.44 -1.12 -0.99 -0.77 -1.02 -0.47 -0.09 R3 -1.31 -1.11 -1.19 -1.62 -1.73 -1.78 -2.01 -1.71 -2.39 -2.86 R4 1.79 0.51 1.94 1.46 1.63 1.25 1.07 0.71 0.53 0.94
△Emax-ORR 1.79 0.51 1.94 1.46 1.63 1.25 1.07 0.71 0.53 0.94
△Emax-OER -3.47 -2.90 -3.23 -2.76 -3.15 -2.85 -2.66 -2.35 -2.39 -2.86
Table 3.The reaction energy △E at the potential 1.23V.
Sc (eV) Ti (eV) V (eV) Cr (eV) Mn (eV) Fe (eV) Co (eV) Ni (eV) Cu (eV) Zn (eV) R1 -2.24 -1.67 -2.00 -1.53 -1.92 -1.62 -1.43 -1.12 -0.80 -1.13 R2 -0.14 0.37 -0.65 -0.21 0.11 0.24 0.46 0.21 0.76 1.14 R3 -0.08 0.12 0.04 -0.39 -0.50 -0.55 -0.78 -0.48 -1.16 -1.63 R4 3.02 1.74 3.17 2.69 2.86 2.48 2.30 1.94 1.76 2.17
△Emax-ORR 3.02 1.74 3.17 2.69 2.86 2.48 2.30 1.94 1.76 2.17
△Emax-OER -2.24 -1.67 -2.00 -1.53 -1.92 -1.62 -1.43 -1.12 -1.16 -1.63
4. CONCLUSION
References
1. Z. Xia, L. An, P. Chen, and D. Xia, Adv. Energy Mater.,(2016) 1600458. 2. V. Čolić and A. S. Bandarenka, ACS Catal., 6(2016) 5378.
3. D. Chen, Y. Xu, M. O. Tade, and Z. Shao, ACS Energy Lett, 2(2017) 319.
4. D. Chen, Y. Xu, B. Hu, C. Yan, and L. Lu, Energy Convers. Manage., 171(2018) 807.
5. W. Kong, W. Zhang, H. Huang, Y. Zhang, J. Wu, and Y. Xu, J. Mater. Sci. Technol,34(2018) 1436. 6. S. Su, Q. Zhang, X. Gao, V. Periasamy, and W. Kong, Int. J. Hydrogen Energy, 41(2016) 16181. 7. M. Zhang, T. Wei, A. M. Zhang, S. L. Li, F. C. Shen, L. Z. Dong, D. S. Li, and Y. Q. Lan, ACS
Omega, 2(2017) 5684.
8. X. Y. Yang, T. Wei, J. S. Li, N. Sheng, P. P. Zhu, J. Q. Sha, T. Wang, and Y. Q. Lan, Inorg.Chem, 56(2017) 8311.
9. M. R. Tarasevich, A. Sadkowski, and E. Yeager, Oxygen Electrochemistry, Springer US ,(1983) New York, US.
10. B. B. Xiao, H. Y. Liu, X. B. Jiang, Z. D. Yu, and Q. Jiang, RSC Adv, 7(2017) 54332. 11. B. Xiao, P. Zhang, L. Han, and Z. Wen, Appl. Surf. Sci, 354(2015) 221.
12. Z. Lu, J. Wang, S. Huang, Y. Hou, Y. Li, Y. Zhao, S. Mu, J. Zhang, and Y. Zhao, Nano Energy, 42(2017) 334.
13. M. Li, L. Zhang, Q. Xu, J. Niu, and Z. Xia, J. Catal, 314(2014) 66.
14. Y. Li, W. Zhou, H. Wang, L. Xie, Y. Liang, F. Wei, J. C. Idrobo, S. J. Pennycook, and H. Dai, Nat. Nanotechnol, 7(2012) 394.
15. Z. H. Sheng, H. L. Gao, W. J. Bao, F. B. Wang, and X. H. Xia, J. Mater. Chem., 22(2011) 390. 16. L. ZW, P. F, W. HJ, Y. H, Z. WX, and Y. J, Angew. Chem., Int. Ed, 50(2011) 3257.
17. L. Zhang, J. Niu, M. Li, and Z. Xia, J. Phys. Chem. C, 118(2014) 3545.
18. X. Sun, Y. Zhang, P. Song, J. Pan, L. Zhuang, W. Xu, and W. Xing, ACS Catal., 3(2013) 1726. 19. Z. Zhao, M. Li, L. Zhang, L. Dai, and Z. Xia, Adv. Mater, 27(2015) 6834.
20. Z. Miao, L. Y. Hao, C. Y. Qing, Z. Chun, and F. Y. Ping, Nanotechnol., 22(2011) 385502. 21. Y. Tang, W. Chen, C. Li, L. Pan, X. Dai, and D. Ma, Appl. Surf. Sci, 342(2015) 191. 22. Y. Li, Z. Zhou, G. Yu, W. Chen, and Z. Chen, J. Phys. Chem. C, 114(2010) 6250. 23. E. Song, Z. Wen, and Q. Jiang, J. Phys. Chem. C, 115(2011) 3678.
24. Q. Jiang, Z. Ao, S. Li, and Z. Wen, RSC.Adv, 4(2014) 20290.
25. Y. A. Lv, G. L. Zhuang, J. G. Wang, Y. B. Jia, and Q. Xie, Phys.Chem.Chem.Phys, 13(2011) 12472.
26. X. Chen, S. Chen, and J. Wang, Appl. Surf. Sci, 379(2016) 291.
27. M. Kaukonen, A. V. Krasheninnikov, E. Kauppinen, and R. M. Nieminen, ACS Catal, 3(2013) 159.
28. B. Delley, J. Chem. Phys, 92(1990) 508. 29. B. Delley, J. Chem. Phys, 113(2000) 7756.
30. J. P. Perdew, K. Burke, and M. Ernzerhof, Phys. Rev. Lett., 77(1996) 3865. 31. B. Delley, Phys. Rev. B, 66(2002) 155125.
32. J. K. Nørskov, J. Rossmeisl, A. Logadottir, L. Lindqvist, J. R. Kitchin, T. Bligaard, and H. Jónsson, J. Phys. Chem. B, 108(2004) 17886.
33. B. Hammer and J. K. Nørskov, Adv. Catal., 45(2000) 71.
34. H. Xu, D. Cheng, D. Cao, and X. C. Zeng, Nat.Catal, 1(2018) 339.
35. F. Calle-Vallejo, J. I. Martinez, and J. Rossmeisl, Phys. Chem. Chem. Phys, 13(2011) 15639. 36. Y. Zheng, D. S. Yang, J. M. Kweun, C. Li, K. Tan, F. Kong, C. Liang, Y. J. Chabal, Y. Y. Kim,
M. Cho, J. S. Yu, and K. Cho, Nano Energy, 30(2016) 443.
38. F. Calle-Vallejo and M. T. Koper, Electrochim. Acta, 84(2012) 3.
39. B. B. Xiao, X. B. Jiang, and Q. Jiang, Phys. Chem. Chem. Phys., 18(2016) 14234. 40. B. B. Xiao, H. Zhu, H. Liu, X. Jiang, and Q. Jiang, Front. Chem., 6(2018) 351.