EUROPEAN COMMISSION
Brussels, 25.5.2011 SEC(2011) 679 final
COMMISSION STAFF WORKING PAPER
TABLE OF CONTENTS
Introduction... - 7 -
1. Executive Summary... - 7 -
1.1. Coal in Europe ... - 7 -
1.2. Coal in Global Context ... - 7 -
1.3. EU Reserves of Coal and Lignite ... - 7 -
1.4. EU Lignite Production and Consumption... - 8 -
1.5. EU Hard Coal Production and Consumption... - 8 -
1.6. World Hard Coal Trade ... - 8 -
1.7. EU Hard Coal Imports ... - 8 -
1.8. International Coal Prices... - 8 -
1.9. EU Coke Production and Consumption... - 9 -
2. Key Facts on Coal in Europe in 2009 ... - 9 -
2.1. European Coal Production and Consumption... - 9 -
2.2. Emissions of CO2 from Coal in the EU ... - 10 -
2.3. Manpower in the European Coal Industry... - 12 -
2.4. Demand Drivers... - 13 -
2.4.1. Overview... - 13 -
2.4.2. Coal and Gas Prices ... - 14 -
2.4.3. Reservoir Levels for Hydro Generation... - 15 -
2.4.4. Emissions Trading ... - 16 -
2.5. Reserves ... - 16 -
2.6. Coal in the Context of European Energy Policy... - 18 -
3. Coal in Global Context ... - 20 -
3.1. World Supply and Demand... - 20 -
3.2. Reserves ... - 21 -
3.3. World Prices ... - 22 -
3.3.1. Price developments ... - 22 -
3.3.3. Coal Derivatives and Forward Prices for Steam Coal ... - 24 -
3.4. Market Supply Structure... - 25 -
3.5. Steel Industry Developments ... - 25 -
3.6. Carbon Dioxide Emissions ... - 27 -
3.7. Long Term Outlook ... - 27 -
4. Hard Coal – Production and Consumption in the EU... - 29 -
4.1. EU Production Trends ... - 29 -
4.2. Consumption... - 30 -
4.3. State Aid to the Hard Coal Industry in the EU ... - 31 -
5. Coke – Production and Consumption in the EU... - 32 -
6. International Hard Coal and Coke Markets ... - 33 -
6.1. Major Hard Coal Producers ... - 33 -
6.2. Hard Coal Trade... - 34 -
6.3. Steam Coal Trade... - 36 -
6.4. Coking Coal Trade... - 37 -
6.5. Coke Trade... - 37 -
6.6. Imports to the EU... - 37 -
6.7. International Price Trends... - 39 -
6.8. Coking Coal Prices ... - 41 -
6.9. Coke Prices ... - 43 -
6.10. World Transport Infrastructure... - 44 -
6.11. Freight Considerations... - 45 -
7. Lignite and Peat – Production and Consumption ... - 46 -
7.1. EU Production Trends ... - 46 -
7.2. Consumption... - 47 -
7.3. Peat Production ... - 47 -
7.4. Oil Shale ... - 47 -
7.5. World Context... - 47 -
Annex 2 – Supplies and Deliveries of Hard Coal, Coke and Lignite in 2008-2009
FIGURES AND TABLES
Figure 1 – EU Solid Fuel Supply in 2009 (Million Tonnes Coal Equivalent) ...- 10 -
Figure 2 – CO2 Emissions from Combustion of Solid Fuels ...- 11 -
Figure 3 – Comparison of Coal and Gas Prices ...- 14 -
Figure 4 – Scandinavian Reservoir Levels (Percent)...- 15 -
Figure 5 – EU ETS Carbon Prices ...- 16 -
Figure 6 – World Energy Consumption...- 20 -
Figure 7 – World Reserves of Coal...- 21 -
Figure 8 – Exchange Rates for Key Currencies...- 23 -
Figure 9 – Movements in Exchange Rates ...- 24 -
Figure 10 – Historic Spot and Forward Swap Prices ...- 25 -
Figure 11 – Top Ten World Steel Producers 2008 ...- 27 -
Figure 12 – Outlook for World Coal Demand (IEA New Policies Scenario) ...- 28 -
Figure 13 – Coal-Fired Electricity Generation by Region...- 28 -
Figure 14 – EU Hard Coal Production Trends...- 29 -
Figure 15 – EU Consumption Trends for Hard Coal ...- 30 -
Figure 16 – EU Coke Production Trends...- 32 -
Figure 17 – Hard Coal Seaborne Trade 2009 ...- 35 -
Figure 18 – World Seaborne Hard Coal Trade ...- 36 -
Figure 19 – EU Import Sources ...- 38 -
Figure 20 – EU Import Volumes by Member State ...- 38 -
Figure 21 – North West Europe Steam Coal Prices...- 39 -
Figure 22 – Comparison of Loaded and Delivered Prices ...- 40 -
Figure 24 – Coking Coal Spot Prices...- 42 -
Figure 25 – Price of Coking Coal Imported from Third Countries ...- 43 -
Figure 26 – Spot Chinese Coke Prices...- 44 -
Figure 27 – Spot Sea Freight Rates...- 45 -
Figure 28 – EU Lignite Production Trends...- 46 -
Table 1 – Emissions of CO2 in 2008 from Combustion of Solid Fuels ...- 11 -
Table 2 – Manpower in the European Coal Industry in 2009...- 12 -
Table 3 – European Coal Reserves and Resources ...- 17 -
Table 4 – Trend in World Crude Steel Production ...- 26 -
Table 5 – Major World Hard Coal Producers ...- 33 -
Table 6 – Price Trends in Coking Coal...- 41 -
This document has been produced using data provided by the Member States and observations from market participants up to the end of 2010. Where data have not been available, clearly indicated estimations have been made by the Commission services. Note that the data may differ from that of Eurostat.
I
NTRODUCTIONArticle 7 paragraph (c) of the Council Regulation (EC) No 405/2003 of 27 February 2003 concerning Community monitoring of imports of hard coal originating in third countries, requires the Commission to report in an appropriate form each year data and information on the market in solid fuels in the Community in the preceding year, together with a market outlook for the current year.1.
1. EXECUTIVE SUMMARY
1.1. Coal in Europe
Europe is the fourth largest region worldwide in terms of coal consumption, after China and the USA, having also fallen behind India in 2009. Around sixty percent of coal consumption in the EU is covered from indigenous production, with 133 million tonnes (Mt) of hard coal and 422 Mt of lignite produced in 2009. The coal industry in Europe is a major employer, with around 280,000 employees in total. In the EU around 26 % of electricity generation is based on coal 2. The use of coal in electricity generation varies widely across the EU Member States. In Poland 90% of electricity is generated from coal and lignite, whereas in France 4% is generated from coal.
1.2. Coal in Global Context
In 2009 total world coal production (hard coal and lignite) increased by 2.1% to 6,902.9 Mt, continuing the growth of the last ten years (albeit at a much reduced rate), where 2009 production was 54% higher than 1999 levels. Analysis of proven coal and lignite reserve data indicates that, at current world production levels, there are approximately 144 years of reserves available. In its ‘New Policies Scenario’ in the World Energy Outlook 2010, the IEA projects coal demand increasing to 5,665 million tonnes coal equivalent (Mtce) in 2020, rising to just over 5,690 Mtce between 2025 and 2030 but then falling back slightly to 5,621 Mtce by 2035, a 19% increase on 2008.
1.3. EU Reserves of Coal and Lignite
Europe possesses substantial reserves of coal and lignite, which represent around 80% of Europe’s fossil fuel reserves. The German Federal Institute for Geosciences and Natural Resources (BGR) estimates reserves at the end of 2008 of 19 Bt and resources of 475 Bt of hard coal, and reserves of 65 Bt and resources of 302 Bt of lignite. The largest hard coal reserve is in Poland, representing 70% of the EU total. In the case of lignite, reserves are present in a swathe from Germany through Central Europe and
1
The Commission staff working document covers only the data to 2009 in comparison with 2008. The data for the previous years can be found on the following website (http://ec.europa.eu/energy/observatory/coal/report_solid_fuels_market_eu_en.htm).
the Balkans, to Greece. Within the EU, Germany has the largest deposit, with major reserves also in Poland, Greece, Hungary, and Bulgaria.
1.4. EU Lignite Production and Consumption
European production of lignite (including peat) was 420.8 Mt in 2009 compared to 434.3 Mt in 2008. Europe produces around 50 % of world coal production of lignite where it represents an energy resource of key importance. Around 95% of lignite is used in power stations with the remainder being largely used for district heating plants and domestic heating, mainly in the form of briquettes.
1.5. EU Hard Coal Production and Consumption
Indigenous production of hard coal continued its decline in 2009, with the overall trend expected to continue in 2010. Production reduced by 9.3% in 2009, to 132.5 Mt. Consumption continues to be dominated by the power sector at 72% followed by coke production at 15%.
1.6. World Hard Coal Trade
Global trade in hard coal grew slightly overall in 2009, with hard coal exports up just 0.4 Mt to 943.6. Steam and coking markets showed opposite trends, with steam coal exports in 2009 increasing by 26.8 Mt (3.9%) to 711.3 Mt, whereas coking coal exports reduced by 26.3 Mt (- 10.2%) to 232.3 Mt. The expected collapse in the steam coal market, as a result of the financial crisis did not materialise, mainly because of the impact of China. High Chinese imports have continued into 2010 and India also continues to grow as an export destination. Growing economies in the Asia-Pacific region, including China and India, more than make up for any stagnation in demand in the Atlantic market. New trade patterns are becoming established with South Africa and Russia switching more supplies east and significant tonnages from Colombia also moving to the Asia-Pacific market. The world trade in coking coal decreased by 11.3% to 232.3 Mt in 2009. As the steel industry began to recover later in 2009 and into 2010, the coking market has stabilised and is expected to return to growth in 2010.
1.7. EU Hard Coal Imports
Imports of hard coal to the EU in 2009 of 179.1 Mt represented a fall of 14.8% compared to 210.3 Mt in the previous year and represented 57% of total supply. The major exporting countries to the EU were Russia (30.0%), Colombia (17.9%), South Africa (16.1%), the USA (13.9%), Australia (7.7%) and Indonesia (7.1%).
1.8. International Coal Prices
although there has continued to be short term volatility. Prices were approaching $100/tonne in October 2010, and the forward curve showed an expectation of prices rising to around $115/tonne by 2014. The weakness of the Atlantic market vis-à-vis the Pacific was illustrated by the fact that free on board (fob) spot prices from Newcastle (Australia) were often higher than prices delivered to North West Europe. During 2009 and 2010 sea freight prices have responded to a resurgence in demand from China and, whilst being extremely volatile, have fluctuated between levels in accordance with historic norms.
1.9. EU Coke Production and Consumption
Total EU production of coke was 35.4 Mt in 2009 compared with 48.8 Mt in 2008, a reduction of 27.3%. Production of coke is widespread around Europe, but most producing countries saw significant reductions as a result of the effect of the economic crisis on steelmaking.
2. KEY FACTS ON COAL IN EUROPE IN 2009 2.1. European Coal Production and Consumption
Europe is the fourth largest region worldwide in terms of coal consumption, after China and the USA, having also fallen behind India in 2009. Coal covers around 17% of the primary energy demand in the European Union; about 26 % of power generation is based on coal.
The use of coal in electricity generation varies widely across the EU Member States. In Poland 90% of electricity is generated from coal and lignite, whereas in France 4% is generated from coal and 76% is nuclear. The split of generation for the EU 27 in 2008 was nuclear 27.7 %, coal 26.2 %, gas 23.0 %, renewables 18 %, oil and others 5,1 % 3.
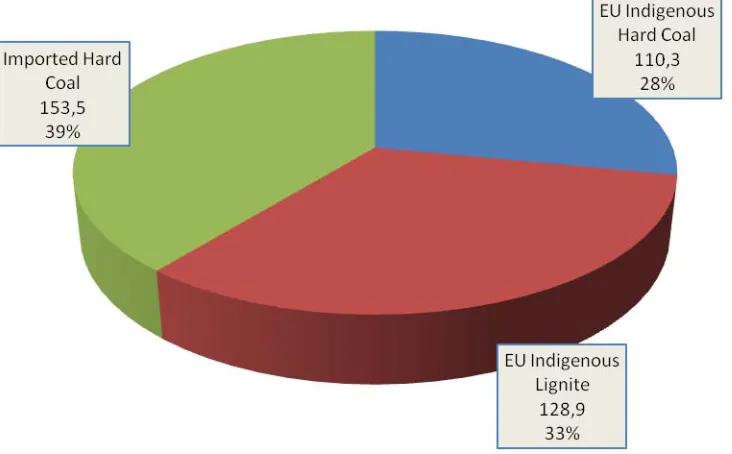
In the European Union around sixty percent of consumption is derived from indigenous production, with 133 Mt of hard coal and 422 Mt of lignite4 produced in 2009. (Production figures expressed on a common basis of tonnes coal equivalent (tce) are 110 Mtce of hard coal and 129 Mtce of lignite.)
The chart below illustrates the contribution of indigenous hard coal and lignite, to-gether with imported hard coal, to total EU solid fuel supply, all expressed in tce 5.
3
Source – Eurostat 2008 data 4
For the purposes of the EU statistics in this report and the attached tables, lignite, brown coal and peat are grouped together and included in a single EU total. (Production of oil shale is not included in the solid fuel totals but figures are reported later in section 7.4.)
5
Figure 1 – EU Solid Fuel Supply in 2009 (Million Tonnes Coal Equivalent)
Source – BP Statistical Review 2010
2.2. Emissions of CO2 from Coal in the EU
Emissions of CO2 from fossil fuels are influenced both by the carbon content of the
fuel and the efficiency with which it is burnt. For example, almost twice as much CO2
per unit of electricity is emitted from the least efficient coal stations in the world compared to the most modern state-of-the-art plants. Emissions from bituminous coal are 95 tonnes CO2 per Terajoule (t/TJ), and from lignite 101 t/TJ, compared to 55 t/TJ
for natural gas. The generally poorer efficiencies of coal stations compared to gas and coal's higher carbon content, however, mean that on average coal emits more than twice as much CO2 as gas in electricity generation. Average values of emissions
factors for OECD6 countries quoted by the IEA are 840 grams of CO2 per kWh from
bituminous coal and 940 grams for lignite, compared to 370 grams for natural gas. In Europe, the split in estimated emissions of CO2 in 2008 from combustion of coal,
lignite and peat between EU Member States is illustrated by the following chart7.
6
Figure 2 – CO2 Emissions from Combustion of Solid Fuels
Source - IEA
It can be seen that the three largest emitters, Germany, Poland and the UK, account for 57% of the EU’s emissions from burning solid fuels.
Detailed figures are given in Table 1 below.
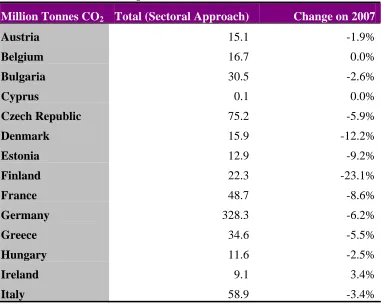
Table 1 – Emissions of CO2 in 2008 from Combustion of Solid Fuels Million Tonnes CO2 Total (Sectoral Approach) Change on 2007
Austria 15.1 -1.9%
Belgium 16.7 0.0%
Bulgaria 30.5 -2.6%
Cyprus 0.1 0.0%
Czech Republic 75.2 -5.9%
Denmark 15.9 -12.2%
Estonia 12.9 -9.2%
Finland 22.3 -23.1%
France 48.7 -8.6%
Germany 328.3 -6.2%
Greece 34.6 -5.5%
Hungary 11.6 -2.5%
Ireland 9.1 3.4%
[image:11.595.89.470.453.757.2]Million Tonnes CO2 Total (Sectoral Approach) Change on 2007
Latvia 0.4 0.0%
Lithuania 0.9 -10.0%
Luxembourg 0.3 0.0%
Malta 0.0 0.0%
Netherlands 29.8 -5.1%
Poland 205.4 -3.3%
Portugal 9.8 -12.5%
Romania 34.9 -3.3%
Slovakia 15.1 -4.4%
Slovenia 6.2 -4.6%
Spain 53.4 -32.1%
Sweden 8.9 0.0%
UK 135.9 -7.9%
Total 1,180.9 -7.5%
Source – IEA
The IEA calculates total CO2 emissions both by the ‘sectoral approach’ (based on
consumption in each sector) and by the reference approach (based on overall national fuel balances). The figures given here are from the sectoral approach, based on the total of all the sectors.
On this basis, total EU emissions of CO2 from combustion of solid fuels in 2008 were
1.18 billion tonnes (Bt), a reduction of 7.5% on 2007.
2.3. Manpower in the European Coal Industry
[image:12.595.83.470.71.375.2]The coal industry in Europe is a major employer, with around 270,000 employees in total. The following table shows the latest available manpower data for 2009. This refers to direct employees, not including contract labour or those working in the generation sector.
Table 2 – Manpower in the European Coal Industry in 2009
Lignite Hard Coal Total
Bulgaria 9,030 4,690 13,720
Czech Republic
Lignite Hard Coal Total
Germany 16,600 29,570 46,170
Greece 5,160 5,160
Hungary 2,630 2,630
Poland 16,630 119,800 136,430
Romania 13,850 10,740 24,590
Slovak Republic
4,500 4,500
Slovenia 1,830 1,830
Spain 7,680 7,680
UK 5,910 5,910
Total 76,360 189,380 265,740
Source – Euracoal
Employment is especially important in those regions where operations are concentrated, and where they may have been present for many years. In such regions there are usually significant numbers of further employees in supporting and related industries.
2.4. Demand Drivers
2.4.1. Overview
Coal demand in Europe is dominated by the power sector, accounting for 72% of overall consumption in the case of hard coal and 95% for lignite. Demand is driven by a complex set of factors and constraints. The starting point is demand for electricity, which is mainly impacted by the energy intensity of the economy, the level of industrial activity, the changing behaviour of consumers, and the weather. The prime determinant as to how demand for electricity can be met is the available capacity of different forms of generation.
For a given level of generation capacity, the market will broadly optimise the system, depending on competing fuel prices, the price of CO2 permits under the EU Emissions
Much coal capacity runs ‘base load’. However, at times when there is an excess of generating plant production available on the system, coal and gas generation tends to compete for ‘mid-merit’ operation (i.e. during those periods when there is sufficient margin between demand and potential supply for choices to be made). The market choice between generation from coal or gas depends on the relationship between the coal price and the gas price, together with the impact on each of the carbon prices, usually expressed as the difference between the ‘clean dark spread’ and the ‘clean spark spread’.
The following paragraphs deal with some of these demand drivers in more detail.
2.4.2. Coal and Gas Prices
The collapse in gas prices in 2009, caused by the onset of recession, was not matched by the fall in coal prices (which were supported by Asian demand) meaning that during much of 2009 the clean spark spread was ahead of the clean dark spread and gas generation was favoured, especially in the UK. The high generator coal stocks which resulted from low burn have continued to affect the market in 2010, with UK coal imports running at around half the levels of 2009. The effects of low spot gas prices primarily affect the UK market, because many other northwest European buyers continue to pay gas prices indexed to oil.
[image:14.595.102.446.465.716.2]ARA Coal prices and UK gas prices are illustrated by the following chart, both on a £/GJ basis.
Figure 3 – Comparison of Coal and Gas Prices
2.4.3. Reservoir Levels for Hydro Generation
Reservoir levels in Spain, together with strong wind generation, have significantly weakened the demand for coal. Hydro reserves improved through 2009 and by the end of March were at 85% of capacity, their highest level of the century.
[image:15.595.91.441.271.578.2]Conversely in Scandinavia, reservoir levels have been relatively low in 2009 and 2010 (as illustrated by the following graph). Hydro reserves ended the winter at their lowest level since 2005, leading to increased coal demand in Denmark for supply to the rest of Scandinavia through the interconnector.
Figure 4 – Scandinavian Reservoir Levels (Percent)
Minimum, maximum and median levels are for the period 1990 to 2006
2.4.4. Emissions Trading
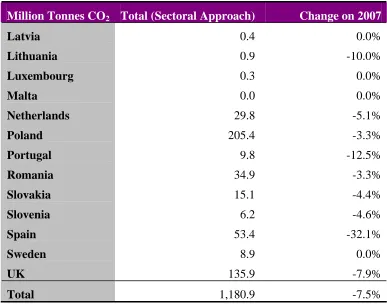
The second phase of the EU Emissions Trading System started in 2008 and prices of allowances initially ranged between €20 to €30 per tonne of CO2. However, a large
reduction in demand associated with the economic downturn led to a fall in values to around €10 in early 2009. Allowances have since traded in a range generally between €12 and €15.
[image:16.595.101.436.266.513.2]Carbon prices for the second phase are illustrated in the following chart8.
Figure 5 – EU ETS Carbon Prices
Source – EEX
At the lower levels of CO2 prices, seen from the end of 2008, it might have been
expected that coal would continue to run ahead of gas, increasing coal demand. However, this can be counteracted by lower gas prices, such as have been seen during 2009 and 2010.
2.5. Reserves
Europe possesses substantial reserves of coal and lignite, which represent around 80% of Europe’s fossil fuel reserves. There are a number of different ways of assessing these deposits, considered further below, but whichever way the assessment is carried out, the figures are substantial. In its latest triennial assessment, published in November 2010, the World Energy Council9 gives estimates of proven recoverable
8
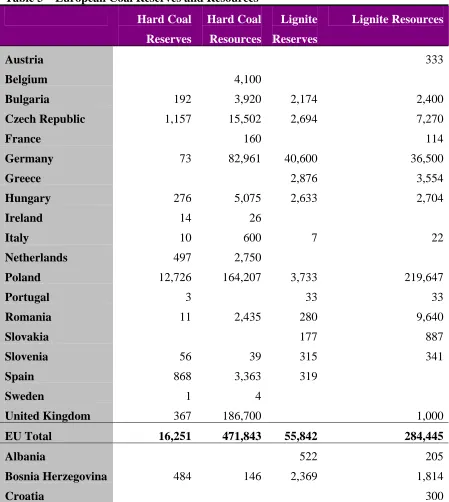
reserves in Europe (at the end of 2008) of around 76.4 Bt, including around 7.6 Bt hard coal (including sub-bituminous coal) and 68.8 Bt lignite. The BGR, which uses different classifications, gives reserves at the end of 2009 of 17.8 Bt and resources of 473.5 Bt of hard coal, and reserves of 69.6 Bt and resources of 318.6 Bt of lignite10. In common with previous years, BGR data are used in this document. The following table shows the BGR assessments of significant reserves and resources in European states at the end of 2009.
Table 3 – European Coal Reserves and Resources
Hard Coal
Reserves
Hard Coal
Resources
Lignite
Reserves
Lignite Resources
Austria 333
Belgium 4,100
Bulgaria 192 3,920 2,174 2,400
Czech Republic 1,157 15,502 2,694 7,270
France 160 114
Germany 73 82,961 40,600 36,500
Greece 2,876 3,554
Hungary 276 5,075 2,633 2,704
Ireland 14 26
Italy 10 600 7 22
Netherlands 497 2,750
Poland 12,726 164,207 3,733 219,647
Portugal 3 33 33
Romania 11 2,435 280 9,640
Slovakia 177 887
Slovenia 56 39 315 341
Spain 868 3,363 319
Sweden 1 4
United Kingdom 367 186,700 1,000
EU Total 16,251 471,843 55,842 284,445
Albania 522 205
Bosnia Herzegovina 484 146 2,369 1,814
Croatia 300
Hard Coal
Reserves
Hard Coal
Resources
Lignite
Reserves
Lignite Resources
Kosovo 1,564 9,262
Macedonia 332 300
Montenegro 142 195
Norway 24 68
Serbia 402 453 7,112 13,074
Turkey 529 793 1,814 9,240
Europe Total 17,831 473,498 69,555 318,639
Source – BGR Reserves, Resources and Availability of Energy Resources 2010
Poland holds the largest hard coal reserves in Europe, representing 78% of the EU total. In the case of lignite, reserves are present in a swathe from Germany through Central Europe and the Balkans, to Greece. Within the EU, Germany has the largest deposits, with major reserves also in Poland, Greece, Hungary, and Bulgaria.
2.6. Coal in the Context of European Energy Policy
Coal has been the backbone of European economies and energy landscapes in the past. This is due to the important contribution of coal to security of supply and also because of its abundance and accessibility. This allows energy from coal to be competitively priced.
Triangle Character of European Energy Policy
Competitiveness
Sustainable
development Security of supply
• Internal market • Networks and other
infrastructure
• Research & innovation
• Climate change control
• Environmentally friendly production and combustion
• International dialogue • Diversification • Best use of
indigenous fuels
The Energy Strategy 2020 adopted by the Commission on 10 November 201011 emphasized that "the potential for further development of EU indigenous fossil fuel resources […] exists and the role they will play must be assessed in all objectivity." An important step in this effort is the planned Energy Roadmap 2050 which will identify the main lines and issues for EU's energy policy agenda in a long term perspective. It will focus on energy security and competitiveness during the transition to a low-carbon energy system until 2050. The Roadmap 2050 process will be supported by scenarios and other analyses.
The European Commission is pursuing discussion with stakeholders through the European Fossil Fuel Forum ("Berlin Forum") and the Coal Dialogue meetings. One focus of the Berlin Forum is to facilitate the best use of indigenous fossil fuel resources in the EU since the continued exploitation of fossil fuel resources in Europe provides important contributions to EU's economy and security of energy supply. At the Berlin Forum plenary meeting on 18-19 October 2010 it was concluded that good practice sharing can be a particularly suitable way of raising awareness of the importance of indigenous fossil fuels and could as well increase public acceptance by showing that their exploitation can be done in an environmentally friendly way.
Dialogue within the Berlin Forum will continue to identify how good practice sharing activities at EU level and the involvement of public institutions can generate the most added value for the industry, policy makers and the general public. Whereas initiatives by and within the respective industries will be of prime importance, it was also recognised that within Member States many good practices, e.g. on regulatory and planning matters, exist which could be further disseminated with help from the Commission.
11
3. COAL IN GLOBAL CONTEXT
3.1. World Supply and Demand
In 2009 total world coal production (hard coal and lignite) increased by 2.1% to 6,902.9 Mt, continuing the growth of the last ten years (albeit at a much reduced rate), where 2009 production was 54% higher than 1999 levels12. The following graph illustrates the long term growth in coal demand compared to other energy sources, and also shows the marked reduction in oil and gas demand in 2009 as a result of the worldwide recession13.
Figure 6 – World Energy Consumption
Source – BP Statistical Review 2010
Hard coal production in 2009 increased by 3.4% to 5,990 Mt, following an increase of 6.5% in 2008. Cumulative growth since 2000 is 66.0%. Brown coal and lignite production decreased by 5.4% to 913 Mt in 2009, compared to growth of 1.2% in 2008, and remains just 0.7% above the 2000 production level.
Analysis of proven coal and lignite reserve data indicates that, at current world production levels, there are approximately 144 years of reserves available.
Total coal demand increased by 3.3%, or 156 Mtce14 in 2009, following a six year trend of annual increases averaging 5.8%.
12
Source – IEA Coal Information 2010 13
Source – BP Statistical Review 2010 14
Global trade in hard coal grew slightly overall in 2009, with hard coal exports up just 0.4 Mt to 943.6 Mt following a 17.6 Mt increase in 2008. Steam and coking markets showed opposite trends, with steam coal exports in 2009 increasing by 26.8 Mt (3.9%) to 711.3 Mt, whereas coking coal exports reduced by 26.3 Mt (- 10.2%) to 232.3 Mt.
3.2. Reserves
The following maps illustrate the world distribution of reserves of hard coal and lignite using BGR data.
Figure 7 – World Reserves of Coal
Source – BGR Reserves, Resources and Availability of Energy Resources 2010
universally accepted system for the classification of coals. Thus, the allocations to these three coal groups may differ from one country to another, and in particular the data relating to the sub-bituminous coals cover bituminous coals and also lignite in a number of countries.
The major differences between different reserves figures probably result from different assessments of what is proven and economically recoverable. Definitions used by BGR are as follows:
• Reserves comprise that portion of energy resources, which is known in detail and can be recovered economically using current technologies. This implies that the amount of reserves depends on the current prices as well as on technological progress. Synonymously used terms are “recoverable” (coal) as well as “proved reserves”. The definition mentioned above means that the amount of reserves depends on the level of knowledge about the deposit, on the commodity prices and the state of the art in technology.
• Resources comprise those energy resources which are either (i) proved but at present not economically recoverable, or
(ii) not demonstrated, but can be expected for geological reasons.
In the case of oil, natural gas and uranium, only recoverable amounts are considered reserves. For coal this term is used for all resources in-place. The WEC uses a similar definition for proved recoverable reserves, but makes the following comments about differences between assessments:
• Although the terms used may be identical, the meaning attributed to each word can vary widely from one source to another. In particular, ‘proved’ may include ‘probable’ reserves and the term ‘recoverable’ may not be strictly adhered to, amounts being in fact ‘in-situ’;
• Conceptually, proved recoverable reserves of any one finite resource in any particular country are not immutable, but subject to virtually constant change, due (inter alia) to shifts in economic criteria, improvements in recovery techniques and the promotion/demotion of deposits from one level of probability to another. 3.3. World Prices
3.3.1. Price developments
The commodities boom in the early part of 2008 had a massive effect on coal prices with average CIF15 steam coal prices for the year increasing by 68% to $137.79/tonne in Europe, and by 77% to $125.42/tonne in Japan (the world’s largest coal importer). The subsequent downturn in transport and commodity pricing was cushioned by unprecedented demand for imports by China, and in 2009, prices reduced by 28% to
$99.74 in Europe, and by 10.3% to $112.39 in Japan. This saw prices returning to around their 2007 levels, which were still significantly higher than prices five years earlier. Average steam coal fob prices likewise decreased in 2009 – by 59.9% in Colombia, 52.1% in Indonesia, 30.8% in South Africa and 13.2% in Australia16. 3.3.2. Currencies
Internationally traded coal is generally priced in US dollars. However, the relationship of the dollar to currency in the producing country is important both in setting market prices and in determining competitiveness and profitability of suppliers. For example, where the South African rand is increasing against the dollar, it makes it harder for South African coals to compete and profitability decreases against the same dollar price. The currency movements against the Euro are illustrated by the following chart.
Figure 8 – Exchange Rates for Key Currencies
Source – OANDA.com
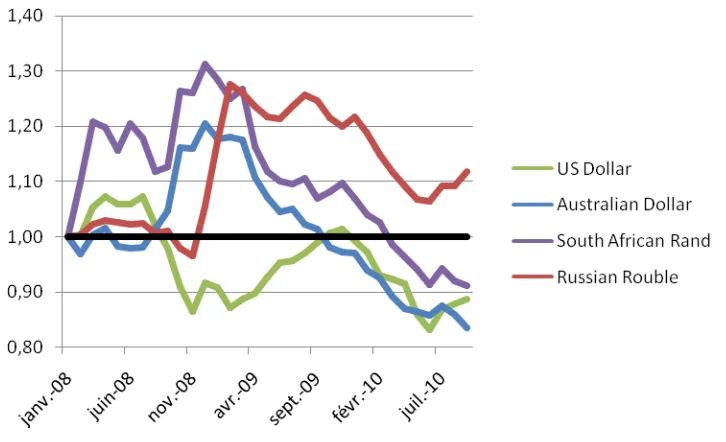
Relative movements in exchange rates can be more clearly seen if all the rates are arbitrarily indexed to a value of 1.00 at January 2008, as illustrated by the following chart. This shows how the US dollar weakened against the Euro through 2009 and then strengthened through the first half of 2010. After the turbulence in late 2008 and early 2009, currencies in Russia, Australia and South Africa all strengthened against the Euro in the remainder of 2009 and the first half of 2010, meaning that these countries need to see higher prices in Europe to maintain their earnings. This is one of the drivers for increasing coal prices in 2010.
Figure 9 – Movements in Exchange Rates
Source – OANDA.com
3.3.3. Coal Derivatives and Forward Prices for Steam Coal
Over recent years we have seen the emergence and rapid growth of trading in coal derivatives – ‘paper trading’ – with swaps based on indices such as API 2 (the North West Europe index) and API 4 (the South African index). The volume of trade in coal swaps is now estimated at around 2 Bt per annum, several times greater than the Atlantic physical market.
The following chart shows the forward values of coal swaps for North West Europe as at the end of 2010, compared to historic prices.
Figure 10 – Historic Spot and Forward Swap Prices
Source – McCloskey Coal Information Services
3.4. Market Supply Structure
Compared to some other commodities, the supply structure for the international coal market is extremely diverse. There is some tendency towards market concentration in all of the producing countries. However, the long-term world market prospects are also encouraging new companies into the coal export business, therefore expanding the pool of suppliers.
In the case of coking coal – above all, hard coking coal – Australia has created a strongly dominant position with around two thirds market share, which in turn is in the hands of just a few producers. However, another player – Vale (CVRD) – has joined the coking coal scene. CVRD is developing into another market participant through projects in Mozambique as well as entry into Australian coal mining. The significant further consolidation which would have arisen from the planned takeover of Rio Tinto by BHP Billiton is no longer anticipated.
Competition in the area of steam coal continues to widen, and in recent years Russia and Indonesia have strengthened their position, as well as the USA returning to steam coal exports in periods of higher prices.
3.5. Steel Industry Developments
clearly be seen here. China produced 47% of the world’s steel and saw growth of 13% whilst Europe declined by 30% and the rest of the world by 19%. The first nine months of 2010 has seen world steel production recovering by 18%. China, already starting from a stronger base, has increased production by a further 11%.
Table 4 – Trend in World Crude Steel Production
2006 2007 2008 2009
Mt % Mt % Mt % Mt %
China 423 +19 489 +15 500 +2 567 +13
EU 27 207 +6 210 +1 198 -6 139 -30
Rest of World
621 +4 652 +5 631 -3 513 -19
Total 1,251 +9 1,351 +8 1,329 -2 1,219 -8
Source – World Steel Association
During 2009 European steel production reduced by 30% compared to the previous year as a result of the financial crisis. There has however been a good recovery in 2010 with production up by 29% over the first nine months.
Figure 11 – Top Ten World Steel Producers 2008
(Mt crude steel)
Source – World Steel Association
3.6. Carbon Dioxide Emissions
Coal remains the largest source of world CO2 emissions (based on 2007 figures) at
12.2 Gigatonnes (Gt), 1.33 Gt greater than those for oil and over twice those from natural gas. Since 2002, CO2 emissions from coal have grown by an average of 6.1%
per year, over 75% of which has come from rapid growth in China.
3.7. Long Term Outlook
The scenarios in the IEA’s World Energy Outlook 2010 clearly demonstrate the critical influence of government policies, especially those related to climate change, on the outlook for coal demand. In the Current Policies Scenario, which assumes no change in government policies, strong global economic growth and near tripling of electricity demand in non-OECD countries lifts global coal demand to over 7,500 Mtce by 2035, or nearly 60% higher than in 2008.
Figure 12 – Outlook for World Coal Demand (IEA New Policies Scenario)
Source – IEA World Energy Outlook 2010
In the New Policies Scenario, worldwide coal-fired electricity generation develops as shown in the following chart.
Figure 13 – Coal-Fired Electricity Generation by Region
4. HARD COAL –PRODUCTION AND CONSUMPTION IN THE EU
4.1. EU Production Trends
Indigenous production continued its decline in 2009, with the overall trend expected to continue in 2010. The following chart shows trends for the major producing countries.
Figure 14 – EU Hard Coal Production Trends
Hard coal production reduced by 9.3% in 2009, to 132.5 Mt compared to 146.0 Mt in 2008. Detailed figures are given in the Annexes at the end of this report.
The average calorific value of European hard coal is estimated at 24.40 GJ per tonne17. On this basis, hard coal production in 2009, expressed in standard units of coal equivalent, was 110.3 Mtce.
In Poland production reduced by 6.2 Mt (-7.4%) to 77.5 Mt. Polish coking coal production was hard hit by the steel crisis and stocks increased as well as output being throttled back. All mines have suffered from a lack of investment in recent decades for the development of new reserves. Progress with privatisation is slow, with only the large single mine Bogdanka listed so far, and the economic downturn has led to further obstacles in sourcing capital for investment. In 2008 Poland became a net coal importer for the first time (also taking into account exports to other EU Member States) and imports increased slightly to 9.0 Mt in 2009.
In Germany, production in 2009 continued to decline in line with the planned deep mine closure programme, falling by 4.2 Mt (-21.8%) to 15.0 Mt.This programme was originally planned to achieve an orderly end to German mining by 2018, but may be
impacted by the outcome of deliberations in Brussels where the EU Commission has proposed an end to subsidies in 2014. After the closures of the Walsum and Lippe mines in 2008 and 2009, the Ost Mine is due for closure in late 2010.
UK production was relatively stable, reducing by 0.5% in 2009 to 17.4 Mt.Production was affected in early 2010 by operational problems at some deep mines and by bad weather at opencast sites, but has recovered to normal levels as the year has progressed. The Welbeck mine in Nottinghamshire closed as a result of exhaustion of reserves in May 2010, after which there were five major deep mines in operation together with a number of small underground mines and around 30 surface mines of various sizes.
Production in the Czech Republic decreased by 1.7 Mt in 2009 (-13.0%) to 11.0 Mt. Coking coal accounts for around 60% of production volumes, and was affected by the difficult situation in the steel industry. The Czech hard coal industry is in need of investment to maintain output levels, otherwise there is a threat of a rapid drop in production in the next few years as developed reserves are exhausted.
In Spain production reduced by 0.7 Mt to 9.4 Mt in 2009. The economic crisis combined with increased generation from renewables has left many coal-fired power plants idle and as a result power plants and mines have stocked large amounts of coal.
4.2. Consumption
Trends in total consumption of hard coal are illustrated by the following chart.
Figure 15 – EU Consumption Trends for Hard Coal
Underlying the overall reduction in power station consumption were some significant reductions in individual Member States. In 2009, power station consumption reduced by 8.0 Mt (-17.3%) in the UK, by 7.3 Mt (-15.1%) in Germany, by 4.3 Mt (-17.6%) in Spain and by 1.8 Mt (-10.4%) in Italy.
The reduction in demand of 21.6 Mt (33.6%) from coking plants in 2009 was a dramatic consequence of the recession, with major falls in Poland of 3.5 Mt (35.5%), in Italy of 2.7 Mt (43.5%), in Germany of 2.5 Mt (24.9%) and in the Czech Republic of 1.2 Mt (28.2%). There is, however, evidence of significant recovery in this sector in 2010.
4.3. State Aid to the Hard Coal Industry in the EU
In line with Council Regulation (EC) on State aid to the coal industry18, the amount of production aid paid to support uncompetitive hard coal mines which still exist in several Member States further declined. At the same time, the Member States concerned continued to finance measures related to restructuring and consolidation of their subsidised coal sectors. A large part of the support was directed to environmental clean-up measures or early retirement schemes - so called exceptional costs according to the before mentioned Regulation.
From 2007 to 2009 the yearly average of total aid to the hard coal sector was 3 025 million Euro of which 1 180 million Euro was spent for exceptional costs.
The detailed data on State aid expenditures to hard coal mining by Member State from 2004 until 2009 are available on the DG COMP website19. The Council Regulation on State aid to the coal industry expired on 31 December 2010. It was succeeded by a new Decision adopted by the Council on State aid to facilitate the closure of uncompetitive coal mines which provides for aid within a closure plan and under certain conditions.20The uncompetitive mines must be closed by 31 December 2018 and the coal production progressively reduced over the period. The Commission will examine the plans that are submitted to check their compliance with the Council Decision and will adopt decisions on these plans under Council Regulation EC n° 659/1999 of 22 March 1999 laying down rules for the application of Article 93 of EC Treaty.
18
Council Regulation No 1407/2002/EC of 23 July 2002 State aid to the coal industry, OJ L 205 of 2.08.2002, p. 1-8
19
Data differentiated by yearly average of aid destined to current production and not destined to current production and yearly average of total aid to coal sector - chapter 5.3. on the
following website:
http://ec.europa.eu/competition/state_aid/studies_reports/studies_reports.html 20
5. COKE –PRODUCTION AND CONSUMPTION IN THE EU Production trends for coke are illustrated by the following chart.
Figure 16 – EU Coke Production Trends
Total EU production of coke was 35.4 Mt in 2009 compared with 48.8 Mt in 2008, a reduction of 27.3%. Total EU consumption of coke in 2009 was 36.3 Mt compared with 51.1 Mt in 2008, a reduction of 29.1%. At 2.6 Mt, coke imports were also down on 2008 by 53.1%, and supplied around 7% of the market.
6. INTERNATIONAL HARD COAL AND COKE MARKETS
6.1. Major Hard Coal Producers
In 2009, world hard coal production increased by 3.4% (compared to 6.5% in 2008) and followed a period encompassing seven years of record growth, driven predominantly by China, which still showed growth of 8.7% for production in 2009. World production was again driven by growth from non-OECD countries, with 6.9% growth in 2009.
The following table shows figures for the largest producers.
Table 5 – Major World Hard Coal Producers
(Mt)
2007 2008 2009
China 2,466.4 2,734.4 2,971.4
United States 981.7 1,007.2 918.7
India 454.4 488.6 526.1
Australia 324.6 325.4 335.2
Indonesia 223.8 235.1 263.3
South Africa 247.7 252.3 247.3
Russia 217.9 222.4 228.6
Kazakhstan 93.5 106.2 96.2
Poland 88.3 84.3 78.0
Colombia 69.9 73.5 72.9
Ukraine 58.7 59.5 54.8
Others 214.6 205.1 197.1
Total 5,441.5 5,794.0 5,989.6
Source – IEA Coal Information 2010
United States has been one of the world’s major exporters, and remains in sixth place, but in 2009 exports fell by 27.5% to 53.4 Mt.
India is the third largest hard coal producer, and increased production by 7.7% in 2009. Although it dominates South Asian production, Indian coal contains very high ash levels, and is consumed domestically – India is increasingly dependent on imports because of its rapidly growing power requirements and in 2009 became the world’s fourth largest importer.
Australia remains the largest hard coal exporter as well as the fourth largest producer, and increased production by 3.0% in 2009, compared to an increase in production of just 0.2% between 2007 and 2008.
Indonesia overtook Russia to become the fifth largest hard coal producer and remains the second largest exporter in the world (and the largest exporter of steam coal). Coal production showed the world’s strongest growth, up by 12.0% in 2009.
South Africa’s hard coal production in recent years has been fairly static or declining, and it fell by 2.0% in 2009. Exports, however, increased by 11.5% and overtook the USA for fifth place. Although still a major exporter to the European Union, supplies have been increasingly directed to India and other Asian markets.
Russia increased its output by just 2.8% in 2009, and remained the largest international coal supplier to the European Union. Its exports increased by 19% to 116 Mt in 2009 due to large increases in demand from China, and it remained the world’s third largest coal exporter, despite falling behind Indonesia and South Africa to be the world’s seventh largest producer.
Production from Kazakhstan decreased by 9.4% in 2009, after a strong year in 2008. Exports (mainly overland to Russia) also reduced significantly to 23 Mt.
Colombian production fell back by 0.8% in 2009 following an increase of 5.2% in 2008. Colombia remains the fourth largest exporter in the world and a significant supplier to the European Union and the United States.
Poland is the only EU country to rank amongst the world’s major hard coal producers, remaining in ninth place in 2009.
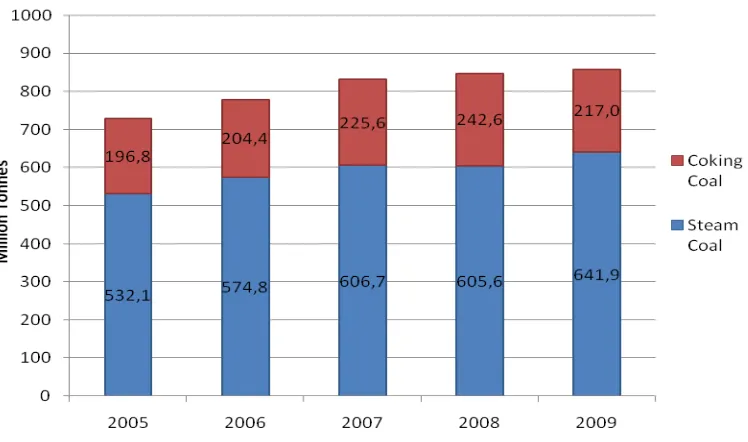
6.2. Hard Coal Trade
A high proportion of world coal production is consumed within the country of origin – around 85%, and this is especially true of the two largest producers, China and the USA. Relatively small proportional changes in supply and demand in these countries can have a major impact on international market dynamics.
World hard coal trade grew by 0.3%, or 3.0 Mt, in 2009, to an estimated total of 940.8 Mt.21 The major steam coal exporting nations are Indonesia, Australia, Russia,
lombia and South Africa, whereas for coking coal the major exporters are Australia, the United States and Canada.
Major world coal trade flows are illustrated by the following diagram.
Figure 17 – Hard Coal Seaborne Trade 2009
Source – Verein der Kohlenimporteure Annual Report 2010
Figure 18 – World Seaborne Hard Coal Trade
Source – IEA Coal Information 2010
6.3. Steam Coal Trade
Total world steam coal exports increased by 26.8 Mt (3.9%) in 2009 to 711.3 Mt. Exports from Indonesia, Australia, Russia, Colombia, South Africa and Vietnam rose in 2009, whereas China, Kazakhstan and the United States saw declining exports. In 2009 Indonesia further increased its steam coal market share to 28.1% of the world total. Australia, Russia, Colombia and South Africa followed with respective shares of 19.2%, 14.8%, 9.8% and 9.3%.
The expected collapse in the steam coal market, as a result of the financial crisis did not materialise, mainly because of the impact of China. A strong divergence between the Atlantic and Pacific markets developed during the year. Whereas demand stagnated or reduced in the USA and Europe, China became a significant net importer. Towards the end of 2009 shipments to China were reported for the first time from South Africa and Colombia, historically seen as Atlantic suppliers. South African coal is also increasingly finding a place in India; during 2009 around 15 Mt coal from South Africa switched from the Atlantic to the Pacific market compared to the previous year. Russia also increased its supplies to the East whereas supplies to the West were stable.
6.4. Coking Coal Trade
The world trade in coking coal decreased by 11.3% to 232.3 Mt in 2009 22.Australia remained, by far, the largest exporter at 125.2 Mt, although exports decreased by 11.7 Mt compared to the previous year.
As a result of the collapse in steel demand in OECD23 countries in 2009 (noted in section 3.5), the coking coal market was also expected to collapse. However, the strong growth of crude steel production in China absorbed large quantities of coking coal from the world market. As the steel industry began to recover later in 2009 and into 2010, the coking market stabilised and is expected to return to growth in 2010.
6.5. Coke Trade
The OECD countries’ imports of coke more than halved between 2008 and 2009 as imports dropped from 18.9 Mt to 9.1 Mt 24. Germany alone accounted for 34.8% of the OECD coke imports in 2009, whilst imports to the United States dropped by 90.4%.
With most coke produced close to where it is used for steelmaking, the international coke trade is extremely sensitive to levels of activity in the steel market. China is by far the largest coke producer and exporter, but demand for imported coke fell to very low levels with the economic downturn.
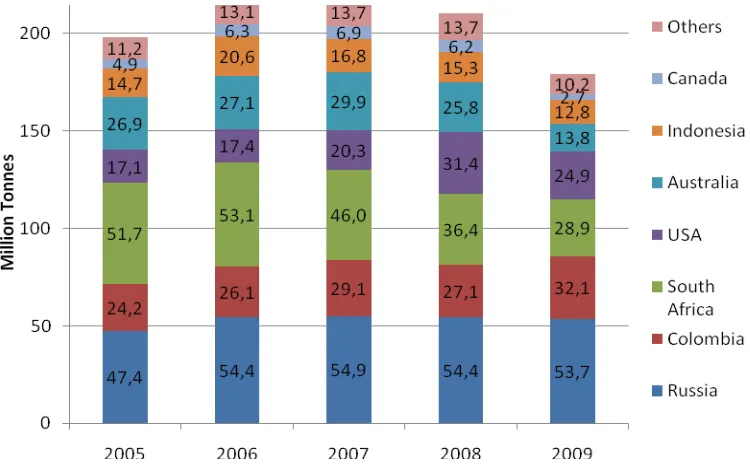
6.6.
Imports to the EUImports of hard coal to the EU in 2009 of 179.1 Mt reduced by 14.8% compared to 210.3 Mt in the previous year and represented 57% of total supply. The major exporting countries to the EU were Russia (30.0%), Colombia (17.9%), South Africa (16.1%), the USA (13.9%), Australia (7.7%) and Indonesia (7.1%). In 2009 Colombia overtook the USA and South Africa to become the EU’s second largest supplier. The split of these imports between supplying countries is illustrated by the following chart.
22
IEA includes coal used in coking blends and for pulverised coal injection in coking coal statistics which are not strictly coking coals
23
Figure 19 – EU Import Sources
Russia has been the largest supplier to the EU since 2006. Amongst the major importers, the UK took 51% of its imports from Russia in 2008 and Germany took 28%. Russia was also the main supplier to most of the Eastern and South Eastern European Member States. Colombia overtook South Africa as the second largest supplier to Europe, accounting for 41% of imports to the Netherlands, 19% to Germany and 17% to Spain. South Africa remained an important supplier, principally to Spain where it accounted for 25% of its imports, and also to Italy (23%), the Netherlands (22%), and France (21%).
[image:38.595.96.471.116.349.2]Major European importing countries are illustrated by the following chart.
The UK remained Europe’s largest coal importer in 2009 at 37.0 Mt, but showed a significant decrease of 14% on 2008. Germany also reduced imports by 13% to 34.2 Mt. Other major reductions in imports were seen in Italy (-24%), Spain (-18%) and France (-28%). The Netherlands was the only major importer to show a significant increase (+16%).
6.7. International Price Trends
[image:39.595.99.446.247.480.2]The following graph illustrates the development of spot steam coal prices delivered to North West Europe.
Figure 21 – North West Europe Steam Coal Prices
Source – McCloskey Coal Information Services (MCIS) basis 6,000 kcal NAR ARA
The rapid fall in coal prices in late 2008 and early 2009, as a result of the economic downturn, was even more marked than the increase earlier in 2008, although it should be noted that when prices reached their lowest point in March 2009, they were still high by historical standards. If Asian demand had not continued to grow, as detailed in section 6.3, prices would probably have suffered a greater collapse. During the remainder of 2009 and for most of 2010 the overall price trend has been upwards. There has continued to be short term volatility, but to a lesser degree than during 2008, and less than has been seen in oil and gas markets. Prices were approaching $100/tonne in October 2010, and the forward curve (Figure 10) showed an expectation of prices rising to around $115/tonne by 2014.
Figure 22 – Comparison of Loaded and Delivered Prices
It can also be noted that, whereas European delivered prices have often been represented as a South African loaded price plus a sea freight rate, for much of the time this implied freight rate has been negative. This reflects the stronger demand for South African coal in India, and the fact that European spot prices are more likely being set by imports from Colombia.
Import prices for steam coal reported to the European Commission are illustrated by the following chart.
[image:40.595.98.427.542.744.2]After the peak of €119/tce in the second semester of 2008, prices fell back by 40% to €71/tce by the second semester of 2009 before recovering to €80/tce in the first semester of 2010.
It is important to note that the prices illustrated in Figure 21 are spot prices, whereas those reported by the European Commission are contract prices. Spot prices refer to deliveries ninety days ahead. There is therefore a time lag before these spot prices and contemporaneous forward swap prices are reflected in contract prices paid by customers such as those reported to the European Commission illustrated in Figure 23. The short-term volatility of international prices is also smoothed out where buyers have entered into longer-term contracts, reflecting prices which were current, or anticipated, when contracts were negotiated.
6.8. Coking Coal Prices
For many years, pricing for coking coal was largely determined in annual contact negotiations and has been strongly influenced by the resulting benchmark prices which emerged during the annual negotiating round (shown in Table 6). From 2010 this practice has changed, with the major suppliers leading a move to quarterly price settlements from April. At the same time, with an increasing spot market in coking coal, a start has been made in establishing monthly price indices (illustrated in Figure 24 – Coking Coal Spot Prices).
The following table illustrates the development of prices for internationally traded coking coal, based on Australian contract prices up to the last year for which annual prices were negotiated.
Table 6 – Price Trends in Coking Coal25 (US $/Tonne FOB Australia)
Contract Prices* 2005/6 2006/7 2007/8 2008/9 2009/10
Hard Coking Coal 125 112 96 300 129
Semi-soft Coking Coal 80 58 65 240 85
PCI 102 68 71 250 90
*April to March basis
Since April 2010, monthly spot prices have been quoted for coking coals and are illustrated by the following chart.
Figure 24 – Coking Coal Spot Prices
Source – McCloskey Coal Information Services (MCIS)
Over recent years the most significant driver of coking coal prices has been the supply/demand balance. The relatively small number of suppliers of prime coking coals, together with the burgeoning demand growth, means that any perceived perturbation to the market can have major impacts on prices.
The global recession – and the associated major downturn in steel production (see paragraph 3.5) – had a significant impact on negotiations for coking coal prices in 2009/10, although these were elevated to some degree by tonnages contracted at the higher prices for 2008/9 and not accepted for delivery by customers. With the move to quarterly prices from April 2010 prices can react more rapidly to perceived changes in the supply/demand balance and after some softening earlier in the year, prices are expected to increase again as the steel market continues its recovery worldwide.
Figure 25 – Price of Coking Coal Imported from Third Countries
The high prices reached in the second semester of 2008 continued into the first semester of 2009, despite the financial crisis, because of the impact of annually negotiated contracts on price levels. The impact of lower contract prices from April 2009 was seen in the second semester of 2009 when prices reduced by 33% to €123/tce before recovering to €135/tce in the first semester of 2010.
6.9. Coke Prices
Figure 26 – Spot Chinese Coke Prices
Source – Euracoal
The development of coke prices reacted in a similar manner to coking coal, reflecting an overheating steel market followed by a partial collapse as the recession took hold. Coke prices from China still remain very high, but there are currently very few sales.
6.10. World Transport Infrastructure
Infrastructure constraints are a major factor in both the development of new coal resources around the world and in meeting surges in current demand. With the rapid growth in recent years of bulk commodities as a whole, and of coal in particular, there have been major bottlenecks in both loading and discharging ports, and domestic railway lines.
Problems vary from country to country; in Australia there has been major congestion at ports; in Russia the very long rail routes both West and East from the coal producing region in Siberia cause periodic problems because of shortage of wagons or adverse weather conditions. The chance to exploit market opportunities arising from the increasing demand in coal has triggered plans for a worldwide expansion of the infrastructure across all of the links of the transport chain.
The realisation of many measures has significantly improved the situation, especially in Australia where queues in the loading ports have been falling. Expansion projects in the loading ports have been launched in Indonesia, Colombia, Russia and South Africa, and Russia is acting to improve rail access to Eastern ports.
6.11. Freight Considerations
Delivered prices to Europe comprise both fob prices from the country of loading and sea freight rates.
[image:45.595.83.429.228.463.2]The following chart shows the development of rates from the beginning of 2004 to April 2010.
Figure 27 – Spot Sea Freight Rates
Richards Bay (South Africa) to Rotterdam
Source - Euracoal
Freight rates react rapidly to supply/demand dynamics and have shown major volatility in recent years. The benchmark freight rate from Richards Bay to Rotterdam ended 2008 at around 10% of its peak value in the middle of the year, as a result of the initial impact of the financial crisis. During 2009 and 2010 prices have responded to a resurgence in demand from China and, whilst being extremely volatile, have fluctuated between levels more in accordance with historic norms.
The peaks in prices seen at various times in recent years, and particularly during 2008, were caused by shortages in capacity, resulting from congestion at ports, on top of a rapid growth in the market both in terms of volume and distances travelled. It is important to note that bulk carriers are used both for coal and for iron ore, for example with Chinese demand for iron ore relying heavily on long-distance deliveries from Brazil.
7. LIGNITE AND PEAT –PRODUCTION AND CONSUMPTION
7.1. EU Production Trends
[image:46.595.79.449.204.426.2]European production of lignite was 420.8 Mt in 2009 compared to 434.3 Mt in 2008. Production reduced by 3.1% in 2009 compared to the previous year. Production trends are illustrated by the following chart26.
Figure 28 – EU Lignite Production Trends
The average calorific value of European lignite (including peat) is estimated at 8.98 GJ per tonne27. On this basis, lignite production in 2009, expressed in standard units of coal equivalent, was 128.9 Mtce.
In 2009 Germany reduced its lignite production by 5.5 Mt (-3.1%) to 169.9 Mt as a result of lower demand from the vertically integrated power sector. Production remained centred in four mining regions – the Rhineland around Cologne, Aachen and Mönchengladbach (92.1 Mt), the Lusatian mining area in South East Brandenburg and North East Saxony (55.7 Mt), the central German mining area in the South East of Saxony-Anhalt and in North West Saxony (20.2 Mt) and the Helmstedt mining area in Lower Saxony (1.9 Mt) 28.
Greece is the EU’s second largest lignite producer, in tonnage terms, and in 2009 production reduced slightly by 1.5% to 64.7 Mt. Production comes from the West Macedonia Lignite Centre in the North of the country and from the Megalopolis Centre in the Peloponnese. In Poland, lignite production reduced by 4.1% to 57.1 Mt in 2009. Two lignite operations are located in central Poland with a third in the south-western region of the country. During 2009
26
For the purposes of the EU statistics in this report and the attached tables, lignite, brown coal and peat are grouped together and included in a single EU total. (Production of oil shale is not included in the solid fuel totals but figures are reported later in paragraph 7.4 .)
27
the first lignite was produced from the Szczercow Field. Szczercow is one of the three fields in the Belchatow lignite deposit where resources amount to 620 Mt.
Production in the Czech Republic reduced by 4.5% to 45.4 Mt in 2009. The main lignite basin and the largest mining area is the Northern Bohemian Brown Coal Basin in the North West of the country, with production from around ten mines.
Romania also has a number of lignite mines of varying sizes, mainly in the South West of the country in the Oltenia Basin; production in 2009 reduced by 13.5% to 27.5 Mt as a result of reduced demand from the power sector.
In Bulgaria, most of the production comes from the Maritsa East coalfield in the South East of the country. Overall Bulgarian production in 2009 reduced by 5.5%, to 27.2 Mt.
7.2. Consumption
Total EU consumption of lignite in 2009 was 420.0 Mt, a decrease of 4.6% compared to 440.4 Mt in 2008. Around 95% of lignite is used in power stations with the remainder being largely used for district heating plants and domestic heating, mainly in the form of briquettes.
There is little trade in lignite because of its low heat value and resulting high unit transportation costs. This means generally that power stations burning lignite are situated close to the mines, with supply and demand being closely matched. Total EU imports of lignite in 2009 were 0.8 Mt, only 0.2% of total supply.
7.3. Peat Production
Within the overall lignite figures, production and consumption of peat is included. Production comes mainly from Finland, Ireland, Sweden, Estonia and Lithuania. In 2009, 13.0 Mt of peat was produced, an increase of 3.7 Mt compared to production of 9.3 Mt in 2008. Consumption of peat in 2009 was 12.9Mt, a decrease of 1.2 Mt compared to consumption of 14.1 Mt in 2008.
7.4. Oil Shale
Oil shale statistics are not included in any of the tables or figures in this report. In 2009, 14.9 Mt of oil shale was produced in Estonia compared to 16.1 Mt in 2008 (-7.5%). Oil shale consumption of 13.8 Mt was used mainly in the power generation sector where consumption was 13.6 Mt. In 2009 consumption was 15.7 Mt including 12.1 Mt in power generation.
7.5. World Context
World production of lignite29 decreased by 5.4% in 2009 to 913.3 Mt. Following its 1989 peak, lignite production declined steadily until 1999, largely as a result of contractions in supply and demand in central and Eastern Europe. Since then, production has been fairly stable with production in 2009 just 0.7% above that in 2000.
The following table shows figures for the largest producers.
Table 7 – Major World Lignite Producers
(Mt)
2007 2008 2009
Germany 180.4 175.3 169.9
Turkey 72.9 76.8 70.5
Russia 71.1 82.5 68.2
United States 71.3 68.7 65.8
Greece 66.3 65.7 64.7
Australia 65.6 72.4 64.0
Poland 57.5 59.6 57.1
Czech Republic 49.7 47.5 45.4
Serbia-Montenegro 37.1 38.7 38.3
Indonesia 36.7 38.5 38.2
Canada 36.6 34.9 35.0
India 34.0 32.4 34.7
Romania 35.8 35.9 30.6
Bulgaria 28.4 29.0 27.2
Others* 110.2 106.9 103.7
Total 953.6 964.8 913.3
*IEA figures also include oil shale production in Estonia
Source – IEA Coal Information 2010
Annex 1 – Summary of EU-27 Data
(Mt)
2008 2009 % Change
Hard Coal
Availability
Production 146.0 132.5 -9.3
Recoveries 1.8 1.2 -32.1
Imports from third countries 210.3 179.1 -14.8
Total 358.1 312.8 -12.7
Deliveries
Power Stations* 235.2 209.1 -11.1
Coking Plants 64.2 42.7 -33.6
Others 42.8 38.0 -11.3
Exports to third countries 0.6 1.2 109.8
Total 342.8 291.0 -15.1
Coke
Availability
Production 48.8 35.4 -27.3
Imports from third countries 5.5 2.6 -53.1
Total 54.2 38.0 -29.9
Deliveries
Steel Industry 43.2 31.2 -27.7
Others 7.9 5.0 -36.4
Exports to third countries 1.4 1.2 -11.3
Total 52.5 37.5 -28.6
Lignite
Availability
Production 434.3 420.8 -3.1
Imports from third countries 1.3 0.8 -33.2
Total 435.5 421.6 -3.2
Deliveries
Power Stations* 414.2 398.2 -3.9
Briquetting Plants 16.0 14.3 -10.3
Others 10.2 7.4 -27.0
Total 440.4 420.0 -4.6
Annex 2 - National Coal Experts' Figures European Commission
Directorate General for Energy
Member State Austria Belgium Bulgaria Cyprus Czech Denmark Estonia Finland France Germany Greece Hungary Ireland Italy
Republic
1. Production (t=t) 19 12,651 19,144 120
of which :
A - Underground 19 12,651 19,144 120
B - Opencast
2. Recoveries 230 6 277
3. Receipts from other EU Countries 2,551 302 135 1,830 264 89 2,172 5,929 547 117 1,646
4. Total imports from Third Countries 651 7,134 1,983 46 477 7,306 123 5,455 19,113 39,498 664 1,384 2,386 23,453
of which :
A - USA 510 1,853 317 224 344 533 4,072 5,373 66 839 142 3,254
B - Canada 60 393 544 1,629 72 984
C - Australia 2,252 18 292 6,319 4,443 18 394 2,923
D - South Africa 1,941 2,243 191 3,317 8,816 51 294 4,596
E - Russian Federation 68 550 391 46 236 2,604 123 3,770 1,826 9,157 329 383 918
F - China 40 167 110
G - Colombia 209 1,680 68 1,956 4,667 779 2,429
H - Indonesia 219 129 2 18 478 7,212
I - Venezuela 435 395
J - Others 73 9 1,274 435 79 474 5,413 90 72 297 742
5. Total Availabilities (1+2+3+4) 3,202 7,436 2,137 46 15,188 7,570 129 5,544 21,562 64,571 664 1,931 2,503 25,219
6. Gross Inland Consumption* 4,143 5,731 2,137 40 9,119 6,998 129 5,027 19,548 65,920 523 1,914 2,226 25,430
A - Power Stations (public & mine) 1,697 1,953 1,735 3,096 6,677 3,607 8,190 48,135 258 1,690 17,000
B - Coking Plants (coal input) 1,827 2,737 402 4,301 1,235 5,986 10,251 1,432 6,249
C - Iron and Steel Industry** 281 478 812 2,636 2,969 1,218
D - Other Industries 265 325 40 846 194 120 180 2,241 3,115 520 161 188 962
of whichPower Stations 254 311 2,912
E - Domestic Heating 74 231 127 9 480 1,341 3 55 271 1
F - Miscellaneous (Total (i)+(ii)+(iii)) 7 64 5 15 109 8 77
(i) Issue to Workers 107
(ii) Patent Fuel Plants 6 15 4 39
(iii) Others 1 5 2 4 38
7. Deliveries to Other EU Countries 1 1,122 6,299 129 186 140 3 47
8. Exports to Third Countries 93 27 5 2
9. Total Deliveries (6+7+8) 4,144 6,946 2,137 40 15,418 7,154 129 5,027 19,734 66,065 525 1,917 2,226 25,477
[image:50.842.61.781.100.416.2]* Including transformation for coke ** PCI Coal
Table 1
Supplies and Deliveries of Hard Coal in 2008 (Part 1)