Quadratic behavior of fiber Bragg grating
temperature coefficients
Gordon M. H. Flockhart, Robert R. J. Maier, James S. Barton, William N. MacPherson, Julian D. C. Jones, Karen E. Chisholm, Lin Zhang, Ian Bennion,
Ian Read, and Peter D. Foote
We describe the characterization of the temperature and strain responses of fiber Bragg grating sensors by use of an interferometric interrogation technique to provide an absolute measurement of the grating wavelength. The fiber Bragg grating temperature response was found to be nonlinear over the tem-perature range⫺70 °C to 80 °C. The nonlinearity was observed to be a quadratic function of temper-ature, arising from the linear dependence on temperature of the thermo-optic coefficient of silica glass over this range, and is in good agreement with a theoretical model. © 2004 Optical Society of America
OCIS codes: 060.0060, 060.2300, 060.2310, 060.2370, 060.2400, 230.1480.
1. Introduction
Bragg gratings are increasingly being used as optical fiber sensors for a wide range of applications,1
nota-bly for strain and temperature measurements. The transduction mechanism is the dependence of the re-flected Bragg wavelength on the measurand, and a compelling advantage is the compatibility of Bragg gratings with wavelength-division multiplexing. One of the primary physical parameters of interest is temperature, and fiber Bragg grating共FBG兲sensors have been demonstrated for a number of applica-tions.1
Extensive research has investigated the strain and temperature sensitivity of FBGs for use as optical
fiber sensors; however, the measured temperature and strain coefficients reported in the literature vary considerably. It is well known that the strain and temperature coefficients vary with wavelength2;
how-ever, the wavelength-normalized coefficients also
show a spread of values. The
wavelength-normalized strain coefficient is observed to range from 0.70⫻ 10⫺6ε⫺1 共Ref. 3兲 to 0.77⫻ 10⫺6ε⫺1
共Ref. 2兲 for FBGs at approximately 1550 nm; these differences could be due to variations in the strain-optic coefficients among different strain-optical fibers. Also, the wavelength-normalized temperature coeffi-cients cover a range of values from approximately 3⫻ 10⫺6K⫺1 共Ref. 4兲to 8⫻10⫺6K⫺1共Ref. 2兲for FBGs
with a nominal Bragg wavelength of ⬃1550 nm.
The type and concentration of the dopant used in the core of the optical fiber to increase its refractive index is known to affect the thermo-optic coefficient of the glass.5
Previous research has reported the nonlinear wavelength response as a function of temperature for FBGs at cryogenic temperatures owing to the nonlin-ear thermo-optic and thermal expansion coefficients of silica glass.6 – 8 A nonlinear temperature response
was also suggested in a study of the temperature dependence of type I and type IIa gratings in highly doped Ge fibers 共GeO2 concentration ⱖ20 mol. %兲
with and without hydrogen loading.9 However, the
authors observed a linear temperature response over the temperature range 296 –576 K; the nonlinear temperature response was indicated only by a single measurement at 77 K. The authors of Refs. 6 – 8 also reported measurements of hydrogenated single-mode When this research was performed, G. M. H. Flockhart, R. R. J.
Maier, J. S. Barton共[email protected]兲, W. N. MacPherson, and J. D. C. Jones were with the School of Engineering and Physical Sciences, Heriot-Watt University, Edinburgh EH14 4AS, UK. G. M. H. Flockhart is now with the Naval Research Laboratory, 4555 Overlook Avenue, S.W., Washington, D.C. 20375. When this research was performed, K. E. Chisholm, L. Zhang, and I. Bennion were with the Photonics Research Group, Electronic En-gineering and Computer Science Division, Aston University, Bir-mingham B4 7ET, UK. K. E. Chisholm is now with Indigo Photonics, Ltd., Faraday Wharf, Holt Street, Birmingham B7 4BB, UK. I. Read and P. D. Foote are with BAE Systems, Advanced Technology Centre, Sowerby Building, FPC 267, P.O. Box 5, Bris-tol BS12 7QW, UK.
Received 14 July 2003; revised manuscript received 24 Novem-ber 2003; accepted 9 February 2004.
telecommunication fiber 共SMF28 fiber兲 that sug-gested a nonlinear wavelength response; however, only three measurement points were presented over the temperature range 77–573 K. Therefore the or-igins of the nonlinearity were not clearly established; they may be previously reported nonlinearities at cryogenic temperatures6 – 8; alternatively, Flockhart et al.10 have observed changes in the temperature
sensitivity that are due to buffer-recoating effects. A nonlinear temperature response has also been ob-served over the very wide temperature range⬃20 °C to 1150 °C for type IIa FBGs in N2-doped silica
fi-bers.11 The dependence of temperature on
wave-length was observed to increase from 0.013 to 0.0175 nmK⫺1for a Bragg grating with a center wavelength
of⬃1550 nm at room temperature.
The reported nonlinear temperature dependence of the Bragg wavelength is most likely due to the tem-perature dependence of the thermo-optic coefficient, provided that any other nonlinearities in the reported experimental systems are accounted for. The tem-perature dependence of the thermo-optic coefficient was observed to be linear over the temperature range 20 °C to 220 °C at a wavelength of 633 nm in unbuf-fered single-mode fiber by measurement of the fringe shift in a Fabry–Perot共FP兲interferometer and a sep-arate measurement of the thermal expansion coeffi-cient.12 However, the magnitude of the average
thermo-optic coefficient is known to decrease at longer wavelengths13; it is therefore possible that the
temperature dependence of the thermo-optic coeffi-cient will also be different at longer wavelengths than for measurements at 633 nm. Thus it is desirable to carry out a direct experimental measurement of any nonlinear effect for FBG sensors at 1550 nm. In practical sensor systems the temperature response is often assumed to be linear near room temperature. A typical temperature range for some FBG sensing
and communications applications is ⫺70 °C to
⫹80 °C. Therefore, to permit accurate temperature or strain measurements to be performed, the wave-length dependence of the grating on temperature or strain must be well understood. In applications in which temperature is not the primary measurand of interest, the wavelength’s dependence on tempera-ture must be accurately known to allow suitable tem-perature compensation or discrimination to be made.14
In this paper we investigate the magnitude of the nonlinear wavelength response to temperature in de-tail over the wavelength range 1524 –1573 nm and over a temperature range of⫺70 °C to⫹80 °C. We describe two techniques for interrogation of the Bragg wavelength, and we compare our data with an existing model for thermo-optic coefficients of glasses as a means of explaining the nonlinear temperature response.15,16 One interrogation technique is based
on scanning interferometry for high-accuracy
wave-length measurement. This technique is based on
Fourier-transform spectroscopy, in which the signal is processed by use of Hilbert transforms,17,18
facili-tating accurate measurements of the temperature
and strain coefficients of an array of Bragg gratings. The second technique used is based on a system con-sisting of a scanning FP filter and a superlumines-cent broadband source at 1.55 m with a ⫺3-dB bandwidth of 40 nm. The gratings were all of type I,19but they had different strengths共refractive-index
modulation depth兲 and wavelengths 共⬃1550 nm兲. Our measurements show that the temperature re-sponse is nonlinear over the temperature range ⫺70 °C to⫹80 °C, with a maximum deviation from linearity of⬃35 pm, which is equivalent to an error of ⬃3.5 °C.
2. Interferometric Fiber Bragg Grating Interrogation
To investigate temperature and strain sensitivity we fabricated an array of three wavelength-division mul-tiplexed FBGs from 1524 to 1573 nm. The grating array was written into hydrogenated共200 bars for 20 MPa兲 single-mode Ge-doped telecommunications fi-ber by two-beam holographic exposure by use of a
frequency-doubled Ar-ion laser. The array
con-sisted of a high-reflectivity共⬃100%兲grating at 1524 nm, a low-reflectivity 共⬃37%兲 grating at 1549 nm, and a high-reflectivity共⬃100%兲grating at 1573 nm. The length of each grating was⬃6 mm; there was an ⬃1-mm separation between gratings. Immediately after inscription the grating array was recoated with DeSolite 950-200 splicing compound and annealed at 150 °C for 24 h to ensure the spectral stability of the gratings at the desired maximum operating temper-ature of 80 °C.
The grating array was housed in a purpose-built, automated temperature and strain test rig. The test rig was designed to simulate the environmental con-ditions that the gratings would experience in typical applications such as structural monitoring over a temperature range of⫺30 °C to⫹80 °C and a strain range of 0 –2000ε. The temperature-cycling test rig consisted of two cascaded Peltier heat pumps driven and controlled by a 40-W proportional, inte-gral, and derivative 共PID兲 thermoelectric controller 共Wavelength Electronics, Model LFI-3551兲. A large actively cooled heat sink was required for dissipating the heat transferred during cooling, thus allowing the low-temperature extreme to be achieved. The re-coating material was removed to eliminate any pos-sible thermal effects caused by the buffer material, as were previously observed.10 The FBG array was
lo-cated in a 1-mm-wide channel between two 2-mm-thick aluminum plates, which were instrumented with thermistors for the PID control, and three Class B platinum 100-⍀ resistance thermometers 共RTDs兲 for accurate temperature measurement across the plate. To ensure good thermal conductivity between the aluminum plates and the FBGs, the array was embedded in silicone grease with a thermal conduc-tivity of 0.16 W m⫺1 K⫺1; silicone grease was also
chosen to minimize any strain transfer between the
grease and the FBG array. The Peltier elements
wa-ter vapor at temperatures below the dew point, silica gel was used in the temperature-controlled chamber to provide a dry atmosphere.
The test rig was also designed to allow the fiber Bragg gratings to be strained. The optical fiber was clamped between two 0.75-mm-thick compliant sheets attached to brass plates. A clamping length of 15 mm was used, and, with sufficient clamping pressure, no slippage was observed during these ex-periments. One end of the fiber was clamped to a Melles-Griot Nanostepper translation stage, which was used to strain the FBG array longitudinally. The other end was clamped to a 2-kg load cell to monitor directly the load on the fiber. To determine the strain on the fiber from the applied load, one must know the Young modulus of the fiber; however, it is possible to calibrate directly the output of the load cell to the applied strain by measuring the load cell’s output versus the translation stage’s displacement for two different known lengths of fiber. Using this technique, we found the calibration constant to con-vert the load cell voltage output into applied strain to be 338.3⫾3εV⫺1.
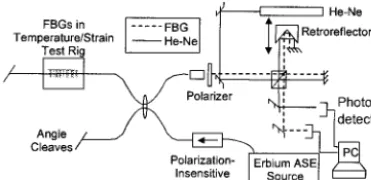
Fourier-transform spectroscopy was used to mea-sure the FBG’s amplitude spectra from all three
grat-ings simultaneously. The experimental setup is
shown in Fig. 1. Light from a broadband Er ampli-fied spontaneous emission 共ASE兲 source 关Pout ⫽ 15 dBm, 共⫺3dB兲 ⫽ 1527–1562 nm兴 illuminated the FBG array via a polarization-independent optical isolator and a wideband coupler共3-dB coupler with ⫾0.3-dB uniformity at 1550 ⫾ 40 nm兲. The FBG array was fusion spliced to one arm of the coupler, and the distal ends of the two coupler arms were angle cleaved to prevent Fresnel reflections from propagating back along the fiber. The light reflected from the gratings was collimated and launched into a scanning Michelson interferometer. In one arm of the interferometer a hollow retroreflector, mounted upon a Melles-Griot Nanostepper translation stage, folded the beam onto the end mirror. A He–Ne laser beam, ⫽1523.1 nm, propagated collinearly with the light from the gratings and was used to calibrate the optical path difference共OPD兲scan to provide an ab-solute wavelength reference for the measurements. An OPD scan of 87.4 mm, corresponding to 218
sam-ples, was used for the Fourier transform, thus giving a spectral resolution of 27.5 pm at 1550 nm; however the Bragg wavelengths were demodulated with
bet-ter resolution when Hilbert transform signal process-ing was used.17
3. Results and Discussion
A. Temperature Characterization
A temperature range of⫺30 °C to 80 °C was investi-gated. Narrow-range thermistors were used to im-prove the thermal stability of the PID control loop; therefore the temperature range was split into three subranges: ⫺30 °C to 5 °C, 7.5 °C to 42.5 °C, and 45 °C to 80 °C. Three repeated temperature cycles were carried out in each subrange by use of a tem-perature interval of 2.5 °C and a settling time of 15 min to allow the aluminum plates and the FBGs to achieve thermal equilibrium.
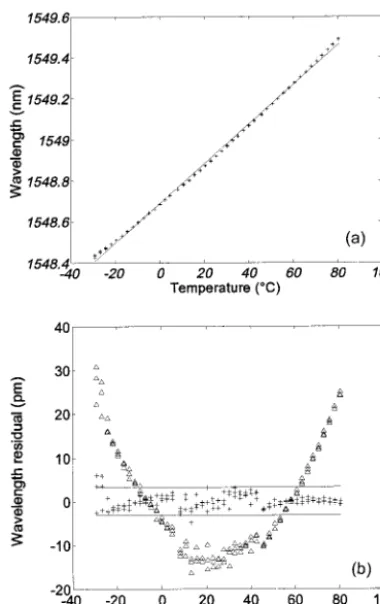
At each temperature set point an interferogram was acquired and the temperature was measured by both a Pt RTD and a thermistor. The standard de-viation of the thermistor temperature measurements at each set point was approximately 0.05 °C, indicat-ing good thermal stability. The interferograms were recalibrated with the superimposed reference He–Ne interferometer, and a Fourier transform was applied, resulting in the amplitude spectra of the FBGs. The FWHM of the three gratings’ spectra were measured to be 0.8, 0.2, and 0.9 nm for the 1524-, 1549-, and 1573-nm gratings, respectively. Bragg wavelength can be calculated by a number of techniques such as peak detection and curve fitting; however, the spectra of the strong gratings are not ideally suited to either of these techniques, as they exhibit a flat-topped re-sponse. Therefore the center wavelength of each grating was calculated by the Hilbert transform tech-nique.10 The measured temperature response for
the 1549-nm FBG is shown in Fig. 2. For each grat-ing a linear least-squares共LSQ兲fit was made to the measured temperature response and the residual to the fit was calculated; the residual for the 1549-nm FBG is shown in Fig. 2共b兲. The residual clearly shows higher-order structure, and similarly shaped residuals were also observed for the 1524- and 1573-nm FBGs in the array.
Second-order polynomial LSQ fits were made of the measured temperature responses, and the residuals to the fits were calculated. The residual to the second-order fit for the 1549-nm FBG is shown in Fig. 2共b兲. The residuals showed no higher-order struc-ture present and showed a general scatter about zero, thus indicating a good fit. Regression analysis was used to determine the standard errors of the fit and to calculate 95% confidence belts for the fit; these values are also shown in Fig. 2共b兲to indicate the quality of the fit and the magnitude of the observed scatter. The coefficients and the standard errors of the coef-ficients were calculated from the least-squares fits and are listed in Table 1. TheR2 regression
[image:3.612.77.263.42.132.2]the Bragg wavelength. This indicates the dispersive nature of the thermo-optic coefficient; however care must be taken, as the magnitude of this increase for the second-order term for the 1549- and 1573-nm FBGs can be accounted for by the error of the fitted coefficient.
Possible experimental causes of the nonlinearity have been identified as FBG convolution with the source spectrum, nonlinear temperature measure-ment, presence of a temperature gradient across the aluminum plate in the test rig, and an artifact of signal processing. We believe that these causes can all be eliminated. First, as all three FBGs lie in different regions of the source spectrum, the convo-lution will be different for each one. Although the measured spectra of the 1524- and 1573-nm FBGs are affected by the slope of the source spectrum, the change in the convolution as the FBG spectrum moved with temperature was investigated and found
to have a negligible effect on the measured tempera-ture response. The source spectrum was nearly flat for the 1549-nm FBG; thus it had a minimal affect on
the measured wavelength. Second, the measured
temperature response was similar for Pt RTDs and thermistors; the thermistors used for this research had a large negative thermal coefficient, the opposite of the Pt RTD response. The effect due to the pres-ence of a temperature gradient across the plate can also be eliminated. Each grating has a different physical location within the plates and thus experi-ences a slightly different temperature. At the low-and high-temperature extremes the two gratings nearer the edges of the plates will experience a tem-perature closer to the ambient temtem-perature. If this difference is significant a residual of a different form from that observed would be produced; also, the 1549-nm FBG, which is located centrally within the aluminum plates, would be least affected by any tem-perature gradient. Finally, signal processing can be eliminated as a cause of nonlinearity, as the calcu-lated wavelengths for the strain cycling experiments, which are detailed below, do not show the same re-sidual. The quadratic residual is therefore believed to be due to a nonlinear temperature response of the grating.
B. Secondary Experiment
To confirm the observed nonlinearity we performed an independent experiment on a single FBG, using a different wavelength interrogation technique and
a different temperature cycling setup. The FBG
was fabricated in SMF28 fiber with a center Bragg wavelength of 1557 nm, a FWHM of 0.3 nm, and a
reflectivity of ⬃50%. The FBG was immersed in
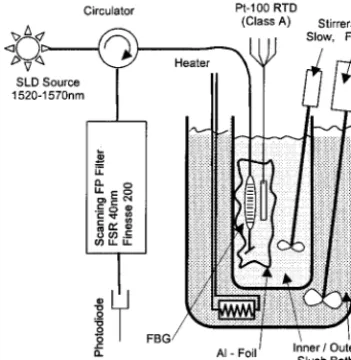
an isopropanol共IPA兲and dry-ice slush bath, which allowed a low-temperature extreme of⫺70 °C to be reached. To ensure absolute strain-free mounting, we held the fiber at a single location just short of the FBG, with the remaining short length of fiber float-ing in the bath. A schematic of the experimental
setup is shown in Fig. 3. A two-stage bath was
used, with the outer bath stirred strongly to ensure homogeneous temperature distribution and the in-ner bath stirred gently to minimize convection
cur-rents. A small heater was used to raise the
temperature of the outer slush bath. The FBG and a Pt RTD located in close proximity to the FBG were wrapped into a thin Ai foil to minimize local
tem-perature gradients. The FBG was illuminated by
[image:4.612.73.263.39.341.2]a superluminescent diode source 关SLD; Pout ⫽ 8.5 dBm,共⫺3dB兲⫽ 1520 –1570 nm兴via an optical fiber Fig. 2. 共a兲Temperature response of the 1549-nm FBG:
mea-sured wavelength shift共crosses兲and LSQ fit 共solid curve兲. 共b兲 Residual to the linear fit共triangles兲and second-order fit共crosses兲 with 95% confidence belts.
Table 1. Calculated Coefficients and Standard Errors for LSQ Second-Order Fits to the FBGs’ Temperature Responses and theR2Regression Coefficients
⬃FBG共nm兲 a⫻10⫺6共nm K⫺2兲 b⫻10⫺3共nm K⫺1兲 c共nm兲 R2
1524 12.22⫾0.14 8.8049⫾0.0082 1523.98598⫾0.00017 0.999976
1549 12.73⫾0.15 9.0103⫾0.0086 1548.68187⫾0.00018 0.999974
[image:4.612.47.549.664.717.2]circulator; light reflected from the grating was passed back through the circulator to a FP filter 共Queensgate DMC 300兲. The FP filter 关free spec-tral range共FSR兲, 40 nm; finesse, 200兴was temper-ature stabilized to⫾0.1 °C.
With this experimental configuration the temper-ature is not actively controlled but changes slowly; the heater is used to raise the temperature of the slush bath above ambient. The duration of the wave-length scan of the FP filter across the grating spec-trum is typically 3 s, and the temperature of the Bragg grating during the scan is measured with the Pt RTD. A second-order polynomial, fitted to the convolved spectrum above the⫺3-dB level, is used to calculate the centroid location of the Bragg reflection
peak. The measured temperature response of the
FBG from⫺70 °C to 75 °C is shown in Fig. 4. As in the previous experiment described above, a linear LSQ fit was made to the measured temperature re-sponse and the residuals to first- and second-order fits were calculated and are shown in Fig. 4共b兲. As in the principal experiment, the residual to the first-order fit clearly shows higher-first-order structure of a quadratic nature. A second-order fit confirms this; however, further structure is still evident, but this is due to a temperature variation between the FBG and the Pt RTD when the temperature of the heater was changed. The cause of the temperature variation is the different thermal time constants of the two sen-sors as a result of their different sizes; the thermal time constant of the FBG is much less than that of the Pt RTD.
The observation of the quadratic temperature re-sponse with this secondary experiment confirms our initial observation, and the nonlinearity was not an artifact of our experimental system. For most sens-ing applications the temperature response of FBGs is assumed linear over this temperature range; how-ever, this nonlinearity cannot be neglected for sens-ing systems that require measurement accuracies
better than ⫾35 pm, as indicated by the deviation from linearity shown in Fig. 4.
C. Model of the Thermo-Optic Coefficient
We have applied a model developed by Ghosh to ex-plain the behavior of the thermo-optic coefficient共dn兾
dT兲 of optical glasses; this model was applied to silicate glasses15 and to standard optical glasses.16
The model of standard optical glasses is based on measurements of the thermo-optic coefficient and the thermal expansion of four National Institute of Stan-dards and Technology standard reference material glasses.20 One of these materials is silica, which is
the main host material used in the fabrication of optical fibers. The model developed by Ghosh is based on the temperature dependence of the excitonic bandgap, an isentropic bandgap, and the thermal ex-pansion coefficient of the glass. Ghosh considers the thermo-optic coefficient to be dependent on both elec-tronic transitions and optical phonons. The thermo-optic coefficient is described by16
2n dn
dT⫽共n0
2⫺1兲
冉
⫺3␣R⫺ 1 EegdEeg
dT R
2
冊
, (1)wheren0is the low-frequency refractive index in the infrared region,␣is the coefficient of thermal expan-Fig. 3. Experimental setup for the secondary temperature
[image:5.612.329.519.39.340.2]char-acterization experiment.
[image:5.612.80.256.43.223.2]sion,Eegis the excitonic bandgap, andRis the nor-malized dispersive wavelength, defined by
R⫽
2
共2⫺ ig2兲
, (2)
whereig2is the wavelength that corresponds to the
isentropic bandgap,Eig. This bandgap has been
ob-served to be unaffected by changes in temperature,21
whereas the excitonic bandgap decreases with tem-perature. Equation共1兲shows that the thermo-optic coefficient depends on two terms; the first describes the contribution from the thermal expansion coeffi-cient and the second describes the contribution from
the temperature dependence of the excitonic
bandgap. The first term is negative for silica, as the thermal expansion coefficient is positive within the temperature range that we are interested in. The contribution of this term is small, as the magnitude of ␣is of the order of 10⫺6K⫺1. However, the temper-ature variation ofEegis of the order of 10⫺4eV K⫺1
and is normally negative for glasses.21 The
contri-bution from the second term is therefore positive and is the dominant term, resulting in a positive
thermo-optic coefficient. By analysis of experimental
refractive-index data, Ghosh calculated the temper-ature dependence of Eeg and observed a nonlinear response, with dEeg兾dTdecreasing linearly with
tem-perature; he calculated dEeg兾dT over the tempera-ture range⫹25 °C to⫹115 °C.
Using the model and data presented by Ghosh,16
we calculated the change in the thermo-optic coeffi-cient with temperature over a temperature range of ⫺30 °C to⫹80 °C for the three grating wavelengths. We assumed that the linearity of dEeg兾dT extends from 25 °C to⫺30 °C, and the thermal expansion was assumed to be constant. The refractive index at each grating wavelength was calculated by use of temperature-dependent Sellmeier coefficients for fused silica.22 We then calculated the change in the
grating’s wavelength over the experimental
temper-ature range, using the temperature-dependent
[image:6.612.330.520.39.341.2]thermo-optic coefficient, and the effective refractive index of the grating was assumed constant over the small wavelength change of the grating.
Figure 5共a兲shows the theoretical change in wave-length calculated from the model and the experimen-tal results for the 1549-nm FBG. To allow a graphic comparison of the residual to be made, as in the ex-perimental measurements, we made a linear LSQ fit to the modeled data and calculated the residual, which is shown in Fig. 5共b兲. Excellent correlation can be observed between the change in wavelength with temperature and the shape and magnitude of the residual to a linear LSQ polynomial fit. A small variation in sensitivity can be observed between the measured and the modeled data; however, the non-linearity of the temperature response agrees well with the experimental data. The variation in the sensitivity could be due to a difference between the thermal expansion coefficient used for the model and that of the fiber. The modeled data are also based on
experimental measurements of the refractive index and the thermo-optic coefficient of fused silica; how-ever, the core of the optical fiber is not pure fused silica but is doped to increase the refractive index. The exact core composition was not known. The Ge dopant will affect the thermo-optic coefficient; how-ever, the dopant concentration is typically small 共⬍5%兲; therefore the temperature response of the op-tical fiber is assumed to be comparable to that of fused silica.
Fig. 5. 共a兲Temperature response of the 1549-nm FBG: mea-sured wavelength change共crosses兲and modeled data共solid curve兲. 共b兲Residual to the linear fit of experimental共triangles兲and mod-eled共solid curve兲data.
[image:6.612.337.514.544.685.2]We also applied the model to the measured wave-length response, using the secondary experiment over the extended temperature range of ⫺70 °C to 75 °C. As before, linear LSQ fits were made to the experimental data and the modeled data. The re-siduals to these fits show excellent correlation and are shown in Fig. 6.
D. Strain Characterization
The strain response of the FBGs in the array was also investigated. A Melles-Griot Nanostepper transla-tion stage was used to strain the fiber, and the load on the fiber was measured directly with a 2-kg load cell. The measured load was converted to strain by use of a calibration constant of the load cell that was previ-ously measured. The temperature in the test rig was held constant at 20 °C, and the strain response was investigated over the range 0 –2000 ε. The temperature stability was measured to be⫾0.01 °C,
which corresponds to an equivalent strain error of ⬃0.1 ε. The strain responses of the 1524- and 1549-nm FBGs are shown in Fig. 7. As in the anal-ysis of the temperature experiments, a linear LSQ fit was made to the strain response and the residual to the fit was calculated. The magnitude of the resid-uals is greatly reduced, although some structure is present; however, in general the residuals show an excellent repeatability, to within less than 5 pm. The residual for the 1524-nm FBG shown in Fig. 7共a兲 exhibits little structure, and the rms deviation of the LSQ fit is 0.57 pm, which suggests that the measure-ment technique is capable of subpicometer resolution. Regression analysis based on the linear LSQ fits was performed, and the calculated coefficients are listed in Table 2. TheR2regression coefficient is approx-imately 1 for each strain response, indicating an ex-cellent fit; this is also reflected in the small magnitude of the calculated standard error for each coefficient. The wavelength-normalized strain coef-ficients were calculated to be 0.81⫻10⫺6ε⫺1for all
three FBGs in the array.
4. Conclusions
We have used Fourier-transform spectroscopy to pro-vide absolute wavelength measurements to charac-terize the wavelength changes in fiber Bragg gratings with applied temperature or strain. We performed two independent experiments to investigate the lin-earity of the temperature response over a tempera-ture range of⫺70 °C to 80 °C, which typically may be encountered by FBG sensors in a range of applica-tions. These experiments showed that a simple
lin-ear temperature coefficient is insufficient to
represent Bragg wavelength shifts over relatively modest temperature ranges. The effect is ⬃20-pm deviation from linearity, equivalent to a 2 °C error over the temperature range ⫺30 °C to 80 °C, and ⬃35-pm deviation for an extended temperature range of ⫺70 °C to 80 °C, which hence is not negligible. The measured nonlinearity is consistent with Ghosh’s model of the temperature dependence of the thermo-optic coefficient of silica glass, which predicts a quadratic term in the Bragg wavelength shift as a function of temperature and is in very good agree-ment with the observations. To our knowledge this is the first report of the use of this model to explain the nonlinear temperature response of a FBG. We have also characterized the strain response of three
FBGs spanning 1524 –1573 nm. The measured
[image:7.612.72.267.37.357.2]wavelength change was observed to be linear with applied strain, and the wavelength-normalized strain sensitivity was measured to be 0.81⫻10⫺6ε⫺1. Fig. 7. 共a兲Strain response of the 1524-nm FBG and共b兲residual to
the linear fit. 共c兲Response of the 1549-nm FBG and共d兲residual to the linear fit.
Table 2. Linear Regression Analysis of Strain Response of a FBG Array for 1524-, 1549-, and 1573-nm FBGs
FBGε⫽0共nm兲 Sensitivity共pmε⫺1兲 R2 共
1兾兲共⌬兾⌬ε兲 共⫻10⫺6ε⫺1兲
1524.16354⫾0.00014 1.22881⫾0.00013 0.9999993 0.8062
1548.86369⫾0.00023 1.25087⫾0.00021 0.9999980 0.8076
[image:7.612.47.549.653.718.2]The authors acknowledge provision of funding by the UK Engineering and Physical Sciences Research Council and the provision of a studentship by BAE Systems, through the Co-operative Awards in Science and Engineering scheme, for G. M. H. Flockhart, R. R. J. Maier acknowledges support from AWE plc.
References
1. Y. J. Rao, “Recent progress in applications of in-fibre Bragg grating sensors,” Opt. Lasers Eng.31,297–324共1999兲. 2. G. P. Brady, K. Kalli, D. J. Webb, D. A. Jackson, L. Reekie, and
J. L. Archambault, “Simultaneous measurement of strain and temperature using the first- and second-order diffraction wavelengths of Bragg gratings,” IEE Proc. Optoelectron.144,
156 –161共1997兲.
3. D. R. Hjelme, L. Bjerkan, S. Neegard, J. S. Rambech, and J. V. Aarsnes, “Application of Bragg grating sensors in the charac-terization of scaled marine vehicle models,” Appl. Opt. 36,
328 –336共1997兲.
4. K. Sugden, L. Zhang, J. A. R. Williams, R. W. Fallon, L. A. Everall, K. E. Chisholm, and I. Bennion, “Fabrication and characterization of bandpass filters based on concatenated chirped fiber gratings,” J. Lightwave Technol.15,1424 –1432 共1997兲.
5. G. Ghosh, “Temperature dispersion of refractive-indexes in some silicate fiber glasses,” IEEE Photon. Technol. Lett.6,
431– 433共1994兲.
6. S. Gupta, T. Mizunami, T. Yamao, and T. Shimomura, “Fiber Bragg grating cryogenic temperature sensors,” Appl. Opt.35,
5202–5205共1996兲.
7. M. B. Reid and M. Ozcan, “Temperature dependence of fiber optic Bragg gratings at low temperatures,” Opt. Eng.37,237– 240共1998兲.
8. S. W. James, R. P. Tatam, A. Twin, M. Morgan, and P. Noonan, “Strain response of fibre Bragg grating sensors at cryogenic temperatures,” Meas. Sci. Technol.13,1535–1539共2002兲. 9. A. Hidayat, Q. Wang, P. Niay, M. Douay, B. Poumellec, F.
Kherbouche, and I. Riant, “Temperature-induced reversible changes in spectral characteristics of fiber Bragg gratings,” Appl. Opt.40,2632–2642共2001兲.
10. G. M. H. Flockhart, R. McBride, W. N. MacPherson, J. D. C. Jones, K. E. Chisholm, L. Zhang, I. Bennion, I. Read, and P. D. Foote, “Application of Hilbert transforms to high resolution strain and temperature characterisation of fibre Bragg grating
sensors,” in 14th International Conference on Optical Fiber Sensors, A. G. Mignani and H. C. Lefe`vre, eds., Proc. SPIE
4185,25–28共2000兲.
11. O. V. Butov, K. M. Golant, and I. V. Nikolin, “Ultra-thermo-resistant Bragg gratings written in nitrogen-doped silica fi-bres,” Electron. Lett.38,523–525共2002兲.
12. T. S. Priest, K. T. Jones, G. B. Scelsi, and G. A. Woolsey, “Thermal coefficients of refractive index and expansion in op-tical fibre sensing,” inOptical Fiber Sensors, Vol. 16 of 1997 OSA Technical Digest Series 共Optical Society of America, Washington, D.C., 1997兲, Paper OWC41.
13. T. Toyoda and M. Yabe, “The temperature dependence of the refractive indices of fused silica and crystal quartz,” J. Phys. D Appl. Phys.16,L97–L100共1983兲.
14. F. M. Haran, J. K. Rew, and P. D. Foote, “A strain-isolated fibre Bragg grating sensor for temperature compensation of fibre Bragg grating strain sensors,” Meas. Sci. Technol. 9,
1163–1166共1998兲.
15. G. Ghosh, “Temperature dispersion of refractive-indexes in some silicate fiber glasses,” IEEE Photon. Technol. Lett.6,
431– 433共1994兲.
16. G. Ghosh, “Model for the thermo-optical coefficients of some standard optical glasses,” J. Non-Cryst. Solids189,191–196 共1995兲.
17. D. A. Flavin, R. McBride, and J. D. C. Jones, “Short-scan interferometric interrogation and multiplexing of fibre Bragg grating sensors,” Opt. Commun.170,347–353共1999兲. 18. K. B. Rochford and S. D. Dyer, “Demultiplexing of
interfero-metrically interrogated fiber Bragg grating sensors using Hil-bert transform processing,” J. Lightwave Technol.17,831– 836 共1999兲.
19. R. Kashyap,Fiber Bragg Gratings共Academic Press, San Di-ego, Calif., 1999兲.
20. J. M. Jewell, “Thermooptic coefficients of some standard ref-erence material glasses,” J. Am. Ceram. Soc.74,1689 –1691 共1991兲.
21. J. Matsuoka, N. Kitamura, S. Fujinaga, T. Kitaoka, and H. Yamahita, “Temperature-dependence of refractive-index of SiO2glass,” J. Non-Cryst. Solids135,86 – 89共1991兲.