EUROPEAN COMMISSION
Brussels, 16.4.2012 SWD(2012) 85 final
COMMISSION STAFF WORKING DOCUMENT
Progress on equality between women and men in 2011
Accompanying the document
Report from the Commission to the European Parliament, the Council, the Economic and Social Committee and the Committee of the Regions
2011 Report on the application of the EU Charter of Fundamental Rights
Content
Part I: Progress on equality between women and men in 2011... 3
1. Introduction... 3
2. Equal economic independence... 3
3. Equal pay for equal work and work of equal value... 8
4. Equality in decision-making... 9
5. Dignity, integrity and ending gender-based violence... 13
6. Gender equality in external actions... 15
7. Horizontal issues... 16
Part II: Graphs and tables... 17
1. Graphs... 18
Part I: Progress on equality between women and men in 2011
1. INTRODUCTION
In 2011, hit by a financial, economic and social crisis, the everyday lives of many European citizens, men and women, have been profoundly changed and the European Union is still facing one of its greatest challenges. The crisis and the responses to the crisis have had different impacts on women and men. As there is high pressure to fight the economic downturn, progress towards gender equality risks being considered as an objective that can be postponed. However, the equal treatment of women and men should be understood as contributing to economic success.
The present Report on progress on equality between women and men is a part of the Strategy for equality between women and men (2010-2015)1. For the first time, this year it is annexed to the Communication on the Application of the EU Charter of Fundamental Rights. It provides an overview of the performance and activities organised at EU level in 2011 in the five areas of the Strategy namely: equal economic independence; equal pay for equal work and work of equal value; equality in decision-making; dignity, integrity and ending gender-based violence, and gender equality in external action policy. The following dimensions are emphasised:
– the economic and business case for gender equality,
– the efforts made to promote gender equality in the follow-up to the Europe 2020 strategy, – the consequences of the crisis and recovery measures for women and gender equality, – the advantage of tackling the gender pay gap at EU level, both for economic growth and
meeting poverty targets,
– the economic case for promoting a balanced representation of women and men in economical decision-making,
– the human and economic costs of violence,
– the EU's clear commitment to gender equality when dealing with third countries and international organisations.
In what follows, these aspects are illustrated by examples of actions carried out at EU level and by Member States individually. The report also provides the most recent EU comparable statistics enabling an overview of the situation for women and men, the changes occurring over time, and remaining gender gaps in the European Union.
2. EQUAL ECONOMIC INDEPENDENCE
With an employment rate reaching 75.1% for men and 62.1% for women2 (Figure 1), it is broadly agreed that the EU can only reach the Europe 2020 headline target (75% of the population aged 20-64 should be employed by 2020) if there is a clear commitment to gender
1
COM(2010) 491 final.
equality. Twelve EU Member States3 have already reached the target which has been set for male employment; however, when it comes to women, the vast majority of Member States have still not reached the 75% target.
Figure 1: employment and unemployment rates (women and men aged 20-64) in EU Member States – 2000-2010
Men's employment rates
Women's employment rates
Men's unemployment rates
Women's unemployment rates
0 10 20 30 40 50 60 70 80 90
2000 2001 2002 2003 2004 2005 2006 2007 2008 2009 2010
perc
ent
Source: Eurostat, Labour Force Survey (LFS), annual averages.
Europe 2020 target for employment t
Moreover, if employment is measured in full-time equivalent4, figures show that, in several countries, less than half of the female workforce is employed. The availability of childcare services seems to play an important role (Figure 2) in determining these figures.
3
Sweden, Denmark, Netherlands, Germany, Czech Republic, Cyprus, Luxembourg, Malta, Austria, Portugal, UK, Greece.
4
Figure 2: Female employment and coverage of childcare services 30 35 40 45 50 55 60 65 70 75 EU2 7
CZ PL SK RO HU BG MT AT LT GR LV DE IE CY EE IT FI SI BE LU UK ES PT FR NL SE DK
Female employment rate %
(15-6 4 ) 0 10 20 30 40 50 60 70 80
Source: EU-silc 2009, LFS 2010
C
o
v
e
rage of c
h ilc a re s e rv ices (% of childr
en aged 0-3)
Employment rates in full time equivalent (15-64) Female employment rates (15-64) Coverage of childcare services
Employment rates of migrant women are not only substantially lower than the average employment rate, but are also lower than the employment rates of migrant men. The latter is what motivated the Commission, in its European Agenda for the Integration of Third-Country Nationals, to call on Member States to address the specific needs of migrant women, promote their participation in the labour market and strengthen their economic independence5.
2.1. Second earners
In 2011, the EU launched the first European Semester and adopted its first Annual Growth Survey6, anchored in the Europe 2020 Strategy. It highlighted the worryingly low labour market participation rate of second earners (the spouse who earns less in two-earner couples). Indeed, in many Member States, financial disincentives such as tax and benefit systems combined with excessive childcare costs make it more attractive for the spouse with relatively lower earnings (who tend in general to be women, as can be seen in Figure 3) to choose between either inactivity or limited activity. The labour supply of spouses is interconnected and married women's decision to enter the labour market is often influenced by the total income of the household. As a result, women may enter or leave the workforce depending on family income needs. They are consequently more sensitive to policies affecting their participation in the labour market than policies addressing hours of work.
5
COM(2011) 455 final: European Agenda for the Integration of Third-Country Nationals.
Figure 3: Secondary and primary earners in Europe.
Percentage distribution of couples by share of female earnings, 2009*
0% 20% 40% 60% 80% 100%
MT NL AT LU GR ES IE CZ IS DE IT CY UK BE NO SE SK EE PL FR FI RO LV BG DK LT HU SI
Woman the only earner
Woman earns more than man
Equality in earnings
Woman has no earnings or earns less than man
* Woman earns less/more than man if her income is below 45% / above 55% of the joint income in the couple. Only couples with at least one working partner are considered. Couples in which at least one partner is self-employed or retired are excluded. Source: Bettio and Verashchagina, University of Siena, using EU-SILC 2009, income data for 2008.
On 7 June 2011, in the context of the Europe 2020 Strategy, the Commission made country-specific suggestions for Council recommendations7. The Commission, when addressing Member States, placed the emphasis on taking the necessary measures in order to:
– promote a reconciliation of work and private life by providing available and affordable childcare services,
– enable access to more flexible working arrangements,
– establish adequate tax and benefit systems in order to enhance female participation rates.
The Commission took stock of the progress made when implementing country specific recommendations, first at EU level in the Annual Growth Survey 2012 adopted in November 20118, and then for each Member State in the set of guidelines for next year.
7
In accordance with Article 121 and 148 of the TFEU.
8
2.2. Pensions
When pension systems were initially developed, men spent a lifetime in the labour market and women mostly stayed home. The resulting income inequality in pensions was addressed by allowing wives to draw on their husbands'
contributions. Over recent decades, women have entered the labour market in great numbers. However, inequalities remain and those have an impact on the adequacy of their pensions. Women are more likely than men to be outside the labour market at any age, to work part-time or under atypical contracts. Career breaks often lead to a reduction in lifetime earnings10 and on average women earn less than men. For all these reasons, women pensioners typically have lower pension benefits than male pensioners.
Demographic changes in Europe (an ageing population and a shrinking working population) and the financial and economic crises have created a major challenge for the future of pension systems. An important trend in recent pension reforms in Member States is to try and improve the financial sustainability of pensions systems by tightening the link between contributions and benefits in earnings-related pension schemes. This is done mainly through the lengthening of contribution periods required to qualify for a full pension and by changing the reference for the calculation of benefits from "best years" to lifetime earnings. As a consequence, pension benefits will increasingly depend upon the workers' entire career.
In parallel, the gender pay gap leads to negative consequences on the reference salary generally used when the statutory pension is calculated. This impedes women from contributing to complementary retirement savings.
2.3. Reconciliation between work and private life.
Reconciling work, family and private life is still a great challenge for many European women. The labour market participation of mothers is 12.1 percentage points lower than that of women without children, while the rate for fathers is 8.7 percentage points higher than that for men without children. There was limited progress in the negotiations following the proposal for a Directive amending Directive 92/85/EEC (Pregnant Workers Directive). The European Parliament, in its first reading report adopted in 2010, proposed – among other things – to raise the length of maternity leave up to 20 fully paid weeks and to introduce a two weeks fully paid paternity leave. This has brought many Member States to oppose the proposal. The Council has not yet adopted its first reading position.
9
Gender Pension Gap. Developing an indicator measuring fair income opportunities for women and men. German Federal Ministry for Families, Elderly, Women and Youth, January 2012.
10
Projections carried out by DG ECFIN estimated that the effect of a three-year long career break for childcare on pension benefits is much larger than the effect of a three-year long unemployment spell in a few Member States.
According to a German study9 the
Reconciliation between work and care obligations not only concerns parents of small children. Challenges are noticeable through the life-cycle. In some Member States, elderly workers retire earlier so as to help their adult children in raising their families. Women with grand-children and elderly relatives therefore require special attention.
The Council conclusions on the "reconciliation of work and family life as a precondition for equal participation in the labour market"11 were adopted under the Polish Presidency, in the framework of the Review of the Implementation of the
Beijing Platform for Action. In this context, a report12 prepared by the European Institute for Gender Equality (EIGE) underlines that increases in childcare services and fathers’ take-up of parental leave have a positive bearing on the labour supply for main carers, who are usually women. Both measures promote a better share of gender-equal unpaid care work. However, changes in the labour-market (from industry to services) and short-term macroeconomic developments may increase the share of female primary earners.
3. EQUAL PAY FOR EQUAL WORK AND WORK OF
EQUAL VALUE
The pay gap between women and men is slowly narrowing but remains high. Figure 4 shows that on average, women earn 16.4%13 less than men for every hour worked with considerable variations among Member States. The gender pay gap (GPG) is caused by multiple factors14, such as labour market segregation and differences in work patterns. Differences in educational choices and biased evaluation and pay systems also play a role.
11
Annexed to Council conclusions (7166/11).
12
EIGE 2011: Review of the Implementation of the Beijing Platform for Action: Women and the Economy.
13
Eurostat 2010.
14
Information on the causes of the gender pay gap is available in the Communication "Tackling the pay gap between women and men" (COM(2007) 424 final) or on the European Commission website:
In 2011, Bulgaria passed a law amending the Labour Code. The law foresees equal rights and opportunities for distance workers and gives a legal definition of distance work.
Figure 4: Pay gap between women and men in unadjusted form in EU Member States - 2010
16,4
0 5 10 15 20 25 30
EE CZ AT DE EL CY SK UK FI NL HU LV ES EU-27
DK FR SE BG LT PT IE RO LU BE MT IT SI PL
Perc
ent
Source: Eurostat. The unadjusted Gender Pay Gap (GPG) represents the difference between average gross hourly earnings of male paid employees and of female paid employees as a percentage of average gross hourly earnings of male paid employees. EE and EL: data from 2008. EU27, BE, IE, ES, FR, IT, CY, AT: provisional data.
The EU-wide information campaign on the GPG launched in March 2009 was continued throughout 2011. Building on previous achievements, results and the experience gained during the two previous years of implementation, the current phase of the campaign further develops awareness-raising activities. The first European Equal Pay Day took place on 5 March 2011. The date marked the 64 days women had to work more in 2010 to earn a man’s average annual pay. The European Equal Pay Day will be held each year and the date will change according to the latest GPG figure. In 2012, Equal Pay Day fell on 2 March. The European Commission is planning a two-year communication campaign aimed at attracting and retaining more women in scientific careers, at showing them that they can have a successful career and that science can benefit from a higher participation of women.
In Austria,since 1 March 2011 companies are obliged to present an income report. Since 1 January 2011 there is an obligation to indicate the minimum wage and, where appropriate, the possibility of overpayment in job announcements. A consequence of contravening these regulations is a first warning fine of up to 360 €. A Salary Calculator15 was made available to the public on the website of the minister of women and civil service to compare the salary for women and men on average.
4. EQUALITY IN DECISION-MAKING
The equal participation of women and men in decision-making processes and positions is a prerequisite for the advancement of women and the achievement of substantive gender equality. It is recognised as a necessary basis for effective democracy and good governance in all fields. Even though progress has been made, the underrepresentation of women continues
to be an area of concern in many EU Member States. The situation varies between them and is very often worse in the corporate world.
4.1. More women on corporate boards as an economic and business imperative
In January 2012, only 13.7% of board seats of EU Member States' largest publicly listed companies16 were filled by women (Figure 5). The pace of progress has been slow, though there has been an improvement of 1.9 percentage points compared to the EU average in 2010. The underrepresentation of women in leadership positions constitutes an untapped potential source of highly qualified human resources as evidenced by the discrepancy between the high number of female graduates and their absence from top-level positions. The Europe 2020 Strategy for smart, sustainable and inclusive growth leans on knowledge, competences and innovations, i.e. human capital. One of the ways of improving Europe's competitiveness is the equal representation of women and men in economic decision-making positions, which contributes to a more productive and innovative working environment and helps improve performance. In addition, there is an increasing body of research showing that gender diversity pays off and that there is a positive correlation between women in leadership and business performance17.
Moreover, a large majority of European citizens (88%) believe that, given that women are equally competent, they should be equally represented in positions of leadership and 75% are in favour of legislation that would ensure a more balanced representation between women and men (under the condition that qualification is taken into account without automatically favoring one of either gender)18.
2011 was an important year for gender equality in corporate boardrooms. Vice-President Reding, Commissioner for Justice, Fundamental Rights and Citizenship challenged business leaders to increase women’s presence on corporate boards by self-regulation. The goal is 30% women on the boards of the major European companies in 2015 and 40% by 2020. All EU publicly listed companies were asked to sign the "Women on the Board Pledge for Europe"19 and to develop their own ways of getting more women into top jobs. A number of ministers
and organisations supported this call for action, encouraging national listed companies to make more efforts to increase women's representation on their boards by signing the Pledge. The European Parliament supported the Commission's approach through a resolution adopted in July 201120. In addition, four EU Member States (France, the Netherlands, Italy and Belgium) have adopted binding measures to improve the situation. Other Member States have encouraged self-regulatory measures.
16
Source: European Commission database on women and men in decision-making. The data on companies cover the largest (by market capitalization) nationally registered constituents of the blue-chip index maintained by the stock exchange in each country. In countries with unitary (one-tier) systems, the board of directors is counted (including non-executive and executive members). In countries with two-tier systems, only the supervisory board is counted.
17
Catalyst, McKinsey & Company, Lord Davies report, etc.
18
Special Eurobarometer 376 – Women in decision-making positions, September 2011.
19
Available at: http://ec.europa.eu/commission_2010-2014/reding/womenpledge.
Figure 5: Share of women and men members of the highest decision-making body of the largest publicly listed companies, 2012
13,7 86,3
0 10 20 30 40 50 60 70 80 90 100
FI LV SE FR NL DK BG DE UK CZ SI LT EU-27
SK PL ES AT BE RO IE EL EE IT PT LU HU CY MT
perc
ent
Men Women
Source: European Commission, Database on women and men in decision-making. Data were collected in January 2012 The list of the largest publicly quoted companies is based for each country on current membership of blue-chip index. In countries for which the blue-chip index includes a small number of companies (for instance LU, SK), at least the 10 largest companies were covered.
In March 2012, the Commission published a report21 showing that, one year after the call to action, limited progress had been made towards increasing the number of women on company boards. To identify appropriate measures for addressing the persistent lack of gender diversity in boardrooms of listed companies in Europe, the Commission launched a public consultation22 which will serve to gather views on possible action at EU level, including legislative measures, to redress the gender imbalance on company boards. The public consultation will run until 28 May 2012. Following this input, the Commission will take a decision on further action later in 2012.
4.2. Gender balance in political decision-making: more progress is needed
Data shows that there has been progress made towards better gender balance in parliaments
at European and national levels. The European Parliament has a better gender composition (35% women and 65% men) than national and regional parliaments (24% and 32% women respectively).
21
http://ec.europa.eu/justice/gender-equality/files/women-on-boards_en.pdf
Figure 6: Women and men in national Parliaments (single/lower houses), 2011 24,2 75,8 0 10 20 30 40 50 60 70 80 90 100
SE FI NL BE DK DE PT ES AT
EU-27
PL LU CZ UK BG IT LV EE FR LT EL SI SK IE RO CY HU MT
per
cent
Men Women
Source: European Commission, Database on women and men in decision-making. Data were collected in October 2011.
From 2005 to 2011, the proportion of women members in the Lower/Single houses of national parliaments around the EU has risen steadly, albeit slowly, from 22% to just under 25%. Only Belgium, the Netherlands, Finland and Sweden have more than 40% of women in their
parliaments and 19 Member States still have
less than the critical mass of 30% of women in their parliaments (Figure 6). Positive developments in 2011 include the great progress made in Slovenia, where women's
representation doubled from around 16% to 32% and in Poland where women now account for around 24% of parlamentarians (+ 4 percentage points). Part of the progress can be pointed to quota legislation adopted in both countries and strong campaigning from women's organisations.
There has been an improvement in the gender composition of EU Member States
governments over time, but the pace of change remains slow in many countries. On average, the share of women senior ministers23 is only around 24%24.
Inside the EU,only Sweden achieved parity in government. Austria and Finland have more than 40% women senior ministers. By contrast, the figure is under 10% in the governments of
Estonia, Slovenia, Czech Republic and Greece. In Hungary, there are no female senior ministers in the government.
23
Members of the government who have a seat in the Cabinet or Council of Ministers.
24
The most recent quota law for gender balance in politics is from Poland. It was passed in January 2011 and stipulates that women candidates should make up at least 35% of all electoral lists. The sanction for not complying with this
5. DIGNITY, INTEGRITY AND ENDING GENDER-BASED VIOLENCE
5.1. Ending gender-based violence
Gender-based violence is a major violation of fundamental rights and entails a high cost for society. The fact that there is no comparable data on violence against women in the different Member States increases the difficulty of addressing this phenomenon. Voices have been raised to warn against the potential threat the financial crisis represents as it may sweep away much of the progress achieved in terms
of public expenditure for supporting victims of violence.
An important step towards the objective of ending gender-based violence was the adoption on 18 May 2011 of a package of measures aimed at strengthening the rights of victims of crime. The package consists of a proposal for a horizontal Directive establishing minimum standards on the rights, support and protection of victims of crime25, a proposal for a
Regulation on the mutual recognition of civil law protection measures26 (complementing the Directive on the European Protection Order) and a Communication setting out the Commission's position on actions in relation to victims of crime.
This is a general and comprehensive reform package which applies to all victims; including women. It provides a range of measures that should be put in place to ensure that victims receive proper treatment from the moment they report a crime to the final outcome of criminal proceedings. A number of measures and provisions will have a positive impact, especially on women suffering from different forms of violent and sexual crime.
For example, the proposal for a Directive puts in place a mechanism based on an individual need assessment to determine whether a victim is in a situation of specific vulnerability and needs special protection. Typically, women who are victims of domestic and sexual violence will be considered vulnerable because of the nature of the crime they have suffered or their relationship to / dependence on the offender. In those cases special protection measures will be available during their participation in criminal proceedings to ease their difficulties during interviews, hearings and trial. Negotiations between the co-legislators are ongoing.
Another measure that will benefit many women is the mutual recognition of protection measures, for example measures which aim to protect a person from harassment, stalking and other forms of indirect coercion. It is important that protection measures issued in one Member State can be easily and speedily be recognised in another Member State. In this way, women do not lose their protection from a violent partner if they move or travel and they don't have to go through heavy formalities. To this end, the proposal for a Regulation relating to the mutual recognition of civil law protection measures will complete the proposal for a Directive on the mutual recognition of criminal law protection measures. Negotiations on the proposal for a Regulation have started under the Polish Presidency and will continue under the Danish Presidency.
25
COM(2011) 275 final
26
A Convention on preventing and combating violence against women and domestic violence27 was adopted on 7 April 2011 in the framework of the Council of Europe. The Convention:
• introduces a comprehensive legal framework to prevent and criminalise all forms of violence against women, to protect victims and to punish perpetrators;
• promotes an integrated approach to violence prevention and victims’ protection based on targeted measures according to the type of violence and specific needs along with the involvement and cooperation of all the relevant actors to create a safety net around the victim provided by specifically trained professionals;
• urges the justice system to be more responsive.
5.2. Health
Following the 2010 Women’s Health report28, the Commission presented a Men’s Health report in 201129 showing that both men and women's perspectives should be taken into account in developing health policy. Although men’s overall life expectancy in Europe as a whole is increasing (Figure 7), some Member States have seen a reversal of this trend in the past decade. Life expectancy is lower for men than for women across the EU, a difference that ranges from 11.2 years for Lithuania to 4.1 years in Sweden. A key message of the report is that there are high levels of premature morbidity and mortality in men, due to lifestyle choices and risk-taking behaviours. In all Member States, men who live in poor material and social conditions are likely to eat less healthily, exercise less, be overweight or obese, drink more alcoholic beverages and be more likely to smoke, engage in substance abuse (or drug abuse) and have more high-risk sexual behaviour than women. The report also concludes that a man's poorer knowledge and awareness of health issues underlines the need for targeted health information aimed at men.
27
Available at: http://conventions.coe.int/Treaty/EN/Treaties/HTML/DomesticViolence.htm.
28
European Commission 2010, "Data and information on women’s health in the EU".
Figure 7: Life expectancy at birth in EU Member States - 2009
Men Women
70 72 74 76 78 80 82 84
2002 2003 2004 2005 2006 2007 2008
ye
ars
Source: Eurostat
6. GENDER EQUALITY IN EXTERNAL ACTIONS
The Gender Inequality Index was designed by the United Nations Development Programme (UNDP) to show the loss in human development due to inequality between women and men. It measures women’s disadvantages in three dimensions: reproductive health, empowerment and the labour market30. It shows that Norway, Australia and New Zealand have achieved the highest degree of gender equality and that Ireland, The Netherlands, Sweden and Germany
are among the ten countries that score highest in the world. Indeed, the EU has been at the forefront of gender equality policy and has also contributed to promoting gender equality beyond its borders.
In January 2011, the Human Rights and Democracy Department of the European External Action Service (EEAS) was established. The Department strives for consistency between internal and external policies. This is of particular relevance in the field of human rights and as regards the promotion of gender equality and the empowerment of women. It shows how EU achievements related to gender equality and women’s empowerment have a global dimension. Specific gender focus points have been selected in more than seventy EU-delegations around the world and a growing number of EU-delegations in partner countries are engaging in dialogue with a strong gender equality component. For instance, in India, 40% of the Multiannual Indicative Programme is allocated to education with a strong gender equality component. The EU continues to actively promote women's human rights through human rights dialogues and consultations with partner countries, such as the African Union, the EU candidate countries, Canada, China, Indonesia, Japan, the Republic of Moldova, New Zealand, South Africa, Turkmenistan and Uzbekistan.
30
Implementing the EU Guidelines on Violence against Women and Girls and Combating All
Forms of Discrimination against them31 is an important part EU Delegations' mission. By the
end of 2010, more than 130 delegations had reported on the guidelines, a vast majority having identified concrete actions to be implemented in their countries of residence. The EEAS continues to contribute to their implementation through the thematic European Instrument for Democracy and Human Rights (EIDHR) programme. From October 2011 until January 2012, the EEAS will launch regional campaigns about women's participation in politics (North Africa and Middle East) and forced/early marriages (Asia).
Gender Equality is essential for growth and poverty reduction and is key to reaching the Millennium Development Goals. This is why the EU development policy contains a strong commitment to accelerating progress in this important area. For the period 2007 - 2013, the EU external co-operation in the field of gender equality and women empowerment is financed not only - as cross cutting issues - through geographical instruments (European Development Fund, Development Cooperation Instrument and European Neighbourhood and Partnership Instrument) at national and regional level but also by thematic instruments, such as the "Investing in People" programme and the "Instrument for Democracy and Human Rights". The focus is on gender equality and women empowerment, and the aim is to achieve equal rights (political, economic, employment, social and cultural right) for all; equal access to and control over resources for women and men; equal opportunities to achieve political and economic influence for women and men. The first report on the implementation of the Action Plan on Gender Equality and Women's Empowerment32 was published in 2011. It gives a clear idea of what is being done in partner countries by the EU Delegations and the Member States to promote gender equality and women's empowerment.
The priority theme of the 55th session (2011) chosen by the United Nations Commission on the Status of Women (CSW) was "Access and participation of women and girls to education, training, science and technology, including for the promotion of women's equal
access to full employment and decent work" and conclusions33 were agreed that reflect the EU
gender equality acquis.
7. HORIZONTAL ISSUES
The Strategy for Equality between women and men commits the Commission to implementing gender mainstreaming as an integral part its policy making. It stipulates that the next EU Multiannual Financial Framework (MFF) will provide the support necessary to implement the actions foreseen in the Strategy after 2013. In May 2011, the Advisory Committee on equal opportunities between women and men adopted an opinion on key recommendations for the future funding programmes covering the period of 2014-2020.
The Commission has adopted legislative proposals for the future budget programs. Gender equality is included in the Rights and Citizenship programme34. The objective of this program is to promote and protect the rights of persons and in particular the principles of non- discrimination and equality between women and men. The proposal will be discussed with the Council and with the European Parliament in 2012.
31
General Affairs Council of 8 December 2008.
32
http://capacity4dev.ec.europa.eu/topic/gender
33
Available at: http://www.un.org/womenwatch/daw/csw/csw55/agreed_conclusions/AC_CSW55_E.pdf.
34
PART II:GRAPHS AND TABLES
This part gives an overview of the situation of women and men, its evolution over time, and remaining gender gaps in the European Union.
1. GRAPHS
[image:18.595.80.518.167.420.2]1.1. Europe 2020 indicators
Figure 8 – Employment rates (women and men aged 20-64) in EU Member States – 2010
62,1 75,1
0 10 20 30 40 50 60 70 80 90
SE DK FI NL DE AT CY UK SI EE PT LT LV FR
EU-27
LU BG BE CZ IE PL SK RO ES HU EL IT MT
pe
rc
en
t
Women Men
Figure 9 – Early leavers from education and training in EU Member States – 2010
(Percentage of the population aged 18-24 with at most lower secondary education and not in further education or training)
12,1 16
0 10 20 30 40 50 60 70 80 90 100
SI PL CZ SK LU LT DK NL AT IE SE FI LV HU CY BE FR EL DE EU
27
UK BU IT RO ES PT MT EE
p
e
rcen
t
Women Men
Europe 2020 objective: the share of early school leavers should be under 10%
EE: women - unreliable or uncertain data
Figure 10 – Tertiary educational attainment by sex, age group 30-34 – 2010
37,2 30
0 10 20 30 40 50 60 70 80 90 100
IE FI DK SE LT BE CY FR EE LU ES UK NL SI LV PL
EU27 BG G
R HU DE PT SK AT IT MT CZ RO
pe
rcent
Women Men
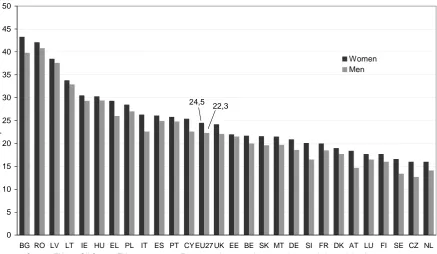
[image:19.595.81.523.454.716.2]Figure 11 - People at-risk-of-poverty or social exclusion – 2010
24,5 22,3
0 5 10 15 20 25 30 35 40 45 50
BG RO LV LT IE HU EL PL IT ES PT CY EU27 UK EE BE SK MT DE SI FR DK AT LU FI SE CZ NL
percent
Women Men
Source: EU-27: SILC 2010 EU aggregates are Eurostat estimates and computed as population weighted averages of national values. The indicator on people at-risk of social exclusion is defined as the share of the population in at least one of the following three conditions: 1) at risk of poverty, meaning below the poverty threshold, 2) in a situation of severe material deprivation, 3) living in a household with very low work intensity."
1.2. Employment
Figure 12 – Employment rates of older workers (women and men aged 55-64) in EU Member States – 2010
38,6 54,6
0 10 20 30 40 50 60 70 80
SE FI EE DK DE UK LV LT PT CY NL IE EU 27
BU FR CZ AT ES RO LU HU BE EL SK IT SI PL MT
pe
rcent
Women Men
[image:20.595.77.467.480.723.2]Figure 13 – Unemployment rates (women and men aged 15 years and over) in EU Member States – 2011
9,7
9,5
0 5 10 15 20 25
ES SK PT HU IE PL FR BG EU27 CZ SI CY DK SE BE FI MT RO LU DE NL AT
per
cent
Women Men
Source: Eurostat, Labour Force Survey (LFS), annual averages. UK, LT, LV, IT, EL, EE: not available.
Figure 14 – Share of part-time workers in total employment (persons aged 15 and over) in EU Member States – 2010
31,9
8,7
0 10 20 30 40 50 60 70 80 90
NL DE AT UK BE SE DK LU IE EU27 FR IT MT ES FI PT SI EE CY PL LV RO GR CZ LT HU SK BG
per
c
e
n
t
Women Men
[image:21.595.81.523.445.678.2]Figure 15 – Employment rates of men and women aged 15-64, measured in full time equivalent in EU Member States – 2010
49,9 68
0 10 20 30 40 50 60 70 80 90 100
SE FI DK CY SI PT EE LT LV BG CZ FR AT PL SK DE UK RO EU-27
HU LU BE IE ES EL NL IT MT
per
cent
Women Men
Figure 16 – Inactivity and part-time work among women due to the lack of care services for children and other dependent persons (% of total female population having care responsibilities) – 2010
0 10 20 30 40 50 60 70 80 90 100
RO LV EL ES IE DE BE SI PL LT HU CY BG UK PT EU27 LU IT CZ AT FR EE SK FI SE NL
Source: Eurostat - Labour Force Survey Notes: No data available for DK and MT
28.3
pe
rc
en
t
81,0 89,7
0 10 20 30 40 50 60 70 80 90 100
LU CZ MT NL SI CY EL AT FI PL DE FR BE PT IT UK
EU-27
SK RO HU BG EE ES LV LT IE
Without children With children
[image:24.595.79.520.457.684.2]Source : Eurostat, European Labour Force Survey, annual averages. Notes : No data available for DK and SE.
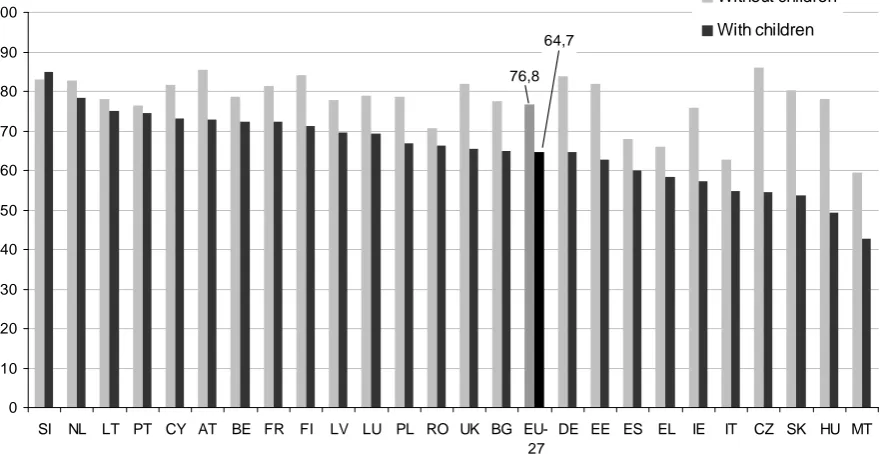
Figure 18 – Employment rates of women aged 25-49, depending on whether they have children (under 12) – 2010
76,8 64,7
0 10 20 30 40 50 60 70 80 90 100
SI NL LT PT CY AT BE FR FI LV LU PL RO UK BG EU-27
DE EE ES EL IE IT CZ SK HU MT
Without children
With children
Figure 19 – Employment impact of parenthood for women and men (aged 25-49) – 2010 (Difference in percentage points in employment rates with presence of a child under 12 and without the presence of any children)
8,7
-12,1
-35 -30 -25 -20 -15 -10 -5 0 5 10 15 20
CZ HU SK DE EE IE MT UK FI AT BG
EU-27
PL LU FR CY LV IT ES EL BE NL RO LT PT SI
pe
rc
en
ta
ge po
in
ts
men
women
Figure 20 – Gender segregation in occupations and in economic sectors in EU Member States – 2010
0 5 10 15 20 25 30 35
SK EE BG LT CY FI CZ LV HU ES PT IE PL SE DE FR AT SI DK BE NL IT UK MT LU RO EL
Gender segregation in occupations
Gender segregation in economic sectors
Source: Eurostat, EU LFS. Gender segregation in sectors is calculated as the average national share of employment for women and men applied to each sector; differences are added up to produce the total amount of gender imbalance expressed as a proportion of total employment (ISCO classification).
Figure 21 – Pay gap between women and men in unadjusted form in EU Member States – 2010
16,4
0 5 10 15 20 25 30
EE CZ AT DE EL CY SK UK FI NL HU LV ES EU-27
DK FR SE BG LT PT IE RO LU BE MT IT SI PL
Perc
[image:26.595.80.521.454.744.2]Source: Eurostat. The unadjusted Gender Pay Gap (GPG) represents the difference between average gross hourly earnings of male paid employees and of female paid employees as a percentage of average gross hourly earnings of male paid employees. EE and EL: data from 2008. EU27, BE, IE, ES, FR, IT, CY, AT: provisional data.
[image:27.595.77.515.180.428.2]1.3. Education
Figure 22 – Educational attainment (at least upper secondary level) of women and men aged 20-24, in EU Member States – 2010
81,8 76,2
0 10 20 30 40 50 60 70 80 90 100
PL SK CZ SI IE LT EE CY GR SE AT HU LV FR FI BE BG UK
EU
27 NL IT RO LU DE DK ES PT MT
percent
Women Men
1.4. Poverty
Figure 23 – At-risk-of-poverty rate after social transfers for older people (women and men aged 65 years and over) in EU Member States – 2010
18,1 12,9
0 5 10 15 20 25 30 35 40
BU SI UK PT EL ES FI LV SE RO BE IT AT EE DK EU 27
MT PL DE LT FR CZ SK LU NL HU
pe
rc
ent
Women Men
1.5. Health and demography
Figure 24 – Life expectancy at birth in EU Member States – 2009
82,4 76,4
0 10 20 30 40 50 60 70 80 90
FR ES IT CY FI SE LU AT NL BE DE GR MT SI PT IE UKEU27DK CZ EE PL SK LT HU LV BG RO Women Men
Source: Eurostat. It and EU 27: 2008 data.
years
Figure 25 – Healthy life years in EU Member States – 2009
0 10 20 30 40 50 60 70 80
MT SE UK CY LU BG IE BE FR CZ PL ES EU27 SI RO IT LT GR AT DK NL EE FI HU DE PT LV SK
Women Men
Source: Eurostat. EU 27:Provisional data. UK and IT: 2008 data. 61,6 60,9
y
ear
[image:29.595.80.514.438.684.2]1.6. Decision making
Figure 26 – Members of boards of largest publicly quoted companies – 2012
13,7 86,3
0 10 20 30 40 50 60 70 80 90 100
FI LV SE FR NL DK BG DE UK CZ SI LT EU-27
SK PL ES AT BE RO IE EL EE IT PT LU HU CY MT
perc
ent
Men Women
Source: European Commission, Database on women and men in decision-making. Data were collected in January 2012 The list of the largest publicly quoted companies is based for each country on current membership of blue-chip index. In countries for which the blue-chip index includes a small number of companies (for instance LU, SK), at least the 10 largest companies were covered.
Figure 27 – Presidents of the highest decision-making body of the largest publicly quoted companies – 2012
6,4 93,6
0 10 20 30 40 50 60 70 80 90 100
SK BG PL SI LV LT EE CY FI DE EU
27 ES FR UK SE RO PT NL MT LU IT IE HU EL
DK CZ BE AT
perc
ent
Men Women
[image:30.595.81.523.451.680.2]Figure 28 – Leaders of businesses – 2010
33 67
0 10 20 30 40 50 60 70 80 90 100
ES FR LV IT EE UK DE
EU-27
PL LT BG AT BE EL HU NL PT CZ RO SE SI DK IE LU MT FI CY
per
cent
Men Women
[image:31.595.82.512.408.640.2]Source: Eurostat, EU LFS. NB: leaders of businesses covers ISCO (International Standard Classification of Occupations) categories 121 (Directors and chief executives) and 13 (Managers of small enterprises). SK: not available.
Figure 29 – Senior ministers in national governments – 2011
24,7 75,3
0 10 20 30 40 50 60 70 80 90 100
SE FI ES AT DK DE BE LV LU FR IT CY PL EU-27
MT NL UK BG PT RO IE LT SK EE SI CZ EL HU
perc
ent
Men Women
Source: European Commission, Database on women and men in decision-making. Data were collected in October 2011. The indicator has been developed as part of the follow-up of the Beijing Platform for Action in the EU Council of Ministers. A senior minister is a minister in the national government who has a seat in the cabinet.
32 68
0 10 20 30 40 50 60 70 80 90 100
FR SE ES FI BE NL DK DE EU-27 UK AT PL PT CZ SK RO IT HU
per
cent
Men Women
[image:32.595.78.511.66.314.2]Source: European Commission, Database on women and men in decision-making. Data collected between 02/09/2011-12/12/2011 except EL 04/02/2011-21/02/201. BG, CY, EE, El, IE; LT, LU, LV, MT, SI: not available or not applicable.
Figure 31 – Members of single / lower houses in national parliaments – 2011
24,2 75,8
0 10 20 30 40 50 60 70 80 90 100
SE FI NL BE DK DE PT ES AT
EU-27
PL LU CZ UK BG IT LV EE FR LT EL SI SK IE RO CY HU MT
per
cent
Men Women
2. TABLES
2.1. Europe 2020 indicators
Table 1 – Employment rates (women and men aged 20-64) in EU Member States – 2005 and 2010
Women Men Gap
2005 2010 2005 2010 2005 2010
EU-27 60 62.1 76 75.1 -16 -13
Belgium 58.6 61.6 74.3 73.5 -15.7 -11.9
Bulgaria 57.1 61.7 66.8 69.1 -9.7 -7.4
Czech Republic 61.3 60.9 80.1 79.6 -18.8 -18.7
Denmark 73.7 73.1 82.3 79 -8.6 -5.9
Germany 63.1 69.6 75.6 80.1 -12.5 -10.5
Estonia 69 65.7 75.4 67.7 -6.4 -2
Ireland 62.4 60.4 82.8 69.4 -20.4 -9
Greece 49.6 51.7 79.8 76.2 -30.2 -24.5
Spain 54.4 55.8 79.9 69.1 -25.5 -13.3
France 63.7 64.7 75.3 73.7 -11.6 -9
Italy 48.4 49.5 74.8 72.8 -26.4 -23.3
Cyprus 63.8 68.5 85.5 82.5 -21.7 -14
Latvia 65.7 64.9 75.4 65.1 -9.7 -0.2
Lithuania 66.6 65.1 74.9 63.6 -8.3 1.5
Luxembourg 58.4 62 79.4 79.2 -21 -17.2
Hungary 55.6 55 69.2 66 -13.6 -11
Malta 35.1 41.6 80.6 77.8 -45.5 -36.2
Netherlands 67.6 70.8 82.4 82.8 -14.8 -12
Austria 64.9 69.6 78.5 80.2 -13.6 -10.6
Poland 51.7 57.7 65.1 71.6 -13.4 -13.9
Portugal 66 65.6 78.7 75.4 -12.7 -9.8
Romania 56.9 55.9 70.4 70.8 -13.5 -14.9
Slovenia 66.2 66.5 75.8 74 -9.6 -7.5
Slovakia 56.7 57.4 72.5 71.9 -15.8 -14.5
Finland 70.8 71.5 75.1 74.5 -4.3 -3
Sweden 75.5 75.7 80.7 81.7 -5.2 -6
United Kingdom 68.5 67.9 82 79.3 -13.5 -11.4
Table 2 – Early leavers from education and training in EU Member States – 2010
Women Men
EU-27 12.1 16
Belgium 10 13.8 Bulgaria 14.5 13.2 Czech Republic 4.8 4.9
Denmark 7.5 13.6 Germany 11 12.7 Estonia : 15.2 Ireland 8.4 12.6 Greece 10.8 16.5 Spain 23.1 33.5 France 10.3 15.4 Italy 15.4 22 Cyprus 9.8 16.2 Latvia 9.4 17.2 Lithuania 6.2 9.9 Luxembourg 6 8 Hungary 9.5 11.5 Malta 32.4 41 Netherlands 7.9 12.2 Austria 8.2 8.4 Poland 3.5 7.2 Portugal 24.6 32.7 Romania 18.2 18.6 Slovenia 3.3 6.4 Slovakia 4.9 4.6 Finland 9 11.6 Sweden 8.5 10.9 United Kingdom 14 15.8
Table 3 – Tertiary educational attainment by sex, age group 30-34 – 2010
Women Men
EU-27 37.2 30.0
Belgium 50.0 39.0 Bulgaria 35.5 20.7 Czech Republic 22.3 18.6
Denmark 52.1 42.2 Germany 29.7 29.9 Estonia 47.7 32.2 Ireland 55.3 44.4 Greece 31.4 25.7 Spain 45.9 35.7 France 47.7 39.3 Italy 24.2 15.5 Cyprus 48.9 41.3 Latvia 41.4 23.4 Lithuania 51.2 36.3 Luxembourg 47.4 44.8 Hungary 30.7 21.0 Malta 22.7 14.6 Netherlands 44.4 38.4 Austria 24.5 22.5 Poland 40.8 29.8 Portugal 29.4 17.7 Romania 19.6 16.7 Slovenia 44.0 26.4 Slovakia 26.2 18.2 Finland 54.0 37.7 Sweden 52.1 39.8 United Kingdom 45.1 40.9
Table 4 – People at-risk-of-poverty or social exclusion – 2010
Women Men
EU-27 24.5 22.3
Belgium 21.7 20.0 Bulgaria 43.3 39.8 Czech Republic 16.0 12.7
Denmark 19.0 17.7 Germany 20.9 18.6 Estonia 22.0 21.5 Ireland 30.5 29.3 Greece 29.3 26.0 Spain 26.1 24.9 France 20.0 18.5 Italy 26.3 22.6 Cyprus 25.4 22.6 Latvia 38.5 37.6 Lithuania 33.8 32.9 Luxembourg 17.7 16.5 Hungary 30.3 29.4 Malta 21.5 19.7 Netherlands 16.0 14.1 Austria 18.4 14.7 Poland 28.5 27.0 Portugal 25.8 24.8 Romania 42.1 40.8 Slovenia 20.1 16.5 Slovakia 21.6 19.6 Finland 17.7 16.0 Sweden 16.6 13.4 United Kingdom 24.2 22.1
2.2. Employment
Table 5 – Employment rates of older workers (women and men aged 55-64) in EU Member States – 2005-2010
Women Men Gender gap
2005 2010 2005 2010 2005 2010
EU 27 33.6 38.6 51.6 54.6 -18.0 -16.0
Belgium 22.1 29.2 41.7 45.6 -19.6 -16.4
Bulgaria 25.5 37.7 45.5 50.3 -20.0 -12.6
Czech Republic 30.9 35.5 59.3 58.4 -28.4 -22.9
Denmark 53.5 52.5 65.6 62.7 -12.1 -10.2
Germany 37.6 50.5 53.6 65.0 -16.0 -14.5
Estonia 53.7 54.9 59.3 52.2 -5.6 2.7
Ireland 37.3 42.0 65.7 58.1 -28.4 -16.1
Greece 25.8 28.9 58.8 56.5 -33.0 -27.6
Spain 27.4 33.2 59.7 54.7 -32.3 -21.5
France 35.7 37.4 41.5 42.1 -5.8 -4.7
Italy 20.8 26.2 42.7 47.6 -21.9 -21.4
Cyprus 31.5 43.0 70.8 71.2 -39.3 -28.2
Latvia 45.2 48.7 55.2 47.6 -10.0 1.1
Lithuania 41.7 45.8 59.1 52.3 -17.4 -6.5
Luxembourg 24.9 31.3 38.3 47.7 -13.4 -16.4
Hungary 26.7 30.1 40.6 39.6 -13.9 -9.5
Malta 12.4 13.0 50.8 47.9 -38.4 -34.9
Netherlands 35.2 42.8 56.9 64.5 -21.7 -21.7
Austria 22.9 33.7 41.3 51.6 -18.4 -17.9
Poland 19.7 24.2 35.9 45.3 -16.2 -21.1
Portugal 43.7 43.5 58.1 55.7 -14.4 -12.2
Romania 33.1 33.0 46.7 50.3 -13.6 -17.3
Slovenia 18.5 24.5 43.1 45.5 -24.6 -21.0
Slovakia 15.6 28.7 47.8 54.0 -32.2 -25.3
Finland 52.7 56.9 52.8 55.6 -0.1 1.3
Sweden 66.7 66.7 72.0 74.2 -5.3 -7.5
United Kingdom 48.0 49.5 65.9 65.0 -17.9 -15.5
Table 6 – Unemployment rates (women and men aged 15 years and over) in EU Member States – 2006 and 2011
Women Men 2006 2011 2006 2011
EU-27 9.0 9.7 7.6 9.5
Belgium 9.3 7.2 7.4 7.2 Bulgaria 9.3 10.0 8.7 12.1 Czech Republic 8.9 7.9 5.8 5.9 Denmark 4.5 7.5 3.3 7.7 Germany 10.2 5.7 10.3 6.2 Estonia 5.6 : 6.2 : Ireland 4.2 10.6 4.6 17.4 Greece 13.6 : 5.6 : Spain 11.6 22.2 6.3 21.2
France 10.1 10.3 8.5 9.1 Italy 8.8 : 5.4 :
Cyprus 5.4 7.7 3.9 7.8 Latvia 6.2 : 7.4 : Lithuania 5.4 : 5.8 : Luxembourg 6.0 6.4 3.6 3.6 Hungary 7.8 10.8 7.2 11.0 Malta 8.6 6.9 6.1 6.1 Netherlands 5.0 4.4 3.9 4.5 Austria 5.2 4.2 4.3 4 Poland 14.9 10.4 13.0 9 Portugal 9.3 13.0 7.9 12.4 Romania 6.1 6.7 8.2 7.8 Slovenia 7.2 7.9 4.9 8.2 Slovakia 14.7 13.3 12.3 13.4 Finland 8.1 7.1 7.4 8.4 Sweden 7.2 7.5 6.9 7.6 United Kingdom 4.9 : 5.8 :
Table 7 – Share of part-time workers in total employment (persons aged 15 and over) in EU Member States – 2005 and 2010
Women
Men 2005 2010 2005 2010
EU-27 30.9 31.9 7.4 8.7
Belgium 40.5 42.3 7.6 9.0 Bulgaria 2.5 2.6 1.7 2.2 Czech Republic 8.6 9.9 2.1 2.9 Denmark 33.0 39.0 12.7 15.2 Germany 43.8 45.5 7.8 9.7 Estonia 10.6 14.5 4.9 7.1 Ireland 31.8 34.7 6.4 11.8 Greece 9.3 10.4 2.3 3.7 Spain 24.2 23.2 4.5 5.4 France 30.3 30.1 5.8 6.7 Italy 25.6 29.0 4.6 5.5 Cyprus 14.0 12.7 5.0 6.5 Latvia 10.4 11.4 6.3 7.8 Lithuania 9.1 9.3 5.1 6.7 Luxembourg 38.2 36.0 2.5 4.0 Hungary 5.8 8.0 2.7 3.9 Malta 21.1 25.0 4.5 6.0 Netherlands 75.1 76.5 22.6 25.4 Austria 39.3 43.8 6.1 9.0 Poland 14.3 11.5 8.0 5.7 Portugal 16.2 15.5 7.0 8.2 Romania 10.5 11.4 10.0 10.6 Slovenia 11.1 14.7 7.2 8.6 Slovakia 4.1 5.4 1.3 2.8 Finland 18.6 19.6 9.2 10.0 Sweden 39.6 40.4 11.5 14.0 United Kingdom 42.6 43.3 10.4 12.6
Table 8 – Employment rates (women and men aged 15-64) measured in full-time equivalent rates, in EU Member States – 2010
Women Men Gender gep
EU-27 49.9 68.0 -18.1
Belgium 47.4 65.8 -18.4
Bulgaria 55.9 62.5 -6.6
Czech Republic 54.3 73.2 -18.9
Denmark 60.3 70.5 -10.2
Germany 50.9 72.8 -21.9
Estonia 58.1 60.3 -2.2
Ireland 47.0 60.9 -13.9
Greece 46.0 70.7 -24.7
Spain 46.6 63.4 -16.8
France 53.3 66.6 -13.3
Italy 40.7 66.4 -25.7
Cyprus 59.5 75.5 -16.0
Latvia 57.7 58.1 -0.4
Lithuania 57.8 56.3 1.5
Luxembourg 48.5 72.4 -23.9
Hungary 49.3 59.9 -10.6
Malta 35.3 72.1 -36.8
Netherlands 45.1 71.4 -26.3
Austria 53.1 74.8 -21.7
Poland 51.3 65.7 -14.4
Portugal 58.2 69.6 -11.4
Romania 50.7 64.6 -13.9
Slovenia 59.0 68.2 -9.2
Slovakia 51.3 64.6 -13.3
Finland 61.8 67.0 -5.2
Sweden 61.9 72.3 -10.4
Table 9 – Inactivity and part-time work among women due to the lack of care services for children and other dependent persons (% of total female population having care responsibilities) – 2010
EU-27 28.3
Belgium 44.9 Bulgaria 31.3 Czech Republic 16.7
Germany 45.9 Estonia 12.2 Ireland 49.1 Greece 68.6 Spain 59.2 France 14.0 Italy 18.0 Cyprus 33.4 Latvia 86.5 Lithuania 38.3 Luxembourg 22.1 Hungary 35.1 Netherlands 3.7 Austria 15.7 Poland 40.1 Portugal 29.4 Romania 92.5 Slovenia 40.2 Slovakia 11.0 Finland 7.5 Sweden 6.5 United Kingdom 29.6
Table 10 – Employment rates of men and women aged 25-49, depending on whether they have children (under 12) – 2010
Women Men
Without children
With
children Gap
Without children
With
children Gap
EU-27 76.8 64.7 -12.1 81.0 89.7 8.7
Belgium 78.5 72.4 -6.1 83.0 91.4 8.4
Bulgaria 77.5 64.8 -12.6 76.7 83.0 6.3
Czech Republic 86.0 54.4 -31.6 88.6 95.5 6.9
Germany 83.8 64.5 -19.3 85.0 91.7 6.7
Estonia 81.9 62.6 -19.2 73.5 82.4 8.9
Ireland 76.0 57.2 -18.8 71.2 80.0 8.8
Greece 66.1 58.2 -7.8 82.1 93.0 11.0
Spain 68.1 60.1 -8.0 71.9 81.5 9.5
France 81.3 72.3 -9.0 83.7 91.7 8.0
Italy 62.7 54.7 -8.0 78.7 90.8 12.1
Cyprus 81.7 73.1 -8.6 85.2 93.9 8.7
Latvia 77.9 69.6 -8.4 69.6 81.0 11.3
Lithuania 78.2 74.9 -3.2 67.1 80.2 13.1
Luxembourg 78.8 69.4 -9.4 90.6 95.6 5.0
Hungary 78.2 49.3 -28.8 77.1 84.5 7.5
Malta 59.4 42.6 -16.7 86.4 94.9 8.5
Netherlands 82.8 78.2 -4.6 88.2 94.1 5.9
Austria 85.5 72.8 -12.7 87.6 92.7 5.1
Poland 78.6 66.8 -11.8 79.5 91.8 12.3
Portugal 76.5 74.6 -1.9 79.8 91.2 11.5
Romania 70.8 66.3 -4.5 80.0 86.5 6.5
Slovenia 83.0 84.9 1.9 81.9 94.1 12.2
Slovakia 80.4 53.7 -26.7 78.4 89.4 11.0
Finland 84.1 71.4 -12.7 80.6 92.4 11.8
United Kingdom 81.9 65.6 -16.3 83.0 90.5 7.5
Table 11 – Gender segregation in occupations and in economic sectors in EU Member States – 2010
Gender segregation in occupations
Gender segregation in economic sectors
Belgium 25.4 19.5 Bulgaria 29.0 21.2 Czech Republic 28.3 20.9
Denmark 25.8 19.6 Germany 26.0 19.3 Estonia 30.7 25.7 Ireland 26.3 21.4 Greece 21.8 16.0
Spain 26.7 20.6
France 26.0 19.1
Italy 24.7 19.7
Cyprus 28.8 19.9 Latvia 28.2 24.5 Lithuania 28.8 21.9 Luxembourg 23.4 16.0 Hungary 27.8 20.9
Malta 23.7 16.0
Netherlands 25.0 19.4 Austria 25.9 19.3 Poland 26.1 20.6 Portugal 26.5 21.4 Romania 22.5 17.1 Slovenia 25.8 19.0 Slovakia 31.1 25.2 Finland 28.6 23.7 Sweden 26.1 21.6 United Kingdom 24.3 19.4
Table 12 – Pay gap between women and men in unadjusted form in EU Member States – 2010
EU-27 16.4
Belgium 8.8 Bulgaria 15.7 Czech Republic 25.5
Denmark 16 Germany 23.1 Estonia 27.6 Ireland 12.6 Greece 22 Spain 16.7 France 16 Italy 5.5 Cyprus 21 Latvia 17.6 Lithuania 14.6 Luxembourg 12 Hungary 17.6 Malta 6.1 Netherlands 18.5 Austria 25.5 Poland 1.9 Portugal 12.8 Romania 12.5 Slovenia 4.4 Slovakia 20.7 Finland 19.4 Sweden 15.8 United Kingdom 19.5
Source: Eurostat, The unadjusted Gender Pay Gap (GPG) represents the difference between average gross hourly earnings of male paid employees and of female paid employees as a percentage of average gross hourly earnings of male paid employees.
2.3. Education
Table 13 – Educational attainment (at least upper secondary level) of women and men aged 20-24 in EU Member States – 2010
Women Men
EU-27 81.8 76.2
Belgium 84.7 80.3 Bulgaria 83.6 85.0 Czech Republic 92.8 91.1
Denmark 75.6 61.4 Germany 76.7 72.2
Estonia 89.5 76.9 Ireland 90.6 85.3 Greece 87.2 79.5 Spain 67.9 54.7 France 85.8 79.8 Italy 80.2 72.6 Cyprus 89.0 83.2 Latvia 85.9 74.1 Lithuania 89.7 84.2 Luxembourg 78.7 67.9 Hungary 85.9 82.0 Malta 60.8 47.0 Netherlands 81.6 73.7 Austria 86.2 84.9 Poland 93.8 88.4 Portugal 62.7 54.8 Romania 78.8 77.7 Slovenia 92.8 86.1 Slovakia 93.1 93.2 Finland 85.6 82.8 Sweden 86.9 84.9 United Kingdom 82.0 78.9
2.4. Poverty
Table 14 – At-risk-of-poverty rate after social transfers for older people (women and men aged 65 years and over) in EU Member States – 2010
Women Men
EU-27 18.1 12.9
Belgium 20 18.7 Bulgaria 37.2 24.9 Czech Republic 10.3 2.1
Denmark 18.5 16.8 Germany 15.9 12.1 Estonia 18.6 8 Ireland 10.3 10.9 Greece 23.3 18.8 Spain 23.1 19.9 France 10.8 8 Italy 19.5 12.6 Cyprus 47.5 42.5 Latvia 21.6 12.9 Lithuania 11.2 8.1 Luxembourg 6.3 5.5 Hungary 4.8 2.8 Malta 17.5 20.4 Netherlands 6.3 5.5 Austria 18.7 10.4 Poland 16.8 9.9 Portugal 23.5 17.5 Romania 20.7 10.9 Slovenia 27.1 9.5 Slovakia 10.1 3.9 Finland 22.7 12.2 Sweden 21.6 7.8 United Kingdom 24.5 17.6
2.5. Health and demography
Table 15 – Life expectancy at birth in EU Member States – 2009
Women Men Gender gap
EU-27 82.4 76.4 6
Belgium 82.8 77.3 5.5
Bulgaria 77.4 70.1 7.3
Czech Republic 80.5 74.2 6.3
Denmark 81.1 76.9 4.2
Germany 82.8 77.8 5
Estonia 80.2 69.8 10.4
Ireland 82.5 77.4 5.1
Greece 82.7 77.8 4.9
Spain 84.9 78.6 6.3
France 85 78 7
Italy 84.5 79.1 5.4
Cyprus 83.6 78.6 5
Latvia 78 68.1 9.9
Lithuania 78.7 67.5 11.2
Luxembourg 83.3 78.1 5.2
Hungary 78.4 70.3 8.1
Malta 82.7 77.9 4.8
Netherlands 82.9 78.7 4.2
Austria 83.2 77.6 5.6
Poland 80.1 71.5 8.6
Portugal 82.6 76.5 6.1
Romania 77.4 69.8 7.6
Slovenia 82.7 75.9 6.8
Slovakia 79.1 71.4 7.7
Finland 83.5 76.6 6.9
Sweden 83.5 79.4 4.1
United Kingdom 82.5 78.3 4.2 Source: Eurostat.
Table 16 - Healthy life years in EU Member States – 2009
Women Men
EU-27 61.6 60.9
Belgium 63.5 63.7 Bulgaria 65.6 61.9 Czech Republic 62.5 60.9
Denmark 60.4 61.8 Germany 57.7 56.7 Estonia 59 54.8 Ireland 65.2 63.7 Greece 60.9 60.2 Spain 61.9 62.6 France 63.2 62.5 Italy 61.2 62.4 Cyprus 65.8 65.1 Latvia 55.8 52.6 Lithuania 60.9 57 Luxembourg 65.7 65.1 Hungary 58 55.7 Malta 70.6 69.1 Netherlands 59.8 61.4 Austria 60.6 59.2 Poland 62.1 58.1 Portugal 55.9 58 Romania 61.4 59.5 Slovenia 61.5 60.6 Slovakia 52.3 52.1 Finland 58.4 58.1 Sweden 69.5 70.5 United Kingdom 66.3 65
Source: Eurostat
2.6. Decision-making
Table 17 – Members of boards of largest publicly quoted companies (% total board members) – 2003-2012
Women Men
2003 2012 2003 2012
EU-27 9.0 13.7 91.0 86.3
Belgium 6.8 10.7 93.2 89.3 Bulgaria 18.3 15.6 81.7 84.4 Czech Republic 10.6 15.4 89.4 84.6 Denmark 11.3 16.1 88.7 83.9 Germany 11.7 15.6 88.3 84.4 Estonia 15.5 6.7 84.5 93.3
Ireland 5.6 8.7 94.4 91.3 Greece 7.3 7.4 92.7 92.6 Spain 4.2 11.5 95.8 88.5
France 5.9 22.3 94.1 77.7
Italy 2.5 6.1 97.5 93.9 Cyprus 6.6 4.4 93.4 95.6 Latvia 9.9 25.9 90.1 74.1
Lithuania 11.3 14.5 88.7 85.5 Luxembourg 4.3 5.7 95.7 94.3 Hungary 8.9 5.3 91.1 94.7 Malta 2.3 3.0 97.7 97.0 Netherlands 4.9 18.5 95.1 81.5
Austria 6.0 11.2 94.0 88.8 Poland 9.1 11.8 90.9 88.2
Portugal 4.1 6.0 95.9 94.0 Romania 17.2 10.3 82.8 89.7
Slovenia 19.0 15.3 81.0 84.7 Slovakia 8.4 13.5 91.6 86.5 Finland 16.3 27.1 83.7 72.9 Sweden 21.3 25.2 78.7 74.8 United Kingdom 13.2 15.6 86.8 84.4
Source: European Commission, Database on women and men in decision-making.
Table 18 – Sex distribution of the presidents of the highest decision-making body – largest publicly quoted companies – 2004-2011
Women Men
2004 2012 2004 2012
EU-27 2.6 3.2 97.4 96.8
Belgium 0 0 100 100 Bulgaria 2.6 13.3 97.4 86.7 Czech Republic 6.3 0 93.7 100 Denmark 0 0 100 100 Germany 0 3.3 100 96.7 Estonia 0 7.1 100 92.9 Ireland 2.1 0 97.9 100 Greece 3.9 0 96.1 100 Spain 1.9 2.9 98.1 97.1 France 4.1 2.7 95.9 97.3 Italy 2.0 0 98 100 Cyprus 0 5.3 100 94.7 Latvia 6.7 9.7 93.3 90.3 Lithuania 0 7.7 100 92.3 Luxembourg 0 0 100 100 Hungary 2.1 0 97.9 100 Malta 8.3 0 91.7 100 Netherlands 0 0 100 100 Austria 2.1 0 97.9 100 Poland 10.2 10.5 89.8 89.5 Portugal 4.2 0 95.8 100 Romania 0 0 100 100 Slovenia 8.1 10.5 91.9 89.5 Slovakia 8.7 20 91.3 80 Finland 2.0 4.2 98 95.8 Sweden 0 0 100 100 United Kingdom 0 0 100 100
Source: European Commission, Database on women and men in decision-making.
Table 19 – Sex distribution of leaders of businesses – 2010
Women Men
EU-27 33 67
Belgium 30 70 Bulgaria 31 69 Czech Republic 29 71
Denmark 25 75 Germany 33 67 Estonia 34 66 Ireland 22 78 Greece 30 70 Spain 36 64 France 36 64 Italy 35 65 Cyprus 14 86 Latvia 36 64 Lithuania 32 68 Luxembourg 22 78 Hungary 30 70 Malta 20 80 The Netherlands 30 70
Austria 30 70 Poland 33 67 Portugal 30 70 Romania 29 71 Slovenia 27 73 Slovakia : : Finland 18 82 Sweden 27 73 United Kingdom 34 66
Table 20 – Senior ministers in national governments – 2011
Women Men
EU-27 24.7 75.3
Belgium 33.3 66.7 Bulgaria 17.6 82.4 Czech Republic 6.3 93.8
Denmark 39.1 60.9 Germany 37.5 62.5 Estonia 7.7 92.3 Ireland 13.3 86.7 Greece 5.6 94.4 Spain 43.8 56.3 France 26.5 73.5 Italy 25.0 75.0 Cyprus 25.0 75.0 Latvia 28.6 71.4 Lithuania 13.3 86.7 Luxembourg 26.7 73.3 Hungary 0 100 Malta 22.2 77.8 Netherlands 21.4 78.6 Austria 42.9 57.1 Poland 25.0 75.0 Portugal 16.7 83.3 Romania 16.7 83.3 Slovenia 7.1 92.9 Slovakia 13.3 86.7 Finland 47.4 52.6 Sweden 50 50 United Kingdom 20 80
Table 21 – Sex distribution of members of regional assemblies – 2011
President Members
Women Men Women Men
EU-27 14 86 32 68
Belgium 40 60 40 60 Bulgaria - - - - Czech Republic 14 86 17 83 Denmark 40 60 34 66 Germany 19 81 33 67 Estonia - - - - Ireland - - - - Greece 8 92 17 83 Spain 35 65 43 57
France 8 92 48 52 Italy 9 91 12 88 Cyprus - - - -
Latvia 40 60 21 79 Lithuania - - - - Luxembourg - - - - Hungary 10 90 10 90 Malta - - - - The Netherlands 8 92 36 64
Austria 11 89 30 70
Poland 6 94 22 78 Portugal 0 100 21 79 Romania 2 98 15 85 Slovenia - - - - Slovakia 0 100 15 85 Finland 25 75 42 58 Sweden 25 75 47 53 United Kingdom 50 50 31 69
Table 22 – Sex distribution of members of single/lower houses in national parliaments – 2011
Women Men
EU-27 24.2 75.8
Belgium 40 60 Bulgaria 22.1 77.9 Czech Republic 22.4 77.6
Denmark 39.1 60.9 Germany 32.9 67.1 Estonia 19.8 80.2 Ireland 15.1 84.9 Greece 17.3 82.7 Spain 28.7 71.3 France 19.2 80.8 Italy 21.4 78.6 Cyprus 10.7 89.3 Latvia 21.0 79.0 Lithuania 19.1 80.9 Luxembourg 23.7 76.3 Hungary 8.8 91.2 Malta 8.7 91.3 Netherlands 40.7 59.3 Austria 27.3 72.7 Poland 23.9 76.1 Portugal 29.1 70.9 Romania 11.2 88.8 Slovenia 16.7 83.3 Slovakia 16.0 84.0 Finland 42.5 57.5 Sweden 45.0 55.0 United Kingdom 22.2 77.8