© photos: www.shutterstock.com/www.istockphoto.com
Additional information on the European Union is available on the Internet. It can be accessed through the Europa server (http://europa.eu).
© European Union, 2010
Reproduction is authorised provided the source is acknowledged.
Cataloguing data can be found at the end of this publication.
Luxembourg: Offi ce for Offi cial Publications of the European Union, 2010
ISBN 978-92-79-14249-9 doi 10.2772/79268
Printed in Belgium
PRINTEDONWHITECHLORINE-FREEPAPER
Europe Direct is a service to help you fi nd answers
to your questions about the European Union
Freephone number (*):
00 800 6 7 8 9 10 11
TABLE OF CONTENTS
1 Background 5
2 The Scoreboard 7
3 Consumer Market Monitoring Results 11
3.1 Market Performance Indicator (MPI) 11
3.2 Market Performance Indicator including Switching (MPIS) 14
3.3 Comparability 14
3.4 Trust 16
3.5 Problems 17
3.6 Complaints 17
3.7 Overall Satisfaction 19
3.8 Switching 20
4 Prices 22
5 Complaints 27
6 Safety 31
7 Conclusions and Next Steps 35
Annex I 38
1. BACKGROUND
Innovation and increased effi ciency are key to maintaining and improving the competitive advantage of the EU.
Consumer policy can play an important role in stimulating both innova-tion and effi ciency. Eff ective enforcement of consumer rights sustains and can, in some cases, rebuild trust in markets. Empowered consumers, who can understand the ever more complex choices given to them, can reward the most effi cient and innovative manufacturers and providers. In contrast, markets where consumer rights are not protected and where consumers fi nd it hard to identify and compare quality and price may experience consumer detriment, loss of confi dence and reduced incentives for quality improvement and effi ciency.
A recent study has shown that the losses reported by European consumers, as a result of problems for which they had a cause for complaint are esti-mated to represent approximately 0.3 % of EU’s GDP1
.
Provided they are informed and confi dent, Europe’s consumers are poten-tially its trump card in transforming our economy.
Market monitoring, deployed to analyse how well the economy is working from a consumer point of view and to identify the sectors where effi ciency improvements are possible, can steer policy to areas where it can pay the greatest dividends.
The Commission has therefore developed the Consumer Markets Scoreboard to regularly monitor how the single market is working for consumers.
The Scoreboard is a key diagnostic tool for implementing the EU2020 strategy2
which recognizes that:
“To gear the single market to serve the Europe 2020 goals requires well func-tioning and well-connected markets where competition and consumer access stimulate growth and innovation.”
The Monti report3
on the single market also highlights that “Consumers and consumer welfare should be at the centre of the next stage of the single market.”
The Digital Agenda for Europe4
also identifi ed the need to empower consumers: “the comparability of consumer prices, e.g. through benchmarking, product testing or price comparison websites, could be improved to drive competition and to enhance consumer protection.”
The Scoreboard is also essential to identify how to deliver on the commit-ment made by President Barroso “to ensure that the benefi ts of the internal market get through to the fi nal consumer”5
.
The Scoreboard is designed to reveal which markets have the highest risk of consumer market malfunctioning. In-depth studies of the problematic markets will follow, to analyse the problems and identify solutions.
While each market has its own unique characteristics, there is a need to compare diff erent markets in order to understand the perspective of Europe’s consumers. The individual characteristics of each market will be taken fully into account in the in-depth studies.
1 Eurostat EB73.3 – forthcoming. 2 COM(2010) 2020.
3 A New Strategy for the Single Market – May 2010. 4 COM(2010)245 fi nal.
Consumer market malfunctioning is characterised by the existence of consumer detriment which can appear even in very competitive markets. Consumer markets may suff er from malfunctioning caused not only by anticompetitive practices, but also by failure of traders to comply with laws designed to protect consumers against fraud, misleading or decep-tive advertising, unfair commercial practices and unfair contract terms. In addition, for many goods and services, complex or voluminous informa-tion which is diffi cult to understand prevents consumers from making well informed decisions. For example, more than a third of European consumers say that they have diffi culties comparing off ers from diff erent providers of various fi nancial services6
.
Switching has a positive role in stimulating competition in the market and higher switching rates are linked with less frequent price increases6
. However, the rate of switching tends to be quite low for many services.
2. THE SCOREBOARD
The Scoreboard is composed of a series of indicators.
COMPLAINTS
The fact that consumers take the eff ort to report “complaints” and that complaints are shared by several consumers is the most commonly used indicator of consumer market malfunctioning.
Complaints data are collected by public authorities in all Member States but are not harmonised and so do not allow comparison between markets or countries. The Commission therefore adopted, in May 2010, a Recom-mendation introducing a harmonized methodology for the classifi cation and reporting of consumer complaints to the Commission7
. This method-ology is expected to deliver comparable complaints data, starting in 2011. As well as indicating which markets have a higher number of complaints, the data will also indicate common problems across markets.
MARKET MONITORING SURVEY
The market monitoring survey 8
is a pioneering achievement. It provides comparable consumer opinions, for 27 countries plus Norway, for 50 consumer markets, which cover more than 60 % of budgets (it does not cover housing, most medical products and services or education). Similar surveys have previously been carried out only at national level or for a small number of markets. In addition, the survey was conducted only with consumers who had recent purchasing experience of each market, ensuring that it refl ects pertinent experience and not uninformed opinion. The survey will be repeated in the future, enabling progress to be tracked over time. While not capturing all aspects of market functioning, given that consumer welfare is the desired outcome of markets, consumer opinions
are in some ways the acid test of how well a market is working. Such opin-ions are also used by businesses extensively and therefore give a telling, if incomplete, picture of market malfunctioning.
In order to guarantee representativeness, the survey used random sampling. The telephone interviews were conducted, between March and May 2010, on a sample of 500 citizens in each EU Member States (250 for Malta, Cyprus and Luxembourg) for each market. The EU level results are based on a confi dence level of 95 % and are contained within a confi dence interval of up to +/- 0.85 %.
The survey covers fi ve main dimensions of consumer markets: compara-bility, trust, problems and complaints, satisfaction and switching.
The “comparability” indicator measures the ability of consumers to
compare products and services off ered by businesses and implicitly covers both price and quality. In markets with high comparability, consumers will make the best choices and will reward innovation and effi ciency, whereas markets with low comparability more likely indicate a misallocation of resources. If consumers are not in a position to maximize their welfare through informed choice, then the effi ciency even of competitive markets will be undermined.
The “trust” indicator measures the extent to which consumers feel confi
-dent that businesses comply with consumer legislation. It indicates the sectors where consumer trust needs to be strengthened, e.g. through
7 C(2010)3021 fi nal.
increased transparency for consumers or better enforcement. Markets where consumer confi dence in the law abiding nature of market opera-tors is low will also tend to penalise honest traders and ultimately lead to consumer exit from the market.
The indicator of consumer “satisfaction” reveals whether markets live up to what consumers want, giving potential clues about the extent of other failures not revealed by specifi c indicators.
The “problem” indicator captures issues which do not appear in traditional
complaints statistics. “Complaints” and problems combined provide an indication of the severity of the problems and of possible consumer detri-ment by incorporating both the frequency of problems and complaints.
“Switching” gives an indication of the level of choice and of consumers’
ability to exercise this choice. Low levels of actual switching and the perceived diffi culty of switching are a cause for concern and, in liberalised sectors, risk neutralising the benefi ts of the liberalisation process. Markets without switching might exhibit barriers to new entrants, which cripple competition. At the same time switching is linked to market innovation, consumer awareness, change of address or personal situation, etc.
Although the survey is comparable for all 50 markets the questions were adapted to refl ect:
• the specifi c name of each market,
• diff erences between goods and services,
• the specifi c time frame for each market,
• the frequency of usage and occurrence (e.g. the occurrence of prob-lems will be based on the “last occasion” for some products or on “how many times” in a given period of time for continuous service markets).
The answer is specifi c to each type of question:
• The answer for “comparability”, “trust”, “satisfaction” and “perceived
ease of switching” was based on scale from 0 (lowest) to 10 (highest).
• For the “problem” question a “yes/no” answer was used for good product markets, while respondents were asked the exact number of problems in a given timeframe for services.
• For the “complaint” question, 5 diff erent answers were possible to indicate to whom the consumer had complained.
• The “actual switching” question has 3 diff erent answers,
character-ising the type of switching behaviour: (i) switched services/products but stayed with the same provider/supplier, (ii) changed supplier/ provider or (iii) no switching.
The “Don’t know” answer was not available as, based on the initial screening, respondents only received questions about a market they indi-cated experience with.
Respondents were required to have experience during the last year, while some markets, which are used less frequently, had a longer time frame: 2 years for “house maintenance and improvement” goods and services, all three categories of banking services, large domestic appli-ances and vehicle rental; 3 years for new and second-hand cars, real estate services, “legal services, accountancy and notary services”, funeral services as well as “removal and storage services”. A screening ques-tion was used to select only respondents who had made purchases in each market.
A composite index was calculated based on the results of the survey. The Market Performance Indicator (MPI) incorporates: “comparability”, “trust”, “problems & complaints” and “satisfaction”. An additional index (MPIS – Market Performance Indicator including Switching) is calculated for the 11 markets where switching data are available. An assumption was made that all components of these two indexes should be weighted equally.
For the “comparability”, “trust” and “satisfaction” components, the score was calculated by taking the mean of the answers of all respondents.
The score of the “problems & complaints” component is calculated by simultaneously taking into account the answers to the problem and complaint questions:
• When a respondent did not experience any problems (and there-fore automatically did not receive the complaint question), a score of 10 was assigned to this component.
• When a respondent experienced a problem, but did not complain, a score of 5 was assigned to this component.
• When a respondent experienced a problem and complained, the score depended on the recipient of the complaint: a score of 3 when complaining to friends, family, relatives; a score of 2 when complaining to a retailer/provider; a score of 2 when complaining to a manufacturer; a score of 0 when complaining to a third-party complaints body. This reply refl ects the severity of the problem as experienced by the consumer.
The score for the “switching” question is calculated by simultaneously taking into account the answers to the two switching questions (actual
switching and perceived ease of switching):
• When a respondent did not switch (actual switching question) and indicated a certain level of perceived ease of switching, the total
score for this component equals the indicated level of the perceived ease of switching.
• When a respondent did switch and indicated a certain level of perceived ease of switching, the total score for this component equals 10 + the indicated level of the perceived ease of switching divided by 2.
PRICES
Together with more choice and higher quality, the promise of lower prices through integration, is one of the most important benefi ts the single market holds out to European citizens. The lack of price convergence is an important indicator of single market fragmentation. However, local costs, transportation and logistic factors, the impact of local demand, culture and taste also need to be properly taken into account.
The analysis of price data in the Scoreboard relies on prices of comparable and representative products in EU countries. The analysis is based on the standard measures of price diff erentiation (the coeffi cient of variation) in relation to the degree of adjustment of prices to the local level of total consumption expenditure (i.e. the correlation between prices and “actual individual consumption”) which is a measure of consumer spending power. The need for further investigation is therefore greatest in those sectors where prices seem to diverge widely across EU countries without refl ecting the diff erent levels of purchasing power in those countries.
Figure 1: Market Performance Indicator (MPI) – countries weighted according to population
3. CONSUMER MARKET
MONITORING RESULTS
Market Monitoring Survey
3.1 Market Performance Indicator (MPI)
The ranking of sectors, based on the Market Performance Indicator (MPI) as well as on the individual components, is presented at EU level in the following charts. National rankings based on the MPI are set out in Annex II.
Figure 1 present the MPI score, at EU27 level, for each of the 50 consumer
markets. Lower MPI scores are an indication of possible malfunctioning of the specifi c market from a consumer point of view. Figure 1 takes into account the size of the population of each country. This means that the results of large Member States have a greater infl uence on the result than the results of small Member States, and therefore refl ect the opinions of European consumers as a whole.
Figure 2presents the MPI at EU27 level, while giving the same weight to
each country. This gives a clearer picture of the extent to which problems are shared between Member States, irrespective of size.
The comparison of these fi gures reveals that some sectors perform consid-erably worse in larger Member States than overall across the EU. This is the case for railways9
(10 places lower in the population ranked chart), fuels
9 Clearly in comparing MPIs across markets, it should also be considered that the quality of some public services (e.g. railways) can only partly be related to providers but it is also infl uenced by infrastructure.
60 65 70 75 80 85
83.5 81.8 81.5 80.9 80.7 80.3 79.8 79.7 79.5 79.3 79.2 78.8 78.8 78.8 78.3 78.2 78.0 77.9 77.8 77.7 77.3 77.2 77.1 77.1 76.9 76.9 76.9 76.7 76.5 76.4 76.2 76.0 75.6 75.6 75.1 74.6 73.8 73.6 72.9 72.8 72.6 72.6 71.5 71.4 71.3 70.8 70.6 69.9 68.1 65.3 Investments, pensions and securities
Figure 2: Market Performance Indicator (MPI) –
equal country weighting and transport insurance (9 places lower), fi xed telephony (6 places), airlines (5 places) as well as postal services and couriers (5 places).
The markets which consistently have the lowest MPI scores in both rank-ings are:
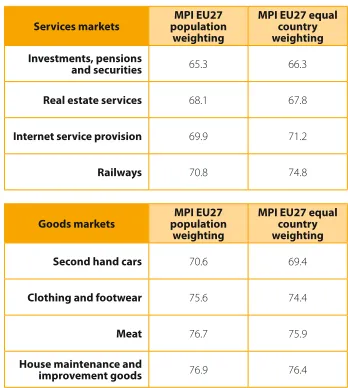
The analysis of consumer markets takes into consideration the importance of each market in the household budget. Figure 3 shows the MPI indicator in relation to data from the Household Budget Survey10
(HBS) which shows the percentage of consumer expenditure. For some markets the HBS fi gure might seem low: e.g. for loans and mortgages, as the fi gures only represent the costs and administrative fees excluding loan reimbursement. There are also some markets which, despite their low share in expenditure, have a major impact on household wealth (investments, pensions and securities; real estate brokers; banking – credit).
10 Eurostat fi gures for 2005 and estimates for missing categories
60 65 70 75 80 85
83.7 82.8 81.8 81.0 80.8 80.1 79.7 79.4 79.3 79.3 79.2 79.2 79.2 79.1 78.8 78.5 78.3 78.1 78.0 77.4 77.3 77.2 77.2 77.1 77.1 77.1 77.0 76.8 76.8 76.4 76.2 76.1 75.9 75.7 75.0 74.8 74.5 74.4 74.1 73.5 73.2 73.1 72.9 72.1 71.9 71.8 71.2 69.4 67.8 66.3 Investments, pensions and securities
Real estate services Second-hand cars Internet service provision House maintenance & improvement services Electricity Banking – Credits Mobile telephony Legal services, accountancy & notary services Maintenance & repair of vehicles Banking – Current accounts Water supply Clothing and footwear Removals and storage Railways Fixed telephony Network gas Food – Meat Tram, bus, metro Insurance – Dwelling House maintenance & improvement goods Packaged travel & tours Gambling, lotteries, betting Restaurants and bars Food – Fruits and vegetables ICT goods Vehicle rental Fuels New cars Insurance – Transport Leisure goods Food – Other Furnishings, furniture Over-the-counter medication Postal services & couriers Airlines Funeral services Dental services Electronic goods (non ICT/recreational) Small domestic appliances Large domestic appliances Personal care products Holiday accommodation Sport and leisure services Alcoholic beverages Non-alcoholic beverages Food – Bread, cereals, rice Cultural and entertainment services Personal care services Books, magazines, newspapers
Source: Market monitoring survey
Goods markets
MPI EU27 population
weighting
MPI EU27 equal country weighting
Second hand cars 70.6 69.4
Clothing and footwear 75.6 74.4
Meat 76.7 75.9
House maintenance and
improvement goods 76.9 76.4
Services markets
MPI EU27 population
weighting
MPI EU27 equal country weighting
Investments, pensions
and securities 65.3 66.3
Real estate services 68.1 67.8
Internet service provision 69.9 71.2
Source: Market monitoring survey, Eurostat data, estimates
40
14
48
25 12
21 23
35
44
13 38
31
37
8
10
50 24
There is a clear tendency towards a higher MPI ranking in the markets where consumers spend more money. At the same time, the potential loss to consumers, due to market malfunctioning, is higher in the markets where consumers spend a higher share of their budgets compared with the markets where they spend less.
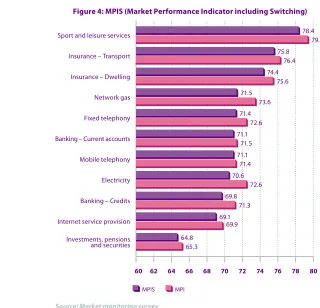
3.2 Market Performance Indicator including Switching (MPIS)
The switching indicator is available for 11 of the 50 consumer markets included in the monitoring. The Market Performance Indicator with Switching (MPIS) is presented below. The MPIS index is calculated based on all 5 dimensions (including switching) for the 11 markets where switching data is available. All components have an equal weight.
Gas and electricity are the markets for which the switching indicator brings down the MPIS most.
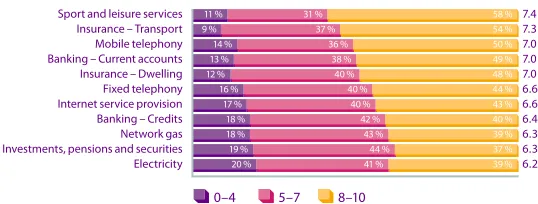
3.3 Comparability
Although overall 52 % of consumers in the EU fi nd it easy to compare goods and services (scores of 8 to 10), as many as 12 % fi nd comparability quite challenging (scores of 0 to 4).
Figure 5 to Figure 9 show the components of the MPI / MPIS indicators.
[image:14.842.135.455.112.420.2]They include the percentage of respondents sharing a certain view and the average score for each market on a scale from 0 (lowest) to 10 (highest). Figure 4: MPIS (Market Performance Indicator including Switching)
Source: Market monitoring survey
There is a clear link between the ranking of the comparability indicator and the overall results of the MPI. Nevertheless there are some markets where comparability appears to be less of a problem (e.g. second-hand cars, gambling and lotteries). There are also markets which are signifi cantly worse in terms of comparability compared to the overall dimensions of the MPI. For such markets (e.g. dental services, over-the-counter medica-tion, funeral services) comparability is one aspect that could be improved. In addition, although it applies to goods and services, the comparability indicator has to be considered with caution for markets where there is no real competition (e.g. railways, tram, bus and metro).
The markets where consumers fi nd it most diffi cult to compare products or services are banking, mobile and fi xed telephony, water, gas, electricity and specifi c aspects of housing (real estate services, legal services and accountancy). Potential reasons for this may be the limited number of providers; cluttered and fragmented markets requiring “technical exper-tise” most consumers don’t have (housing, fi nancial services); fast tech-nological development (telecoms services) or the abundance, complexity high number of off ers and providers (mobile telephony, banking).
Figure 5: Comparability
On a scale from 0 to 10, how diffi cult or easy was it to compare the products/services sold by diff erent suppliers?
0 – 4 5 – 7 8 –10
3.4 Trust
14 % of European consumers do not trust suppliers or retailers to comply with rules and regulations protecting them (see Figure 6).
Figure 6 reveals that the “trust” ranking is not necessarily aligned with the
MPI ranking. Some markets, such as postal services, dental or funeral serv-ices perform better. Legal, notary servserv-ices & accountancy have an average rating for “trust” whereas they are poorly rated for “comparability”. These markets are clearly exposed to a higher risk of problems caused by asym-metric information.
Two markets are particularly distrusted by European consumers: “invest-ments, pensions and securities” and “second hand cars”. In these markets, the negative ratings equal or even surpasses the positive ratings. The current economic and fi nancial crisis might explain some of the distrust of consumers. Opacity and diff erence between the advertised off er and the results of the service rendered might also explain these results.
Some other markets also show poor results for “trust”: telecoms services in general (fi xed telephony, mobile telephony and internet service provision), energy services (electricity, gas and fuel), meat, clothing and footwear and the banking sector (current account and credit products), railways and house maintenance. The existence of sector specifi c consumer regulation or the fast technological development in some markets could infl uence the results. For instance consumers may not be aware that some services are not the responsibility of their provider.
The most “trusted” markets are either “personal” services (personal care, dental or funeral services), white goods (small or large household appli-ances) and “fast moving” categories (such as bread, rice and cereals or books, magazines and newspapers). Most of these markets are regulated to a lesser extent. Postal services are also considered as “trusted partners” by European consumers.
Figure 6: Trust
On a scale from 0 to 10, to what extent do you trust suppliers to respect the rules and regulations protecting consumers?
0 – 4 5 – 7 8 –10
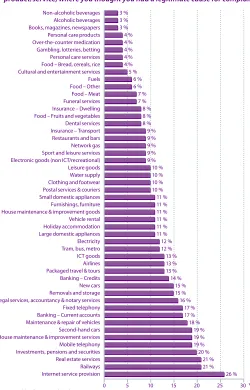
3.5 Problems
11 % of European consumers across the 50 markets surveyed said they experienced one or more problems.
The ranking of sectors based on the occurrence of problems refl ects only partially the overall MPI ranking since a positive MPI score does not
neces-sarily mean a low level of problems, and vice versa.
However, most of the bottom markets in terms of MPI also score poorly on the level of problems encountered by consumers.
Airlines and new cars show the biggest decrease in their ranking based on the problem indicator as compared to the MPI. Some of the markets which have an improved ranking are: gambling, lotteries and betting; fuels; insur-ance – dwelling; network gas; insurinsur-ance – transport.
Insurance services are generally better ranked in terms of problem occurrence than for trust or comparability. The same applies for energy services.
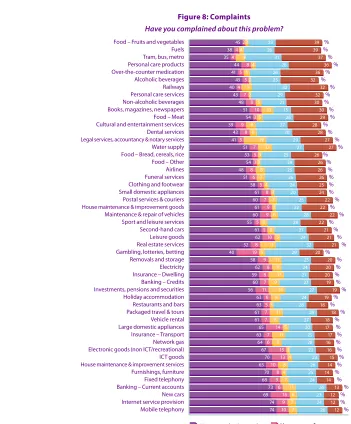
3.6 Complaints
The complaints question reveals that overall one in fi ve consumers did not complain despite having a legitimate reason to do so (according to them).
Most consumers (58 %) made a complaint to the retailer or service provider. Only 8 % of consumers addressed their complaint directly to the manufacturer.
A large proportion of consumers (26 %) shared their problem with friends or relatives. This confi rms the importance of “word-of-mouth” in spreading “experiences”.
[image:17.842.386.636.146.536.2]Source: Market monitoring survey
Figure 7: Problems
Did you experience a problem with that product/service or the supplier of that product/service, where you thought you had a legitimate cause for complaint?
0 5 10 15 20 25 30 3 %
3 % 3 % 4 % 4 % 4 % 4 % 4 % 5 %
6 % 6 % 7 % 7 % 8 % 8 % 8 % 9 % 9 % 9 % 9 % 9 % 10 % 10 % 10 % 10 % 11 % 11 % 11 % 11 % 11 % 11 % 12 % 12 % 13 % 13 % 13 % 14 %
15 % 15 % 16 %
17 % 17 % 18 %
19 % 19 % 19 % 20 %
21 % 21 %
26 %
Finally, consumers rarely make complaints to offi cial third-parties or consumer organisations. Only 8 % of them did so.
There is no consistent link across all markets between the occurrence of problems and complaints.
For low-cost items consumers tend more than average not to introduce a complaint. For high-cost items or services, consumers introduce a complaint more systematically and for certain essential services, such as telecom services or bank (current) accounts, consumers also complain rather frequently. This could partly be related to the existence of more information about their rights and complaint procedures for some markets, the high number of contracts for a service, their complexity or the impor-tance given to them by consumers.
[image:18.842.111.462.107.531.2]In some markets the proportion of problems is high while the percentage of consumers who complained remains low: railways, bus/tram/metro, airline services and legal services and accountancy. This may be explained by the existence of real or perceived barriers which deter consumers from complaining (complexity of procedure, absence of consumer information about rights and obligations, etc).
Figure 8: Complaints
Have you complained about this problem?
Food – Fruits and vegetables Fuels Tram, bus, metro Personal care products Over-the-counter medication Alcoholic beverages Railways Personal care services Non-alcoholic beverages Books, magazines, newspapers Food – Meat Cultural and entertainment services Dental services
Legal services, accountancy & notary services
Water supply Food – Bread, cereals, rice Food – Other Airlines Funeral services Clothing and footwear Small domestic appliances Postal services & couriers
House maintenance & improvement goods
Maintenance & repair of vehicles Sport and leisure services Second-hand cars Leisure goods Real estate services Gambling, lotteries, betting Removals and storage Electricity Insurance – Dwelling Banking – Credits Investments, pensions and securities Holiday accommodation Restaurants and bars Packaged travel & tours Vehicle rental Large domestic appliances Insurance – Transport Network gas Electronic goods (non ICT/recreational) ICT goods
House maintenance & improvement services
Furnishings, furniture Fixed telephony Banking – Current accounts New cars Internet service provision Mobile telephony % % % % % % % % % % % % % % % % % % % % % % % % % % % % % % % % % % % % % % % % % % % %% % % % % % % % 45 38 35 44 41 45 40 43 48 51 54 39 43 41 51 53 54 48 51 58 61 60 61 60 55 61 62 52 40 58 62 59 60 56 63 63 61 61 65 63 64 67 70 65 70 68 73 69 74 74 2 4 4 8 5 5 4 7 8 10 3 9 8 5 7 5 3 8 6 5 8 7 9 9 5 5 10 8 19 9 8 8 7 11 6 5 7 7 14 7 6 15 13 10 8 9 6 16 9 10 3 4 8 4 5 2 9 2 5 10 5 8 6 19 12 3 3 8 7 4 3 7 3 6 6 6 5 13 5 11 8 13 9 14 8 3 11 8 5 11 8 3 4 8 4 7 11 6 7 7 23 26 31 28 26 25 32 29 21 15 26 27 30 29 27 25 29 25 26 24 20 25 22 28 28 27 24 32 29 25 24 21 27 27 24 28 29 27 20 25 28 22 23 26 25 24 26 23 24 26 39 39 37 36 36 32 32 32 30 30 29 28 28 27 27 26 26 26 26 25 24 22 22 22 22 21 21 21 20 20 20 20 19 19 19 18 18 18 17 17 16 16 15 14 14 14 13 12 12 12
Yes – retailer / provider
3.7 Overall Satisfaction
The satisfaction question measures satisfaction in a way that attenuates the problems connected with diff erent expectations across countries and consumers.
Most consumers (57 %) state that markets “deliver” to the desired level. In almost 10 % of cases, consumers feel that a market does not live up to what they want.
“New cars” is the market whose position on this indicator increases most compared to its MPI ranking.
Figure 9: Overall satisfaction
On a scale from 0 to 10, to what extent did the products/services on off er from diff erent suppliers live up to what you wanted within the past period?
8.1 8.0 7.9 7.9 7.8 7.8 7.8 7.8 7.8 7.8 7.8 7.8 7.8 7.7 7.7 7.7 7.7 7.7 7.7 7.6 7.6 7.6 7.6 7.5 7.5 7.5 7.5 7.5 7.4 7.4 7.4 7.4 7.3 7.3 7.3 7.3 7.3 7.3 7.2 7.2 7.2 7.2 7.1 7.1 7.1 7.0 6.9 6.8 6.5 6.3 Books, magazines, newspapers
Cultural and entertainment services Personal care services Dental services Non-alcoholic beverages Electronic goods (non ICT/recreational) Alcoholic beverages Large domestic appliances Food – Bread, cereals, rice Holiday accommodation Small domestic appliances Funeral services New cars Sport and leisure services Furnishings, furniture Personal care products Over-the-counter medication Leisure goods Packaged travel & tours Airlines ICT goods Vehicle rental Food – Other Water supply Postal services & couriers Restaurants and bars Insurance – Transport House maintenance & improvement goods Food – Fruits and vegetables Clothing and footwear Food – Meat Maintenance & repair of vehicles Insurance – Dwelling Removals and storage Fixed telephony Fuels Mobile telephony House maintenance & improvement services Tram, bus, metro Legal services, accountancy & notary services Network gas Electricity Banking – Current accounts Internet service provision Second-hand cars Banking – Credits Gambling, lotteries, betting Railways Real estate services Investments, pensions and securities
4 % 3 % 4 % 6 % 4 % 3 % 4 % 5 % 4 % 4 % 4 % 6 % 5 % 4 % 4 % 4 % 6 % 4 % 5 % 5 % 5 % 5 % 5 % 7 % 8 % 4 % 6 % 5 % 6 % 6 % 6 % 9 % 7 % 8 % 9 % 10 % 9 % 8 % 9 % 10 % 10 % 11 % 10 % 9 % 10 % 10 % 14 % 14 % 15 % 17 % 28 % 28 % 31 % 30 % 31 % 34 % 31 % 31 % 31 % 32 % 32 % 31 % 31 % 33 % 34 % 35 % 34 % 36 % 35 % 34 % 35 % 35 % 38 % 33 % 35 % 41 % 37 % 39 % 40 % 38 % 39 % 36 % 40 % 38 % 37 % 35 % 39 % 40 % 40 % 37 % 38 % 36 % 40 % 42 % 41 % 41 % 37 % 42 % 46 % 50 % 69 % 69 % 66 % 65 % 65 % 63 % 65 % 65 % 65 % 64 % 64 % 64 % 64 % 63 % 62 % 61 % 61 % 60 % 61 % 61 % 60 % 60 % 57 % 59 % 58 % 55 % 57 % 56 % 54 % 55 % 55 % 55 % 53 % 54 % 54 % 55 % 53 % 52 % 51 % 53 % 52 % 53 % 50 % 49 % 49 % 49 % 49 % 44 % 39 % 34 %
3.8 Switching
As many as 85 % of consumers did not switch suppliers or the service they have with their current supplier. Consumers may be content with their current products or provider, but they may also not be aware of the possi-bility of switching, they may perceive switching as a complex and time/ money-consuming process without any “guarantee” that service or product delivery will be signifi cantly better elsewhere, or they may display “inertia”. Regarding those consumers who switched, 10 % switched suppliers while 7 % changed products and services with the same supplier.
Within the 11 switching markets, the levels and types of switching are quite diverse. This applies both at EU and at country level. The overall levels of switching suggest considerable scope for more switching.
“Investments, pensions and securities”, and telecoms services (mobile telephony, internet and fi xed telephony) are the services that have reported a higher level of switching. Specifi c rules for number portability may partly explain the high ranking for telecoms services.
The next question measures consumer perception of the ease of switching. Less than half (46 %) of consumers perceive it as (very) easy to switch, 39 % are more neutral and, last but not least, 15 % believe switching is (very) diffi cult. The results below show the assessment of both those who did switch and those who did not.
11 The period of switching for each service is available in the market monitoring survey available on http://ec.europa.eu/consumers/strategy/facts_en.htm.
Source: Market monitoring survey
[image:20.842.192.456.143.260.2]Source: Market monitoring survey
[image:20.842.190.459.332.434.2]Figure 10: Actual switching11
Figure 11: Presumed ease of switching
Have you switched tariff plan or supplier in the past period?
On a scale from 0 to 10, how diffi cult or easy do you think it is to switch supplier?
0 – 4 5 – 7 8 –10
Prices are an important outcome for consumers and a major determinant of their purchasing decisions. In the single market price divergence across Member States, which is not explained by divergent levels of consumer spending power, by consumer preferences, by product specifi c taxes, by local costs, can provide a good indication of the level of fragmentation of consumer markets.
Diff erent sources were used to gather the price data set out in the following charts.
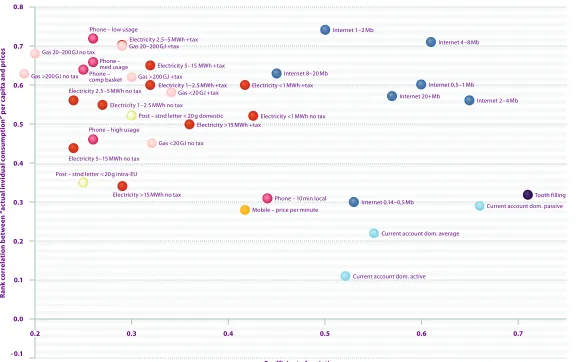
Figure 12 presents on its horizontal axis how much the prices of various
services vary across the EU. The vertical axis shows the strength of the correlation between how EU countries are ranked based on the price of each service and how EU countries are ranked based on a measure of consumer spending power. A value of 1 for the correlation means that the ranking of EU countries based on the price of a service is the same as the ranking based on consumption; a value of 0 means there is no relation between the two rankings.
Figure 12andFigure 13 show that prices of services, in general, show
a wider divergence across EU Member States than prices of goods. This can be partly explained by the lower tradability of services. When refer-ring to particular services, the markets which display the largest variability appear to include internet service provision, tooth fi lling (dental services) and current accounts. For the two later markets the variability is not related to the level of consumption expenditure in EU countries. As regards goods, cars show a low divergence due to intense competition and the enhanced potential for cross-border trade, following the enforcement of competi-tion rules by the Commission. The prices of telecom services are based on profi les and median prices. The interest rates for house and consumer loans (adjusted for infl ation) are negatively correlated with the levels of consumption (i.e. loans appear to be more expensive in countries with lower consumer spending and vice versa). This can partially refl ect the
4. PRICES
higher risk premiums and increased costs of funding which are typical in faster growing countries. The data on dental services are very limited and therefore conclusions should not be drawn on this basis.
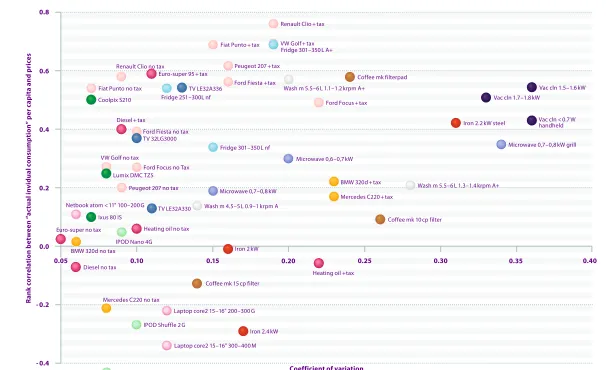
Figure 13 reveals that pre-tax car prices tend to be very similar across
Member States, indicating quite close convergence at EU level. Taxes are responsible for the added variation. Prices of electrical goods tend to vary more widely and vacuum cleaners have the highest variation across Member States. Electronic goods such as televisions and media players vary much less in price across the EU.
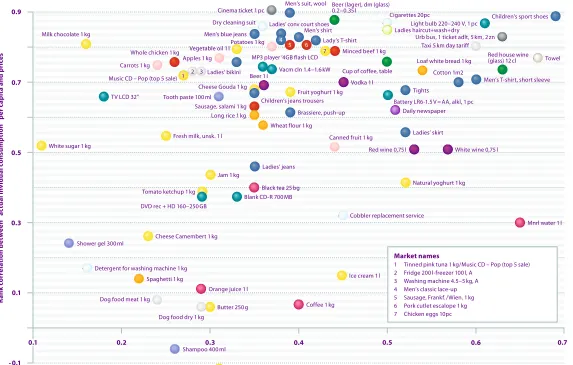
Figure 14 shows prices provided by Eurostat as part of a research project
carried out with the national statistical offi ces. The intention is that a suffi cient number of products prices will be collected on a regular basis to allow an assessment of price divergence and fragmentation in retail markets. Within the 2009 project, prices were collected for 91 products of which 79 (70 goods and 9 services) were deemed suffi ciently comparable for use. They display a very strong correlation between their prices and consumption.
There is a clear need to expand the number of collected prices in order to cover all 50 sectors included in the market monitoring work.
Figure 12: Prices of services – variation across Member States and relation with consumption
0.7
0.6
0.5
0.4
0.3
0.2 0.8
0.1
0.0
- 0.1
0.3
0.2 0.4 0.5 0.6 0.7
Electricity 2.5 – 5 MWh + tax Gas 20 – 200 GJ no tax
Phone – med usage Gas > 200 GJ no tax
Gas 20 – 200 GJ + tax
Gas > 200 GJ + tax
Gas < 20 GJ + tax
Gas < 20 GJ no tax Electricity 2.5 – 5 MWh no tax
Electricity 5 – 15 MWh no tax
Electricity 1 – 2.5 MWh no tax
Post – stnd letter < 20 g domestic
Post – stnd letter < 20 g intra-EU
Electricity > 15 MWh no tax
Phone – 10 min local Phone – low usage
Mobile – price per minute Internet 8 – 20 Mb
Internet 1 – 2 Mb
Internet 4 – 8 Mb
Internet 0,5 – 1 Mb Internet 20+ Mb
Internet 2 – 4 Mb
Internet 0,14 – 0,5 Mb
Current account dom. average
House loans (-0,67)
Current account dom. passive Tooth filling
Current account dom. active Phone –
comp basket
Electricity < 1 MWh + tax
Electricity < 1 MWh no tax Electricity > 15 MWh + tax
Electricity 1 – 2.5 MWh + tax Electricity 5 – 15 MWh + tax
Phone – high usage
Source: Table 2 and EUROSTAT fi gures
Coefficient of variation
R
a
n
k
c
o
rr
e
la
ti
o
n b
e
tw
e
e
n “
a
c
tu
a
l i
n
v
id
u
a
l c
o
n
su
m
p
ti
o
n
” p
e
r c
a
p
it
a
a
n
d p
ri
ce
s
Figure 13: Prices of goods – variation across Member States and relation with consumption
0.6
0.4
0.2
0.0 0.8
- 0.2
- 0.4
0.10
0.05 0.15 0.20 0.25 0.30 0.35 0.40
Fiat Punto + tax VW Golf + tax Renault Clio + tax
Ford Focus + tax
Microwave 0,6 – 0,7 kW
Microwave 0,7 – 0,8 kW grill
Microwave 0,7 – 0,8 kW Netbook atom < 11" 100 – 200 G
Coolpix S210
Peugeot 207 + tax Ford Fiesta + tax Renault Clio no tax
Ford Fiesta no tax
Ford Focus no Tax
Laptop core2 15 – 16" 200 – 300 G
Laptop core2 15 – 16" 300 – 400 M VW Golf no tax
Peugeot 207 no tax Fiat Punto no tax
Lumix DMC TZ5
Ixus 80 IS
IPOD Nano 4G
IPOD Shuffle 2 G
IPOD Nano 3G
Euro-super 95 + tax
Diesel no tax
Heating oil + tax Euro-super no tax Heating oil no tax
Diesel + tax
TV LE32A336
TV 32LG3000
TV LE32A330
Fridge 301 – 350 L A+
Fridge 301 – 350 L nf Fridge 251 – 300L nf
Iron 2 kW
Iron 2.4 kW
Iron 2.2 kW steel
BMW 320d no tax
Mercedes C220 + tax BMW 320d + tax
Mercedes C220 no tax
Wash m 5.5 – 6 L 1.1 – 1.2 krpm A+
Wash m 4.5 – 5 L 0.9 – 1 krpm A
Wash m 5.5 – 6 L 1.3 – 1.4 krpm A+ Coffee mk filterpad
Coffee mk 10 cp filter
Coffee mk 15 cp filter
Vac cln 1.5 – 1.6 kW
Vac cln < 0.7 W handheld Vac cln 1.7 – 1.8 kW
Source: Table 3 and EUROSTAT fi gures
Coefficient of variation
R
a
n
k
c
o
rr
e
la
ti
o
n b
e
tw
e
e
n “
a
c
tu
a
l i
n
v
id
u
a
l c
o
n
su
m
p
ti
o
n
” p
e
r c
a
p
it
a
a
n
d p
ri
ce
Figure 14: Eurostat prices: variation across Member States and relation with consumption 0.7 0.5 0.3 0.9 0.1 - 0.1 0.2
0.1 0.3 0.4 0.5 0.6 0.7
3 2
Cheese Gouda 1 kg
Brassiere, push-up
Ladies’ jeans Sausage, salami 1 kg
White sugar 1 kg
Fresh milk, unsk. 1 l
Cheese Camembert 1 kg
Butter 250 g Jam 1 kg
Ice cream 1 l
Natural yoghurt 1 kg Red wine 0,75 l
Cup of coffee, table
Fruit yoghurt 1 kg TV LCD 32"
DVD rec + HD 160 – 250 GB
Blank CD-R 700 MB MP3 player ’4GB flash LCD
Vacm cln 1.4 – 1.6 kW
Olive oil 1 l
Ladies’ skirt Tights
Daily newspaper
Men’s T-shirt, short sleeve Children’s sport shoes
Cotton 1m2 Ladies’ conv court shoes
Men’s shirt Lady’s T-shirt Men’s blue jeans
Ladies’ bikini
Men’s suit, wool
Children’s jeans trousers
Whole chicken 1 kg Minced beef 1 kg Milk chocolate 1 kg
Vegetable oil 1 l
Tomato ketchup 1 kg
Battery LR6-1.5 V = AA, alkl, 1 pc Light bulb 220 – 240 V, 1 pc
Urb bus, 1 ticket adlt, 5 km, 2 zn Taxi 5 km day tariff Cinema ticket 1 pc
Dog food meat 1 kg
Dog food dry 1 kg
Black tea 25 bg
Orange juice 1 l
Coffee 1 kg
Mnrl water 1 l
Shower gel 300 ml
Shampoo 400 ml Tooth paste 100 ml
Cobbler replacement service Cigarettes 20pc
Detergent for washing machine 1 kg
Towel
Music CD – Pop (top 5 sale)
Ladies haircut+wash+dry
Canned fruit 1 kg Carrots 1 kg
Apples 1 kg
Potatoes 1 kg
Spaghetti 1 kg
Wheat flour 1 kg Long rice 1 kg
Loaf white bread 1 kg Beer (lager), dm (glass)
0.2 – 0.35 l
Red house wine (glass) 12 cl
White wine 0,75 l Beer 1 l
Vodka 1 l
4
5 6
7
Source: Calculations based on Eurostat data (see Table 4)
Coefficient of variation
R a n k c o rr e la ti o n b e tw e e n “ a c tu a l i n v id u a l c o n su m p ti o n ” p e r c a p it a a n d p ri ce s Market names
1 Tinned pink tuna 1 kg / Music CD – Pop (top 5 sale) 2 Fridge 200 l-freezer 100 l, A
3 Washing machine 4.5 – 5 kg, A 4 Men’s classic lace-up 5 Sausage, Frankf. /Wien. 1 kg 6 Pork cutlet escalope 1 kg 7 Chicken eggs 10pc Dry cleaning suit
1
5. COMPLAINTS
At present, complaints data are only available based on the existing complaints classifi cation methodologies, which tend to vary signifi cantly between EU countries. The following data were provided by the members of the Consumer Markets Experts Group, composed of consumer policy authorities in the EU and EFTA countries. The data refl ects the number of consumer complaints collected by third parties (national authorities, regu-lators, consumer organisations, etc.).
Some EU countries (DE, ES, LU, PT) did not send complaints data in time for the publication of the Scoreboard.
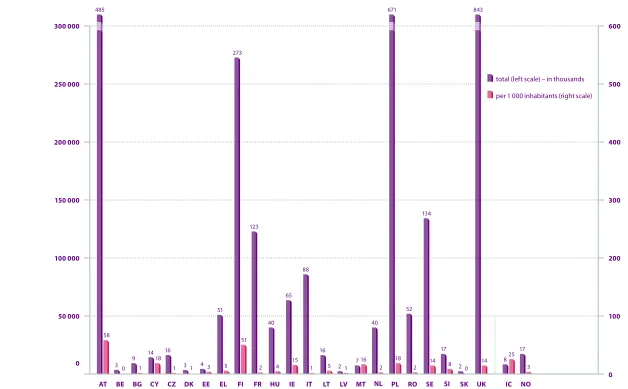
The data show that third-party complaint collecting bodies in the UK, Poland and Austria gathered the largest number of complaints. However, these numbers do not merely refl ect the prevalence of actual problems indicated by consumers in the market. They also reveal the eff ectiveness of the complaint collecting bodies, the level of consumer empowerment and willingness to complain when confronted with problems. It is therefore important to analyse complaints together with additional data in order to determine if a high number of complaints indicates market malfunctioning or if it only refl ects the success of consumer policy eff orts.
Figure 15: Consumer complaints by country – 2009
600
500
400
300
200
100
0 300 000
250 000
200 000
150 000
100 000
50 000
0
AT BE BG CY CZ DK EE EL FI FR HU IE IT LT LV MT NL PL RO SE SI SK UK IC NO
total (left scale) – in thousands
per 1 000 inhabitants (right scale)
485 671 843
0 0
25 3 17 52
8 58
3
9 18
1 1 31 4 16
3 51
5 273
51 123
2
40 40
4 65
15 88
1 1 16
5 2 2 2 2
7 16 18 134
14 14 8
17 14
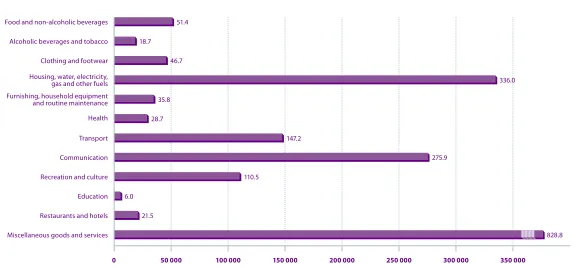
12 “Miscellaneous goods and services” include banking and insurance, “communication” includes internet, telephone and postal services.
Figure 16: Consumer complaints by market12 – 2009
336.0
35.8
147.2 28.7
275.9
110.5
6.0
21.5
828.8
0 50 000 100 000 150 000 200 000 250 000 300 000 350 000
51.4 Food and non-alcoholic beverages
18.7 Alcoholic beverages and tobacco
46.7 Clothing and footwear
Housing, water, electricity, gas and other fuels
Furnishing, household equipment and routine maintenance
Health
Transport
Communication
Recreation and culture
Education
Restaurants and hotels
6. SAFETY
Eurobarometer survey data show that safety is one of the main drivers of consumer choice, with as many as 50 % of consumers considering that safety is one of the aspects which most frequently infl uence their purchase choices in the case of non-food items13
.
Because the safety data presented below are based on a diff erent clas-sifi cation than the COICOP system used in the Scoreboard, they cannot be combined in a common indicator. In due course, the data on consumer complaints will also cover safety issues, giving a clearer picture of potential safety problems in diff erent markets and allowing safety to be incorpo-rated in an indicator of market malfunctioning.
The following data are taken from the European Injury Database (IDB) which presents the accident and injury statistics collected by hospitals in Member States. These data are only a sample of the overall safety incidents which occur annually in the EU. At present only some EU countries collect injury statistics.
The cases (sample) represent the number of accidents recorded in the sample of hospitals participating in the IDB project.
Further indications about the safety of products on the market are provided by the two EU-wide rapid alert systems which track dangerous consumer goods: RAPEX 14
for non-food products and RASFF 15
for food and feed products.
In the following years, the data on prices, complaints and safety will be further developed so that they can be integrated with the data from the screening survey into an overall market performance indicator.
13 EB298 – Consumer Protection in the Internal Market, June 2008.
Product involved in
the injury AT BE CY CZ DK EE DE LV MT NL SE
Aircraft or means of air transport 0.00 % – 0,00 % – 0.00 % – 0.00 % 0.00 % 0.00 % 0.00 % 0.00 %
Animal, plant, or person 7.80 % 18.60 % 2.90 % 14.90 % 11.20 % 39.40 % 6.60 % 13.40 % 6.50 % 4.00 % 11.90 %
Appliance mainly used in household 1.20 % 1.40 % 0.10 % 0.90 % 1.40 % 0.40 % 1.20 % 0.40 % 0.90 % 1.00 % 1.20 %
Building, building component or related
fitting 23.50 % 13.30 % 3.60 % 13.50 % 17.40 % 9.30 % 12.60 % 10.10 % 21.10 % 6.00 % 21.20 %
Equipment mainly used in sports / recreational
activity 5.80 % 4.20 % 0.00 % 4.90 % 3.80 % 7.50 % 1.80 % 1.70 % 2.80 % 3.60 % 5.00 %
Fire, flame, smoke 0.10 % 0.20 % 0.00 % – 0.10 % 0.10 % 0.20 % 0.50 % 0.20 % 0.10 % 0.10 %
Food, drink 0.40 % 1.80 % 0.00 % 0.20 % 0.60 % 0.20 % 0.50 % 0.40 % 0.90 % 1.30 % 1.10 %
Furniture / furnishing 3.50 % 7.40 % 0.50 % 3.70 % 2.90 % 2.70 % 4.10 % 1.70 % 2.50 % 2.60 % 2.10 %
Ground surface or surface conformation 1.00 % 17.80 % 0.30 % 2.90 % 1.40 % 1.90 % 22.20 % 13.90 % 3.80 % 0.80 % 3.00 %
Hot object / substance nec 0.40 % 0.30 % 0.00 % 0.20 % 0.20 % 0.30 % 0.30 % 0.80 % 0.50 % 0.00 % 0.10 %
Infant or child product 0.40 % 1.20 % 0.30 % 1.20 % 1.20 % 0.40 % 2.00 % 0.20 % 0.70 % 0.30 % 0.80 %
Item mainly for personal use 0.60 % 2.10 % 0.00 % 0.30 % 1.70 % 0.30 % 0.70 % 0.20 % 1.20 % 1.20 % 1.20 %
Land vehicle or means of land transport 5.80 % 9.50 % 8.90 % 7.30 % 5.30 % 4.00 % 6.10 % 4.60 % 5.80 % 6.90 % 6.10 %
Material nec 36.10 % 5.70 % 0.30 % 9.20 % 19.70 % 17.40 % 5.40 % 12.50 % 18.00 % 7.00 % 24.50 %
Medical / surgical device 0.00 % 1.40 % 0.00 % – 0.50 % – 0.00 % 0.00 % 0.00 % 0.10 % 0.00 %
Mobile machinery or special purpose vehicle 0.30 % 0.50 % 0.00 % 0.30 % 0.50 % 0.40 % 0.20 % 0.10 % 0.30 % 0.10 % 0.60 %
Other non-pharmaceutical chemical
substance 0.00 % 0.50 % 0.00 % 0.10 % 0.80 % – 0.70 % 0.20 % 0.60 % 0.30 % 0.50 %
Other specified object / substance 1.30 % 3.20 % 0.00 % 1.30 % 2.70 % 0.60 % 3.20 % 2.30 % 1.40 % 2.50 % 2.00 %
Pharmaceutical substance for human use, ie.
drug, medicine 0.00 % 1.00 % 0.10 % 0.10 % 1.00 % – 0.60 % 0.10 % 0.30 % 0.90 % 1.20 %
Tool, machine, apparatus mainly used for
work-related activity 4.60 % 4.50 % 0.10 % 1.80 % 3.30 % 2.60 % 2.30 % 4.40 % 5.40 % 2.70 % 5.10 %
Unspecified or no object / substance 4.40 % – 82.70 % 35.50 % 19.80 % 11.40 % 26.80 % 29.70 % 23.90 % 56.00 % 10.20 %
Utensil or container 2.60 % 4.60 % 0.10 % 1.30 % 4.20 % 1.10 % 2.00 % 2.30 % 2.80 % 2.50 % 1.80 %
Watercraft or means of water transport 0.10 % – 0.00 % – 0.00 % – 0.00 % 0.00 % 0.30 % 0.00 % 0.10 %
Weapon 0.10 % 0.50 % 0.00 % 0.30 % 0.10 % – 0.50 % 0.60 % 0.20 % 0.10 % 0.10 %
Total 100 % 100 % 100 % 100 % 100 % 100 % 100 % 100 % 100 % 100 % 100 %
Cases (sample) n= 19 921 3 844 11 513 5 180 78 663 1 647 5 558 115 934 5 120 295 847 96 954
Data from year: ’07, ’08 ’05, ’06 ’06, ’07,
’08 ’05, ’06 ’08 ’06, ’07 ’07, ’08
’05, ’06, ’07, ’08
’06, ’07, ’08
’06, ’07,
’08 ’07, ’08
R – Regular data / P – Pilot data R P R P R R R R R R R
[image:32.842.176.756.98.532.2]7 Beverages and bottled water
10 Feed
13 Confectionery, honey and royal jelly
13 Other food product / mixed
13 Soups, broths and sauces
15 Prepared dishes and snacks
17 Milk and milk products
22 Herbs and spices
25 Cocoa preparations, coffee and tea
37
Dietetic foods, food supplements, fortified foods
46 Fruit and vegetables
49 Food contact materials
53 Cereals and bakery products
57 Nuts, nut products and seeds
122 Fish, crustaceans and molluscs
58 Meat and meat products
0 20 40 60 80 100 120 140
7. CONCLUSIONS AND NEXT STEPS
The results from the EU-wide market monitoring survey provide a valuable new insight in understanding which parts of the single market may not deliver from a consumer point of view. A picture emerges of the poten-tially most problematic sectors as perceived by consumers.
While the data presented in the Scoreboard are only indicators, they provide a great deal of evidence for a range of further work at EU and national level:
• The data give an indication as to where the Commission and Member States should focus their eff orts and resources to inves-tigate and analyse consumer markets, through market studies, sectoral enquiries and other market monitoring tools.
• The question on trust gives an indication of where enforcement priorities should lie.
• The data provide a basis for policy makers at national and EU level to discuss – if this is not already the case – with representatives of the sectors concerned the reasons behind the performance levels revealed in the study. A deeper analysis of the reasons underlying in each specifi c market would help to interpret the results of the Scoreboard and to identify the areas where measures need to be taken.
FOLLOW-UP ACTIONS
The Commission will carry out two market studies every year on the basis of the Scoreboard, taking into account recent Commission studies on the relevant sectors. One study on the retail electricity market is due to be published at the end of this year and a further study on e-commerce has
recently been launched. Each study will investigate in depth the reasons behind the fi gures in the Scoreboard and identify the main policy issues to be tackled and possible policy remedies. The Commission will collect in-depth data about consumer experiences and opinions of the chosen markets, record actual consumer experiences of the market through “mystery shopping” and carry out a detailed price collection. Each market study will seek to involve stakeholders closely and will seek their views about the possible problems in order to integrate these into the data collection and analysis. The end result should be a detailed statement of the problems faced by consumers in the chosen market and the policy issues to be addressed.
The Scoreboard data show that internet16
service provision is the third worst ranking market according to the MPI while being the market where the highest percentage of consumers reported problems (out of the total of 50 markets). The estimated price of internet service provision also shows a wider variation across Member States which is however correlated with the total level of consumption in these countries. Internet service provision is essential for the empowerment of European citizens and the digital single market. Therefore, this will be the target of one market study. The study will complement the evidence in the annual reports on the implementa-tion of e-communicaimplementa-tion regulaimplementa-tion. The impact of the revised regulatory framework, which considerably strengthens provisions such as number
16 Among other issues that the market study will need to investigate are: the role of hedonic eff ects embedded in the products (i.e. by which consumers get more for the same price)
portability, out-of-court dispute resolution and better consumer informa-tion, and still needs to be implemented, will also be taken into account.
The second choice for a market study is the market for meat. Meat is one of the goods markets with the lowest MPI ranking and scores relatively poorly for consumer trust. It is also a highly regulated frequently purchased product that makes up a considerable share of consumption expenditure.
While other markets ranked poorly, they were not considered for market studies this year for the following reasons. Two studies are already ongoing in the fi eld of investments and the present data validate the decisions to investigate this market.
A market study in the electricity market was launched following the second Scoreboard and the fi rst Scoreboard triggered a study on the market of current accounts which was published in September 2009.
Markets such as “real estate services” or “legal services, accountancy and notary services” seem to make up a low proportion of the household budget and their cross border dimension is limited.
International passenger rail transport has only been liberalised in December 2009 and it may take some time to be achieved. It is vital that passengers are well-informed of their rights. The Commission is therefore pursuing a Passenger Rights Information Campaign. Despite the fact that many passengers identify problems with the operation of rail services, launching a market study in the rail sector would be premature as liberalisation is only in its infancy as far as international transport is concerned and non-existent for domestic transport.
While vehicle repair seems to be a problematic market, the Commission has recently published a comprehensive Impact Assessment on the new competition law framework for motor vehicles, which includes an in-depth analysis of the competitive conditions in this and in the second-hand car market. The Commission has subsequently implemented a new
competi-tion law framework for the motor vehicle sector that came into force in June 2010, which will increase competition in the market for car repair and maintenance services, by improving independent repairers’ access to the technical information needed for repairs and by making it easier for both authorised and independent repairers to use alternative spare parts. As a consequence, the new rules will improve the conditions for consumers on the car repair market substantially. As regards second hand cars, their prices appear to be infl uenced by developments in the new car market which put pressure on the prices of the whole market, for new cars and second hand cars. The Commission will continue to monitor carefully the developments in the markets for car sales and repair as well as repair and maintenance service and both the Commission and national competition authorities will intervene in case of competition shortcomings.
Although “clothing and footwear” is also a market which performs poorly, the “meat” market was selected for the in-depth market study because of its closer link to consumers’ health and wellbeing.
Member States are encouraged to use the national indices in the Score-board to launch initiatives for the consumer markets which are the most problematic at national level.
The data in the Scoreboard will be taken into account by the Commis-sion and Member States in the selection of a topic for the annual “sweep” organised by the network of Consumer Protection Cooperation authori-ties. Member States are also encouraged to use the national data on trust to identify their enforcement priorities.
On the basis of the results of the Scoreboard, the Commission will discuss with the representatives of those markets among the least well performing the possible reasons for these results and whether industry-led actions, such as the development of industry codes of conduct, complaint bodies or alternative dispute resolution mechanisms would be an appropriate response to complement the application of the competition rules or sector-specifi c regulation.
NEXT STEPS FOR THE SCOREBOARD
Although this Scoreboard means a considerable advance on previous editions, further progress is needed to develop and enhance the Score-board, specifi cally along the lines proposed by the European Parliament in its report17
. In particular:
• Complaints. The Commission will work closely with complaint
bodies to ensure that the Recommendation is implemented.
• Market monitoring survey. Due to budgetary constraints it is
not possible for all 50 markets to be surveyed every year. The most problematic markets will be surveyed annually in order to monitor progress. Other markets will be monitored every two years. If addi-tional resources become available, the survey will also be expanded to cover consumer perceptions of the strength of competition and innovation in each market.
• Prices. Eurostat will continue to work closely with national
statis-tical offi ces to develop comparable price data across all consumer markets.
Services EU AT BE BG CY CZ DE DK EE EL ES FI FR HU IE IT LT LU LV MT NL PL PT RO SE SI SK UK
Gas < 20 GJ + tax 21.5 21.4 23.2 11.3 19.8 27.1 26.2 10.9 19.8 29.7 13.9 18.4 19.4 18.2 20.6 20.2 29.7 14.9 21.7 7.8 38.1 21.8 27.7 13.2 Gas 20 – 200 GJ + tax 15.5 17.6 15.6 11.4 13.4 17.2 26.2 10.5 15.9 15.7 13.3 16.6 17.9 11.5 13.3 12.5 20.9 11.8 16.6 7.8 25.8 16.6 13 11.8 Gas > 200 GJ + tax 14.3 15.6 14.4 11.7 13.2 15.5 26.2 10.5 13.1 14 13.2 15.7 18.6 10.5 12.3 12.3 19.7 10.9 14.4 7.6 24.3 16.1 13 10.4 Gas < 20 GJ no tax 17.2 15.7 18.8 9.4 16.6 20.4 12.8 8.8 17 26.3 11.3 16.2 14.3 15.3 18.7 18.4 19.3 12.2 20.7 4.7 24.5 17.4 23.3 12.6 Gas 20 – 200 GJ no tax 12.1 12.8 12.5 9.5 11.3 12.8 12.8 8.5 13.7 13.4 10.9 14.6 11.9 9.7 11.6 11.4 12.6 9.7 15.7 4.7 14.7 13.1 10.9 11.3 Gas > 200 GJ no tax 10.9 11.2 11.5 9.8 11.1 11.3 12.8 8.5 11.3 11.8 10.7 13.8 11.4 8.8 10.3 11.2 11.7 8.9 13.7 4.6 13.5 12.6 11 10 Electricity < 1 MWh + tax 0.24 0.27 0.27 0.08 0.15 0.28 0.36 0.29 0.09 0.11 0.31 0.24 0.16 0.16 0.42 0.29 0.1 0.27 0.11 0.24 0.15 0.33 0.1 0.26 0.28 0.23 0.17 Electricity 1 – 2.5 MWh + tax 0.18 0.21 0.21 0.08 0.14 0.21 0.25 0.29 0.09 0.09 0.18 0.16 0.14 0.16 0.22 0.17 0.1 0.21 0.11 0.18 0.11 0.13 0.18 0.1 0.18 0.16 0.17 0.15 Electricity 2.5 – 5 MWh + tax 0.16 0.19 0.19 0.08 0.16 0.14 0.23 0.26 0.09 0.11 0.16 0.13 0.12 0.15 0.19 0.2 0.09 0.19 0.11 0.16 0.19 0.12 0.16 0.1 0.16 0.14 0.16 0.14 Electricity 5 – 15 MWh + tax 0.16 0.17 0.17 0.08 0.16 0.11 0.21 0.23 0.09 0.13 0.15 0.11 0.11 0.14 0.18 0.26 0.09 0.17 0.11 0.17 0.23 0.11 0.14 0.09 0.14 0.13 0.15 0.13 Electricity > 15 MWh + tax 0.15 0.16 0.15 0.08 0.17 0.1 0.21 0.23 0.08 0.16 0.14 0.1 0.1 0.14 0.15 0.3 0.08 0.14 0.1 0.21 0.19 0.11 0.13 0.09 0.13 0.13 0.13 0.13 Electricity < 1 MWh no tax 0.18 0.19 0.2 0.07 0.13 0.23 0.25 0.14 0.07 0.1 0.26 0.19 0.12 0.13 0.37 0.08 0.24 0.1 0.23 0.25 0.12 0.29 0.08 0.19 0.2 0.2 0.16 Electricity 1 – 2.5 MWh no tax 0.13 0.15 0.16 0.07 0.12 0.17 0.16 0.14 0.07 0.09 0.15 0.13 0.11 0.13 0.2 0.08 0.18 0.1 0.17 0.16 0.1 0.15 0.08 0.12 0.12 0.14 0.15 Electricity 2.5 – 5 MWh no tax 0.12 0.14 0.14 0.07 0.14 0.11 0.14 0.12 0.07 0.1 0.13 0.1 0.09 0.13 0.17 0.08 0.16 0.1 0.15 0.14 0.09 0.13 0.08 0.1 0.11 0.13 0.14 Electricity 5 – 15 MWh no tax 0.11 0.13 0.12 0.07 0.14 0.09 0.13 0.1 0.07 0.12 0.12 0.09 0.08 0.12 0.16 0.07 0.15 0.1 0.16 0.13 0.09 0.12 0.08 0.09 0.1 0.13 0.12 Electricity > 15 MWh no tax 0.11 0.12 0.11 0.07 0.14 0.08 0.12 0.1 0.06 0.14 0.12 0.07 0.08 0.12 0.14 0.07 0.12 0.1 0.2 0.12 0.09 0.11 0.08 0.08 0.1 0.11 0.12 Current acnt. dom. passive 74 100 29 17 7 40 63 38 26 15 105 45 91 28 56 135 11 40 63 53 30 46 26 30 25 44 44 95 Current acnt. dom. average 112 140 58 27 85 95 89 74 51 54 178 104 154 76 82 253 35 57 115 72 46 73 45 83 62 100 74 103 Current acnt. dom. active 159 197 82 43 185 157 115 128 93 112 304 207 232 144 118 402 113 96 192 99 56 114 82 142 128 201 125 111 Internet 0.14 – 0.5 Mb 12.27 36.27 34.43 13.31 12.2 24.23 22.9 12.88 9.58 8.17 20.48 38.08 11.16 15
[image:38.842.194.760.212.544.2]Internet 0.5 – 1 Mb 24.17 10.17 43.18 39.06 29.53 9.52 19.42 54.61 25.01 36.15 16.81 20.08 49.67 3.7 11.3 16.79 14 Internet 1 – 2 Mb 34.9 9.43 38 30.36 34.35 24.93 15.4 16.5 29.01 7.83 39.55 11.58 28.92 8.46 16.35 17.97 6.12 20.86 18.78 14.38 Internet 2 – 4 Mb 29.48 72.56 9.43 67 38.81 22.72 18.59 27.16 35.01 12.45 22 14.19 67.82 11.04 19.95 33.53 11.3 26.99 17 48.25
Table 2: Prices of services