Rochester Institute of Technology
RIT Scholar Works
Theses Thesis/Dissertation Collections
4-23-2009
Benthic macroinvertebrate diversity in a shallow
estuary: controls on nutrient and algal dynamics
Natalie Ann McLenaghanFollow this and additional works at:http://scholarworks.rit.edu/theses
Benthic Macroinvertebrate Diversity in a Shallow Estuary: Controls on Nutrient and Algal Dynamics
by:
Natalie Ann McLenaghan B.A., Colgate University, 2002
Rochester Institute of Technology College of Science: Department of Biology
Program of Environmental Science
A thesis submitted in partial fulfillment of the requirements for the degree
of Master of Science
Approved April 23rd
, 2009 by:
_______________________ Anna Christina Tyler, Ph.D. Chair of Committee
_______________________ Karl F. Korfmacher, Ph.D.
TABLE OF CONTENTS
Acknowledgements………... ii
List of Tables & Figures……….. iv
Abstract………... vii
CHAPTER ONE: Introduction.……….. 1
Availability of Nitrogen Inputs………... 2
Study Site: Impacts of Nutrient Enrichment………... 3
Eutrophication in Shallow Estuaries………... 4
Macroinvertebrates and Benthic Processes……… 6
Biodiversity and Ecosystem Functioning……….. 8
Scope and Objectives of Study………. 10
Figures………….……….. 12
CHAPTER TWO: Distributions of Benthic Macroinvertebrates in West Falmouth Harbor, a Shallow Estuary in Cape Cod, MA: Patterns of Diversity……….……….. 15
Introduction……….. 16
Materials & Methods………... 18
Results...………... 21
Discussion……… 24
Tables & Figures……….. 27
CHAPTER THREE: Benthic Macroinvertebrate Diversity Regulates Nutrient and Algal Dynamics in a Shallow Estuary………. 39
Introduction………... 40
Materials & Methods……… 45
Results………... 56
Discussion………. 65
Conclusions………... 78
Tables & Figures………... 80
CHAPTER FOUR: Conclusions……….….… 109
Literature Cited……… 113
ACKNOWLEDGEMENTS
First and foremost, I would like to offer a heartfelt thanks to my advisor and mentor,
Christy Tyler, for her continued guidance throughout this entire process. Her insight has helped
to shape not only the construction of this manuscript, but my development as a graduate student
and environmental scientist. I am also grateful to Karl Korfmacher and Elizabeth Hane for their
feedback and participation on the committee, and for generally enhancing my experience at RIT.
I also thank John Waud for comments during the early writing stages, David Mathiason for
statistics advice, and the rest of the faculty, staff, and students in the Environmental Science
program that have provided support. This work was partially funded through the National
Science Foundation (NSF), in the form of a grant to Christy Tyler.
The members of the “Biocomplexity” project, in Woods Hole and beyond, contributed
immensely to the completion of my thesis; each deserves many thanks! At Cornell University,
Bob Howarth graciously served as a committee-member-from-afar, Roxanne Marino and
Melanie Hayn imparted expertise and assistance with nutrient analyses, and Ursula Mahl worked
diligently alongside me for endless hours in the field and lab. The University of Virginia folks
assisted with all things macroalgae, and I would like to thank Karen McGlathery for her help
with tissue analyses, and Laura Reynolds and Meredith Ferdie for willingly diving into the
waters of West Falmouth Harbor to retrieve specimens. I thank the scientists and staff at the
Ecosystems Center of the Marine Biological Laboratory, in particular Anne Giblin and Ken
Foreman, for providing logistical support through usage of lab space and equipment. Thank you
to Tom Duncan for invaluable assistance (and patience) at the microscope during the process of
amphipod anatomy. Further, I profess sincere gratitude to the research assistants at the MBL to
whom I am deeply indebted, including Clara Funk, Sam Kelsey, and again, Melanie Hayn.
Christina Maki and Aaron Strong provided moral support and hours of schoolyard fun on the
kickball field.
I was fortunate to be surrounded by a great crew of teammates at RIT, the current and
former members of the Tyler Lab: Chris Scheiner, Charles Yarrington, Megan Kozlowski,
Brittany Bourdon, Jeff Barnette, Katrina Scheiner, and Peggy Walsh. I also thank Andrew
Altieri, a remote and “honorary” teammate, for assistance (and many laughs) in the field. My
pals in Rochester, especially Pierre and Elodie, provided cherished friendship and hugs during
the long, snowy winters. Thank you to my family – Mom, Dad, Eddie, and Erin — for your
long-distance love and support, and collective understanding (or tolerance?) of my enthusiasm for the
creatures of the sea, including the worms and weeds. Last, but certainly not least, I express
LIST OF TABLES AND FIGURES
CHAPTER ONE:
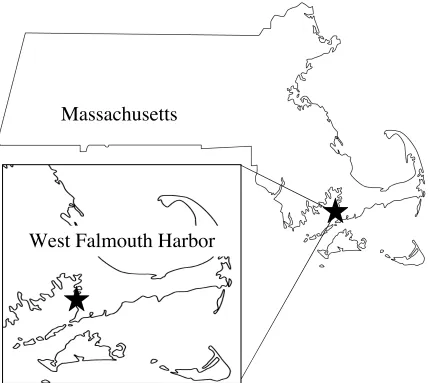
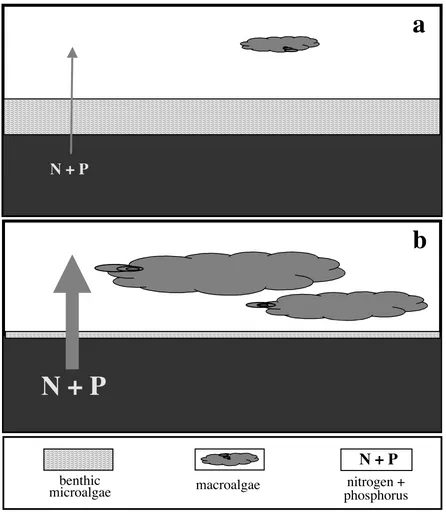
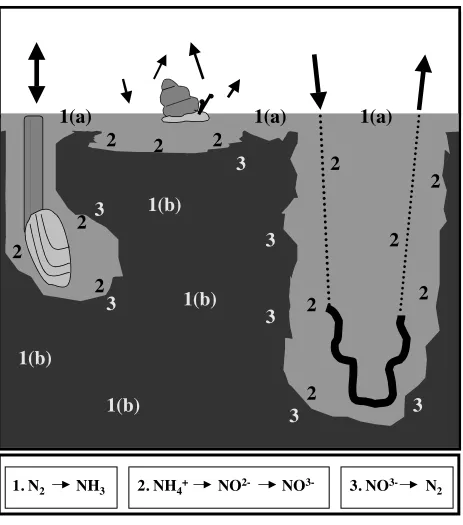
Figure 1.1. Map of study site, illustrating the location of West Falmouth Harbor (41°36’N, 70°38’W) in southwestern Cape Cod, MA……….. 12 Figure 1.2. Schematic diagrams of potential feedbacks existing between nutrient supply and the biomass of benthic microalgae and macroalgae, as determined by invertebrates within model communities………. 13 Figure 1.3. Representation of advective exchange between sediments and the water column, and microbial-mediated transformations of nitrogen compounds………... 14
CHAPTER TWO:
Table 2.1. Distributions, feeding guilds and phylogenetic groupings of macroinvertebrates collected throughout West Falmouth Harbor, MA.………. 27 Table 2.2. Results of 2-way crossed tests for similarity percentages (SIMPER).………... 29 Table 2.3. Abundance, dominance, and diversity indices for invertebrate counts pooled by basin………. 30 Table 2.4. Results of 2-way crossed analysis of similarity (ANOSIM) for macroinvertebrate composition and 2-way ANOVA for abundance values and diversity indices……….. 31 Fig. 2.1. Location of the study site, West Falmouth Harbor, in southwestern Cape Cod, MA… 32 Fig. 2.2. Image of West Falmouth Harbor, MA, with sampling locations labeled in the Inner (Stations 1 – 4) and Outer (Stations 5 – 8) Basins………... 33 Fig. 2.3. Relative distributions of invertebrate taxa among phylogenetic categories, as determined from abundance data……… 34 Fig. 2.4. (a) Hierarchical, agglomerative dendrogram of all samples. (b) Non-metric multi-dimensional scaling (MDS) plot of all samples ………. 35 Fig. 2.5. Non-metric multi-dimensional scaling (MDS) plots, with overlain bubbles illustrating distributions of macroinvertebrate taxa with greatest contributions to within-factor (Basin + Patch) group resemblance in the similarity percentages (SIMPER) routine………... 36 Fig. 2.6. Subset of diversity indices for samples pooled according to basin (Inner Basin; Outer Basin) and patch (vegetated; nonvegetated)……….... 37 Fig. 2.7. Linear regression for species richness of invertebrates and macroalgae collected during June 2007 field surveys of the sampling stations………..……….. 38
CHAPTER THREE:
Table 3.1. Timelines for Experiments I - III……… 80 Table 3.2. Overview of Experiment I - III designs and treatments..……… 81 Table 3.3. Experiment I. Results of 2-way ANOVA for (a) dissolved nutrient fluxes with faunal treatment and light/dark condition as main and interaction factors, and 1-way ANOVA for (b) dissolved oxygen fluxes, including benthic oxygen consumption, net, and gross primary productivity………... 82 Table 3.4. Experiment I. N2 fixation rates determined through acetylene-reduction assays using
Table 3.5. Experiment I. Results of 2-way ANOVA for (a) N2 fixation rates with faunal
treatment and incubation condition (light, dark, dark + molybdate) as main and interaction factors, for both surface and sub-surface sediments. Results of 1-way ANOVA for (b) benthic microalgal biomass………... 84 Table 3.6. Experiment II. Results of 1-way ANOVA for (a) biomass of Gracilaria vermiculophylla at each measurement time-point, and (b) dissolved oxygen (DO) flux rates, including benthic oxygen consumption, net, and gross primary productivity. ……… 85 Table 3.7. Experiment II. Macroalgal tissue nitrogen content and carbon:nitrogen ratios, and organic matter content of surface sediments (0 – 2 cm) as % dry weight……… 86 Table 3.8. Experiment II. Results of 1-way ANOVA for (a) macroalgal tissue nitrogen and carbon:nitrogen ratios, and for (b) organic matter content of surface sediments (0 – 2 cm)…… 87 Table 3.9. Experiment III. Results of 1-way ANOVA for (a) macroalgal biomass (assemblage totals and component species) and Simpson’s Index of Diversity (1-D) at each measurement time-point, and (b) dissolved oxygen flux rates, including benthic oxygen consumption, net, and gross primary productivity……… 88 Table 3.10. Experiment III. Mean values (± SE) upon termination of experiment (Day 33) for (a) total tissue nitrogen of each macroalgal species, and (b) sediment organic matter (OM), expressed as % dry weight within each depth interval and as total g OM per microcosm……... 89 Table 3.11. Experiment III. Results of 1-way ANOVA for (a) macroalgal tissue nitrogen and carbon:nitrogen ratios, and (b) sediment organic matter (OM) as % dry weight within each depth interval and as total g OM per microcosm (0 – 10 cm)……… 90 Table 3.12. Experiment III. Results of paired t-tests for changes in faunal biomass between initial and final conditions……… 91 Table 3.13. Experiments I – III. Results of yielding equations, comparing observed vs. expected values in mixed-faunal treatments……… 92 Fig. 3.1. Experiment I. Daily rates for sediment-water column fluxes (Day 25) of (a) NH4
+
, (b) NO3
-, (c) dissolved inorganic nitrogen (DIN)-, and (d) PO4
3-………... 93 Fig. 3.2. Experiment I. Sediment-water column flux rates (Day 25) during dark and light incubations for (a) NH4
+
, (b) NO3
-, (c) dissolved inorganic nitrogen (DIN) and (d) PO4
3-……... 94 Fig. 3.3. Experiment I. Daily rates for (a) benthic oxygen consumption, (b) net, and (c) gross primary productivity determined from sediment-water column dissolved oxygen fluxes……… …………... 95 Fig. 3.4. Experiment I. Linear regressions for gross primary productivity plotted against magnitude of flux-rate differences between dark and light incubations for NO3
and NH4
+………. 96
Fig. 3.9. Experiment II. Daily rates for (a) benthic oxygen consumption, (b) net, and (c) gross primary productivity determined from sediment-water column dissolved oxygen fluxes……. 101 Fig. 3.10. Experiment II. Linear regressions of gross and net primary productivity plotted against dry biomass of Gracilaria vermiculophylla during dissolved oxygen fluxes on Day 17……... 102 Fig. 3.11. Experiment III. Mean values (± SE) for (a) total macroalgal biomass and (b) macroalgal diversity (Simpson’s Index of Diversity [1-D]) changes over time. Maximum diversity was achieved at the time of macroalgal addition (1-D = 0.667), as initial biomass was purposely equalized among the 3 assemblage species……… 103 Fig. 3.12. Experiment III. Biomass (g wwt) changes over time of macroalgal assemblage species (FCS, Fucus vesiculosus; GRC, Gracilaria vermiculophylla, ULV, Ulva sp.) for (a) CTL, control, (b) I L Y, Ilyanassa obsoleta, (c) A L I, Alitta virens and (d) M I X, mixed-fauna treatments……….. 104 Fig. 3.13. Experiment III. Evidence of grazing by the polychaete Alitta virens upon thalli of
Gracilaria vermiculophylla 7 days following macroalgal additions, Ulva sp. after 14 days, and
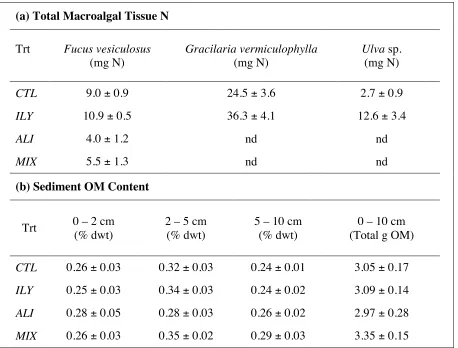
Fucus vesiculosus after 33 days……… 105 Fig. 3.14. Experiment III. Daily rates for (a) benthic oxygen consumption, (b) net, and (c) gross primary productivity determined from sediment-water column dissolved oxygen fluxes…... 106 Fig. 3.15. Experiment III. Linear regressions of gross and net primary productivity plotted against dry biomass of macroalgal assemblages during dissolved oxygen fluxes (Day 14)….. 107 Fig. 3.16. Experiment III. Mean values (+ SE) for (a) % tissue nitrogen content and (b) ratio of carbon:nitrogen for Fucus vesiculosus, Gracilaria vermiculophylla, and Ulva sp. at final sampling………. 108
APPENDIX A:
Table A-1. Macroinvertebrate abundance data from the Inner Basin of West Falmouth Harbor, MA………. 123 Table A-2. Macroinvertebrate abundance data from the Outer Basin of West Falmouth Harbor, MA. ……… 124 Table A-3. Abundance values and diversity indices for all samples………. 126
APPENDIX B:
ABSTRACT
Nutrient loading has produced radical shifts in the structure and function of shallow
estuaries, with substantial impacts upon the community composition of invertebrates and
autotrophs. The progression of eutrophication is regulated by both bottom-up and top-down
factors, which may be mediated by fauna via trophic interactions and nutrient release. We
conducted field surveys of benthic invertebrates in West Falmouth Harbor (WFH), MA, an
estuary subject to localized wastewater enrichment, across a 1 km gradient of suspected
degradation. Dominant taxa included gammarid amphipods and nereidid, orbiniid, and capitellid
polychaetes, with lower diversity and opportunistic species characterizing the inner basin nearest
the sewage plume. Using a series of microcosm experiments with WFH sediments, we
investigated the effects of macroinvertebrate diversity on the biomass and productivity of
macroalgae in monoculture and polyculture, and upon benthic microalgae and nutrient fluxes in
the absence of macroalgae. Microcosms included single- and mixed-species treatments
comprised of common fauna with different functional traits, as related to feeding behaviors,
mobility, and modes of bioturbation. The burrowing, omnivorous polychaete Alitta (formerly
Nereis) virens stimulated benthic microalgal growth, inhibited ammonium fluxes from sediments
to the water column, and decreased macroalgal standing stocks. In polyculture, A. virens
preferentially removed annual, bloom-forming taxa, and reduced the tissue nitrogen content of
the remaining perennial macroalga. Conversely, the surficial, deposit-feeding gastropod
Ilyanassa obsoleta reduced benthic microalgae, enhanced nutrient release, and maintained
macroalgal biomass and productivity. Within mixed-fauna assemblages, A. virens
disproportionately diminished macroalgal biomass. Benthic communities dominated by I.
obsoleta or functionally comparable species could thereby accelerate feedbacks with
eutrophication, through bottom-up supply and indirect promotion of macroalgal blooms. In
CHAPTER ONE:
1.1 Availability of nitrogen inputs
Anthropogenic eutrophication is one of the most ubiquitous drivers of change in our
nation’s estuaries (Bricker et al. 1999), as enhanced primary production and accumulation of
organic matter radically alters trophic structure and benthic metabolic processes (Nixon 1995).
Previous studies have determined that autotrophs are primarily limited by nitrogen (N) in
temperate estuaries, and secondarily or seasonally by phosphorus (P) (Ryther & Dunstan 1971,
Howarth 1988, Vitousek & Howarth 1991). Technological advances in the last century have
radically increased both the production and mobility of reactive N in the environment (Vitousek
et al. 1997, Howarth et al. 2002), largely through industrialized fixation that boosts crop yields
via transformation of inert, gaseous dinitrogen (N2) into inorganic N available for plant uptake,
in addition to sowing of nitrogen-fixing legumes. Furthermore, volatilization of ammonia (NH3)
from farmlands and emission of nitrogen oxides (NOx) from widespread fossil-fuel combustion
and deforestation have also contributed to atmospheric changes and subsequent deposition of
reactive N compounds (Paerl 1997, Carpenter et al. 1998, Whitall et al. 2003). While alterations
of the global N cycle have contributed to the fertilization of an agricultural revolution and fueled
reformation of the transportation sector, the unintended consequences of nutrient exportation
have fundamentally impaired ecosystem functioning and biodiversity in receiving coastal waters
(Vitousek et al. 1997).
Nutrients are transported to estuaries via streams and rivers, surface runoff, groundwater,
fertilizer compounds into groundwater (Valiela et al. 1992, Carpenter et al. 1998, Howarth et al.
2000). A further repercussion of coastal development is a synergistic decrease in N removal
processes, such as assimilation and denitrification (dissimilatory reduction of nitrate [NO3
-] by
bacterial conversion to inert N2 gas), due to destruction of forested riparian zones, wetlands, and
fringing salt marshes (Mitsch & Gosselink 1993). Thus, mounting growth along coastlines
contributes additional inputs associated with anthropogenic activities, compounded with reduced
interception and transformation of new and background inputs due to the concomitant loss of
watershed buffers (Valiela et al. 1992, 1997).
1.2 Study site: impacts of nutrient enrichment
In recent decades, Cape Cod, MA, has experienced a sustained rise in population density
with an associated increase in overall N loads to its estuaries (Valiela & Costa 1988, Valiela et
al. 1992, Bowen & Valiela 2001), with a substantial 35% growth rate of housing units in coastal
Barnstable County between 1980 – 1990 (Valiela et al. 1992). Our study site, West Falmouth
Harbor (WFH; Fig. 1), is located within the sandy glacial deposits of southwestern Cape Cod,
MA (41°36’N, 70°38’W), and is currently subject to increased N loads as a result of wastewater
contamination of the local aquifer. The enriched plume originated within the WFH watershed at
the Falmouth Wastewater Treatment Plant (FWTP), due to inadequate design for effluent
disposal practices (Jordan et al. 1997), and has been migrating into the estuary since 1994
(Kroeger 2003). During the next decade, the plume will continue to migrate into WFH and N
loads are predicted to further increase (K. Foreman, pers. comm.).
Excess nutrients have reportedly contributed to the decline of seagrass beds and overall
Tyler et al. is presently investigating the range and severity of eutrophication effects. Reduction
of allocthonous inputs is a critical aspect of ecosystem management, yet the release of nutrients
already stored within estuarine sediments represents an important, continued supply to primary
producers such as nuisance macroalgae (Sundback et al. 2003, Tyler et al. 2003). Manifestation
of eutrophication symptoms may thus be dictated by internal controls, including nutrient storage
capacity within sediments, benthic regeneration and recycling, and subsequent transfer of energy
throughout trophic webs (Pinckney et al. 2001). A greater understanding is needed with regard to
negative and positive feedback processes in WFH, in order to project the length of the recovery
period and the persistence of enrichment effects following termination of the wastewater plume.
1.3 Eutrophication in shallow estuaries
In shallow estuaries, primary production is typically dominated by perennial seagrasses,
drift or attached macroalgae, benthic microalgae, and epiphytes, as the sediment surface is often
located within the euphotic zone (Sand-Jensen & Borum 1991, Fong et al. 1993, Hauxwell et al.
2001, Havens et al. 2001). Seagrasses are a significant functional component of many estuarine
ecosystems, as meadows provide structural habitat, support extensive trophic webs, host
endangered species, and offer erosion protection (Duarte 1995, 2000). Competition and
ecological interactions among benthic autotrophs can be complex, but as a generalized trend
these rooted macrophytes are shaded and replaced by opportunistic algae as eutrophication
competitive disadvantage (Duarte 1995, Valiela et al. 1997, Havens et al. 2001). It is uncertain
whether phytoplankton or macroalgae will ultimately be favored as the dominant primary
producer under sustained nutrient loads in very shallow, lagoonal estuaries, and further research
is needed to clarify complex, non-linear relationships in such systems (Nixon et al. 2001).
Macroalgal blooms have important implications for the overall functioning of the benthic
environment, as the formation of dense mats can radically alter biogeochemical regimes, oxygen
consumption, and nutrient exchange between sediments and the water column (Valiela et al.
1997, Sundback et al. 2003, Tyler et al. 2003). Such changes can be attributed to accrual of
macroalgal biomass and uptake of nutrients during productive phases of growth, with subsequent
deposition and decomposition of organic matter during bloom collapse, as microbes and other
detritivores increase benthic oxygen demand. Aerobic respiration and reduction-oxidation
(redox) processes can deplete dissolved oxygen concentrations to critical levels (Andersson &
Rydberg 1988, Paerl et al. 1998), and if bottom waters are not re-oxygenated, hypoxia can
impose severe physiological stress, behavioral changes, or even mass mortality of
macroinvertebrates and demersal fishes (Breitburg 1992, Diaz & Rosenberg 1995, Norkko &
Bonsdorff 1996, Gray et al. 2002, Altieri & Witman 2006).
During the transition from normal to eutrophic conditions, drastic shifts may ultimately
occur in the species composition, distribution, and diversity of the benthos (Pearson &
Rosenberg 1978, Lopes et al. 2000, Raffaelli 2000, Cardoso et al. 2004). The depth and severity
of impacts in shallow systems may depend upon the extent of macroalgal coverage and
proliferation, as well as faunal traits such as reproductive strategy, mobility, and tolerance to
physicochemical changes. Typically, as food inputs and ecosystem disturbance increase with
& Rosenberg 1978 and references therein). In addition, fauna may display temporal variability
with regard to responses. For example, some sedentary polychaetes may decline rapidly under
macroalgal mats while errant polychaetes remain stable or exhibit delayed impacts (Norkko &
Bonsdorff 1996, Lopes et al. 2000, Raffaelli 2000). Furthermore, macroalgal morphology and
density may be important in dictating effects on fauna through alteration of feeding behaviors
and larval recruitment (Bolam et al. 2000, Cardoso et al. 2004).
1.4 Macroinvertebrates and benthic processes
As noted, prior research has documented the negative consequences of macroalgal
blooms upon benthic fauna. Before the onset of severe hypoxia, however, the invertebrate
community is able to mediate impacts of early eutrophication through direct consumption of
organic matter, particularly when macroalgal biomass is relatively low (Raffaelli 2000, Hauxwell
et al. 2001). While grazing may buffer the immediate consequences of nutrient loading through
top-down impacts, invertebrates can also stimulate bottom-up controls through release of
nutrients to the water column, as a result of feeding behaviors, waste excretion, or bioturbation
activities that enhance mineralization of organic matter (Andersen & Kristensen 1988, Barbanti
et al. 1992). In turn, nutrient fluxes from underlying sediments can provide an important supply
of N and P to macroalgae (Stimson & Larned 2000, Sundback et al. 2003, Tyler et al. 2003,
Kamer et al. 2004). For instance, Sundback et al. (2003) demonstrated that benthic regeneration
Invertebrate disturbance of the sediment surface can compromise the N-sink potential of
benthic microalgae, as excessive grazing and disturbance may impact growth and productivity
(Connor et al. 1982, Banta et al. 1995, Miller et al. 1996, Sundback & Miles 2002). Removal of
N through coupled nitrification-denitrification (microbial conversion of ammonium [NH4 +
] to
NO3
and subsequently to N2) can be enhanced by microalgal photosynthesis when: (1) benthic
microalgae are not in direct competition with nitrifiers for NH4
+, and (2) photosynthesis does not
produce oxygen concentrations that would inhibit anaerobic processes (Rysgaard et al. 1995, An
& Joye 2001). In addition to facilitating removal of N through denitrification, benthic microalgae
serve as a substantial sink through processes of uptake and assimilation (Rysgaard et al. 1995,
MacIntyre et al. 1996, Sundback & Miles 2002, Tyler et al. 2003). Furthermore, benthic
microalgae exert important controls through the formation of microbial mats that act as a
physical barrier to fluxes from underlying sediments to the water column, thereby promoting
burial of nutrients (Miller et al. 1996, Sundback & Miles 2002). Thus, suspension and
over-consumption of surficial sediments by fauna, with associated destruction of benthic microalgal
communities, may indirectly fuel the proliferation of macroalgal blooms (Sundback & Miles
2002, Sundback et al. 2003).
The direction and magnitude of sediment-water column nutrient fluxes is correlated with
the extent of invertebrate bioturbation and bioirrigation in sediments (e.g., Rhoads 1974,
Henriksen et al. 1983, Aller & Aller 1998). Bioturbation is the mixing of solutes and solids
between the sediment and the water column as a result of faunal movement and activity, and
bioirrigation is the exchange of solutes due to ventilation of biogenic structures (such as tubes or
burrows) by sediment-dwelling invertebrates. Bioirrigation aerates the sediment and promotes
processes that transform N through nitrification and denitrification (Andersen & Kristensen
1988). Close associations exist between aerobic nitrifiers and anaerobic denitrifiers (Jenkins &
Kemp 1984), and bioirrigating fauna can promote mineralization and release of N by enhancing
the coupling between these microbial processes (Henriksen et al. 1983, Andersen & Kristensen
1988, Hansen & Kristensen 1997, Michaud et al. 2006). The activities of particular invertebrates
(Fig. 3), such as burrowing nereidid polychaetes and biodiffusing bivalves (Henriksen et al.
1983, Kristensen & Blackburn 1987, Hansen & Kristensen 1997, Mermillod-Blondin et al. 2004,
Michaud et al. 2006) in addition to grazing snails (Fong et al. 1997), have been shown to control
nutrient transformations and fluxes from the sediments to the water column. Most research to
date has focused upon single species or functional groups with regard to biogeochemical
processes, although recent studies have begun to explore the effects of species interactions within
benthic communities (e.g., Emmerson et al. 2001, Waldbusser et al. 2004, Waldbusser &
Marinelli 2006).
1.5 Biodiversity and ecosystem functioning
Eutrophication has important implications for human societies, as degradation of coastal
habitat and impairment of water bodies involves the following consequences: reduced
recreational opportunities and tourism, toxic and/or harmful algal blooms, collapse of local
fishing economies, and the loss of critical ecosystem functions (Bricker et al. 1999). According
The relationship between biodiversity (i.e., species or functional richness, identity, and
composition) and ecosystem functioning (i.e., productivity, resilience or stability, energy transfer
and nutrient cycling) has undergone considerable study in terrestrial environments in recent years
(e.g., Tilman et al. 1996, Chapin et al. 1997, Symstad et al. 1998, Hooper et al. 2005). Syntheses
of current scientific understanding suggest that the functional traits of organisms are important in
determining ecosystem processes, and that richer pools of species or functional groups may
provide “insurance” against disturbance and stochastic events (Loreau et al. 2001, Hooper et al.
2005). For example, communities comprised of organisms with unique niches may be more
impacted by species loss than a group of organisms with overlapping niches. Thus, the
relationship between biodiversity and functioning in a given ecosystem may depend upon the
degree of redundancy (or in contrast, complementarity) among resident species (Chapin et al.
2000). Furthermore, the form of the relationship may also be dictated by the inclusion or
exclusion of organisms with dominant traits (i.e., the “sampling effect”), such as keystone
species with disproportionate influence upon measured processes. In experimental investigations,
evaluation of performances in monospecific populations vs. diverse communities may reveal
characteristics such as redundancy and dominance, as well as the ecosystem consequences of
species interactions (Raffaelli et al. 2003, Waldbusser et al. 2004).
Early research pertaining to the debate has been generated from experimental
species-removal plots in grasslands, examining richness within one trophic level (primary producers) and
measuring a limited set of processes on a short temporal scale (Tilman et al. 1996, Tilman 1999).
More recently, studies have been initiated in marine ecosystems to address the relationships
between biodiversity and ecosystem functioning (e.g., Raffaelli 2000, Emmerson et al. 2001,
Waldbusser & Marinelli 2006, Bracken et al. 2008, Bruno et al. 2008). Interactions between
species may in turn affect faunal behaviors, sediment functions, and associated biogeochemical
processes, as exhibited between polychaetes and thalassinid shrimp (Waldbusser & Marinelli
2006), for example. Raffaelli (2006) reviewed recent reports and recommended further
experimental examination and development of better models in marine systems, particularly
because errors may arise when extrapolating results across ecosystems when inherent differences
exist between physical, chemical, and biological characteristics (Duarte 2000, Giller et al. 2004).
Considering the overwhelming recent evidence of biodiversity loss in coastal ecosystems, the
call for further research is an increasingly pressing matter (Costanza et al. 2007).
1.6 Scope and objectives of study
The species composition and functional traits of estuarine invertebrates have important
consequences for the transformation of nutrient inputs and processing of organic matter. Our
research addresses the effects of enrichment upon the diversity of benthic macrofauna at our
study site, coupled with examination of the controls exerted by fauna upon the progression of
eutrophication, including the regulation of algal dynamics and nutrient cycling. In Chapter Two,
we sought to answer the following questions through field surveys of WFH:
(1) Which species of benthic macroinvertebrates are present throughout the harbor, and how are they distributed?
(1) How do species with different functional traits, as related to feeding behaviors and bioturbation modes, influence primary production, benthic microalgal biomass, and nutrient fluxes in bare sediments (Experiment I)?
(2) In light of bottom-up factors examined through the first experiment, how does the interaction of faunal-mediated nutrient supply and top-down controls impact the biomass, productivity, and nutrient content of a macroalgal monoculture (Experiment II)?
(3) What types of faunal effects are evident within a diverse macroalgal polyculture (Experiment III)?
(4) When invertebrates are combined within mixed-species assemblages, how do responses differ from those measured in monospecific populations (all experiments)?
In order to resolve these questions, we designed and conducted a series of microcosm
experiments that are discussed in detail within Chapter Three of this manuscript. Chapter Four
offers general conclusions about the research and briefly summarizes the significance of the
Fig. 1.1. Map of the study site, illustrating the location of West Falmouth Harbor (41°36’N, 70°38’W) in southwestern Cape Cod, MA.
Massachusetts
[image:21.612.96.524.89.472.2]Fig. 1.2. Schematic diagrams of potential feedbacks existing between nutrient supply from sediments and the biomass of benthic microalgae and macroalgae: (a) negligible release of nitrogen (N) and phosphorus (P) to the water column, due to uptake and assimilation by benthic microalgae; as a result, macroalgal biomass is suppressed, and (b) substantial release of sediment N and P, resulting from shading and inhibition of benthic microalgae; macroalgal growth is enhanced.
a
N + P
b
N + P
N + P
macroalgae
benthic
[image:22.612.83.529.69.581.2]Fig. 1.3. Representation of advective exchange between sediments and the water column (black
1(a)
1(b)
1(a)
1(a)
1(b)
2
2
2
2
2
2
2
2
2
3
1. N
2NH
32. NH
4+NO
2-NO
3-3. NO
3-N
22
3
3
3
3
3
2
2
1(b)
CHAPTER TWO
Distributions of Benthic Macroinvertebrates in West Falmouth Harbor,
2.1 INTRODUCTION
Distributions of benthic invertebrates are dictated by a complex suite of biotic and abiotic
factors interacting on multiple scales, yet predictable shifts in community structure occur in
response to gradients of environmental disturbance and instability (Pearson & Rosenberg 1978,
and references therein). Because invertebrates are important indicators of aquatic ecosystem
health, field surveys and analyses of composition have broad applications for habitat monitoring
in freshwater (e.g., Novak & Bode 1992, Kerans & Karr 1994) and coastal marine systems (e.g.,
Gray & Pearson 1982, Warwick 1986, Clarke & Warwick 1993, Ranasinghe et al. 1994, Ugland
2008). In estuaries, a common driver of both chronic and acute stress to resident biota is the
acceleration of nutrient loads that fuel the process of eutrophication (Nixon 1995). As a
consequence of persistent algal blooms, excessive accumulation of organic matter, and
associated biogeochemical changes, benthic structure in eutrophic and/or hypoxic systems may
ultimately shift from diverse to depauperate faunal communities during the transition from
normal to polluted conditions (Pearson & Rosenberg 1978, Diaz & Rosenberg 1995, Valiela et
al. 1997, Cardoso et al. 2004).
Generalized patterns reported in the Pearson-Rosenberg (1978) model of succession, a
comprehensive review of benthic response to pollution stress, are summarized below. In
oligotrophic estuaries, low to moderate nutrient enrichment may initially augment species
upon sensitive organisms. As organic inputs intensify, assemblages generally shift from
K-selected equilibrium taxa that tend to be large-bodied and long-lived, to dominance by small,
r-selected opportunists with accelerated rates of maturity, reproduction, and mortality. In
conjunction with reduced species diversity, ecosystem functions are transformed as trophic
structure evolves from selective herbivory to non-selective detritivory. In response to
disturbance, parameters such as invertebrate abundance, evenness, and functional or taxonomic
richness can therefore be utilized as indicators of community stability. In addition, species
identity and compositional patterns can be demonstrative of pollution and succession status,
particularly for certain taxa with established geographical distributions, life history traits, and
level of tolerance to disturbance.
In our study, we analyzed the composition and diversity of benthic macroinvertebrates in
an estuary exhibiting preliminary symptoms of eutrophication due to sewage enrichment. West
Falmouth Harbor (WFH) is a shallow, temperate embayment located in the permeable glacial
deposits of southwestern Cape Cod, MA (Fig. 1; 41°36’N, 70°38’W). Since 1994, WFH has
functioned as the receptacle of a nitrogen (N)-enriched groundwater plume migrating through the
watershed into the estuary, originating from the Falmouth Wastewater Treatment Plant (FWTP)
(Kroeger 2003). As a result of inadequate design, the retention capacity of the forested treatment
site was exceeded after only one year of effluent disposal practices (Jordan et al. 1997), and N
inputs to WFH have doubled compared with background loading values (Howes et al. 2006).
Groundwater is responsible for at least 90% of freshwater inputs to estuaries along Cape Cod
(Valiela et al. 1992), and is the primary transport mechanism of allocthonous N into WFH
(Howes et al. 2006). While protocols for wastewater processing at the FWTP have since been
further increase over the next decade as plume migration continues (K. Foreman, pers. comm.).
Wastewater inputs have reportedly contributed to reductions in WFH habitat quality, and
symptoms range from severe degradation within the inner reaches that border the sub-watershed,
to negligible effects in the well-flushed mouth of the harbor (Howes et al. 2006). Impacts include
the decline of seagrass beds, which provide refuge to fauna, stabilize sediments, and are of
generally significant ecological and commercial value (Costanza et al. 1997).
In our study, we sampled benthic invertebrates across a spatial gradient from the inner to
the outer basin and incorporated substrate with and without seagrass beds, to discern whether
compositional differences exist with regard to habitat type and geographic location in WFH. We
hypothesized that greater faunal diversity would correspond with seagrass coverage and
increased distance from the wastewater point-of-entry. Additional objectives of the study were
to: (1) ascertain the degree of taxonomic similarity across stations throughout the harbor, and (2)
generate a descriptive account of invertebrate distributions during the current period of N
enrichment, for usage in long-term analyses. Our study was performed in affiliation with an
ongoing, comprehensive research program led by Howarth et al. (“Biocomplexity in the
Environment”), investigating the effects of eutrophication in WFH. The current data will be
incorporated into expanded assessments of change and recovery at the site.
interconnected sub-embayments: the outer basin (OB) that exchanges tidal water with Buzzards
Bay through a narrow inlet, the inner basin (IB) that receives direct groundwater inputs from the
sub-watershed, and the south basin that is adjacent to a glacial kettle pond. At locations that
co-occur with multi-annual field monitoring stations in WFH (Fig. 2), benthic invertebrates were
collected along a 1 km spatial gradient in June 2007. The sampling scheme was constructed as a
2-way crossed design, with (1) basin (sub-embayment within harbor) and (2) patch
(presence/absence of seagrass beds) designated as main factors. Stations (stns) were equitably
divided between the IB (stns 1 – 4) and OB (stns 5 – 8), with distance between stns ranging from
50 - 200 m (intra-basin) and 500 – 1000 m (inter-basin). Each stn incorporated vegetated (V) and
nonvegetated (N) patches that were within 10 m proximity, with the exception of V-only at Stn 6
due to extensive seagrass coverage during the field survey. Duplicate sediment cores (1 – 2 m
distance apart) were collected at every stn-patch per each sample, and invertebrate counts were
subsequently pooled.
Samples were obtained by scuba divers, through careful insertion of polycarbonate core
tubes (9.5 cm inner diameter x 30 cm length) to a depth of 20 cm below the sediment-water
interface. Cores were immediately sealed with rubber stoppers and chilled, then transported to
the laboratory for processing. Sediments were sieved (1 mm) and the remaining fractions were
fixed in a solution of buffered formalin (10%) and Rose Bengal (1%) prior to sorting and
preservation in ethanol (70%). Invertebrates were enumerated under a dissection microscope (10
– 70x magnification) with the aid of a mounted, digital camera, and identified to the lowest
possible taxonomic level according to Pettibone (1963), Smith (1964), Gosner (1971), Bousfield
(1973), and Pollock (1998). Specimens categorized as meiofauna (e.g., nematodes, copepods,
In a companion study by McGlathery et al. (pers. comm.) performed 10 days prior to
benthic invertebrate collection, scuba divers collected macroalgae located immediately above V
and N sediments at each of the 8 stns with randomized quadrats (0.25 m2
; n = 3 per each
stn-patch). Samples were sealed in bags, transported to the laboratory in a cooler, and taxa were
identified to the lowest possible level according to Kingsbury (1969) and Humm (1979). In order
to evaluate the relationship between macroalgal and invertebrate diversity in WFH, we used
linear regressions to plot species richness of both phyla.
2.2.2 Data analysis
Univariate diversity indices were computed from non-transformed invertebrate
abundance data with standard routines available in the PRIMER (version 6) software program
(Clarke & Warwick 2001). The following parameters were calculated for each sample: (1) total
number of individuals (n), (2) proportion of sample comprised of taxon with greatest abundance
(rank-1 abundance; R1), (3) total number of species (S), (4) Margalef’s species richness (d), (5)
Pielou’s evenness (J’), and (6) Shannon diversity (H’, log base e). In addition, we also examined
higher-order indices that reflect the degree of evolutionary relatedness between taxa,
incorporating categorization from species through phylum: (7) sum of taxonomic diversity (sΔ+;
Warwick & Clarke 1995), and (8) sum of phylogenetic diversity (sΦ+; Faith 1992). Differences
between main factors (basin; patch) and interactions were tested for all calculated parameters
using non-metric multi-dimensional scaling (MDS). Both methods employed the Bray-Curtis
coefficient for similarity matrices. Based upon the ordination matrix, differences in
compositional structure were examined using 2-way crossed (basin x patch) non-parametric
analysis of similarities (ANOSIM). Taxa responsible for both (1) typifying groups within the
established factors and (2) discriminating between categories within a given factor were
determined by the similarity percentages (SIMPER) routine, using average similarity and
dissimilarity values (respectively).
2.3 RESULTS
2.3.1 Invertebrate distributions
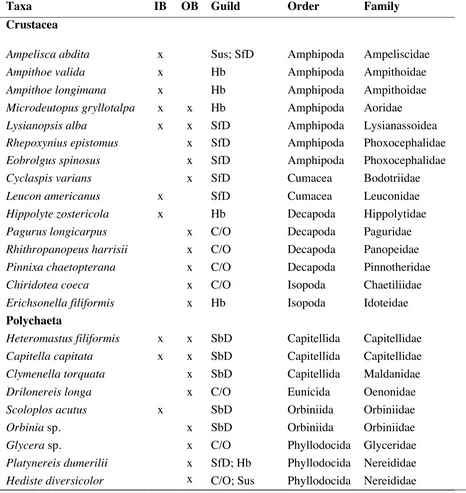
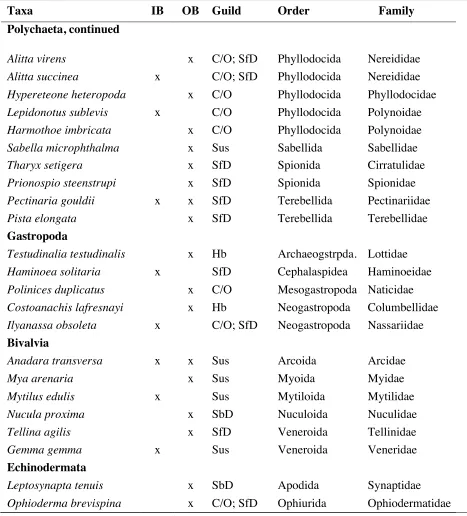
In all, 49 taxa belonging to 4 different phyla and 41 families were identified (Table 1).
The IB included a total of 19 species, including 7 crustaceans, 6 polychaetes, and 6 mollusks.
The OB contained 36 species, nearly twice as many as the IB, with 11 crustaceans, 16
polychaetes, 7 mollusks, and 2 echinoderms. Negligible overlap occurred with regard to species
distributions across geographic locations: only 2 of 16 crustaceans, 3 of 19 polychaetes, 1 of 16
mollusks, and 0 of 2 echinoderms were present in both sub-embayments. Crustaceans dominated
most samples (63 – 84% relative abundance), except in N patches of the OB where polychaetes
had slightly higher abundance than crustaceans (48 vs. 41%, respectively) (Fig. 3). Mollusks
ranged from 4 to 13% relative abundance across all samples, and echinoderms were present only
in V patches of the OB (5% relative abundance).
Differences in trophic structure were observed across the harbor, with a greater
carnivore/omnivore feeding guild were found solely in OB samples. Polychaetes in the OB
demonstrated a diverse set of trophic strategies, including the following guilds:
carnivore/omnivore, sub-surface and surface-deposit feeding, and suspension feeding. While the
most abundant polychaete in V and N patches of the IB (Alitta succinea) is categorized within
both the carnivore/omnivore and surface-deposit feeding guilds, the majority of other species
were sub-surface deposit-feeders. Of the mollusks, the IB hosted carnivorous/omnivorous and
surface-deposit feeding gastropods, and suspension-feeding bivalves. The OB included
carnivorous/omnivorous and herbivorous gastropods, and bivalves with suspension-, surface-,
sub-surface feeding strategies.
2.3.2 Sample resemblance
In general, invertebrate composition was more congruous within basins than between
basins (Table 2; Fig. 4a,b). The hierarchical dendrogram (Fig. 4a) shows that 4 intra-basin pairs
had > 60% similarity: (a) 1V & 2N, (b) 3V & 3N, (c) 4V & 4N, and (d) 7V & 8V. Furthermore,
> 20% similarity was achieved for 5 of 8 IB samples, and 4 of 7 OB samples (Fig. 4a,b).
Exceptions included the following: 2V, which contained only 1 individual in the entire sample;
5V & 5N, which also displayed low abundances and were collected near the high-velocity tidal
channel at the harbor mouth; and 3V & 3N, which were slightly more related to 8N and the OB
cluster, rather than to other IB samples.
28.5%; N: 32.8%), the amphipod Ampelisca abdita (IB: 17.8%; N: 16.7%), the bivalve Gemma
gemma (IB: 15.7%; N: 9.1%), and the gastropod Haminoea solitaria (IB: 7.4%; N: 9.1%).
Furthermore, taxa characterizing the OB were also more representative of V patches: the
amphipod Lysianopsis alba (OB: 37.0%; V: 26.2%), the polychaete Heteromastus filiformis
(OB: 28.9%; V: 21.4%), and the echinoderm Ophioderma brevispina (OB: 7.8%; V: 5.8%). The
amphipod Microdeutopus gryllotalpa had widespread distribution yet variable abundance, and
contributed substantially to average similarity within each patch and basin group (IB: 22.1%;
OB: 19.8%; V: 21.9%; N: 19.1%). Average dissimilarity between groups within the given factors
was 94.6% for basin and 78.8% for patch. The following taxa had the highest contributions to
differentiation among factors (B = basin, P = patch): M. gryllotalpa (B: 20.2%; P: 24.4%), A.
abdita (B: 17.7%; P: 18.9%), L. alba (B: 15.5; P: 11.9%), H. filiformis (B: 7.9%; P: 5.9%), A.
succinea (B: 4.2%; P: 2.5%), and the polychaete Capitella capitata (B: 3.8%; P: 4.7%).
2.3.3 Diversity patterns
Diversity indices for invertebrate counts pooled by basin, which captures the entire set of
collected species, were higher in the OB, while measures of abundance and dominance were
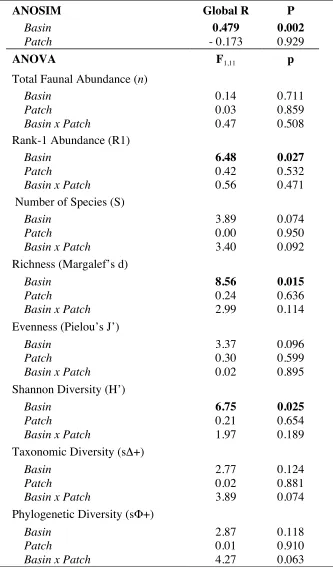
greater in the IB (Table 3; Fig. 6). For non-pooled samples, results of 2-way ANOVA (Table 4)
showed significant differences between basins for 3 of 8 indices: R1, d, and H’ (all p < 0.05). No
main or interaction effects of patch were observed for any test (p > 0.05). With regard to
differences in invertebrate compositional structure, the 2-way crossed ANOSIM test (Table 4)
revealed a significant effect of basin (p = 0.002) but no effect of patch (p > 0.90). There was a
moderate degree of correlation between species richness of macroalgae and invertebrates at the
2.4 DISCUSSION
The field surveys illustrated clear differences in invertebrate composition between WFH
sub-embayments, with regard to taxa identity and distributions, feeding guilds, and
measurements of diversity. Although certain species were characteristic of either V or N patches,
distinctions between habitat types were surprisingly less explicit as measured through the given
statistical frameworks. In order to fully assess the role of eutrophication effects in structuring
invertebrate distributions across the harbor, the current data will ultimately be examined in
conjunction with surveys incorporating temporal variability. Within a multi-annual and
mixed-seasonal context, analyses of composition over time may provide insight into the extent of
wastewater-related disturbance, impacts, and recovery.
While organic enrichment is important in determining species composition and
abundances (Pearson & Rosenberg 1978) and is a purported driver of change in WFH, it is likely
that distributions are influenced by a combination of top-down and bottom-up controls. In
addition to nutrient loads, other abiotic factors that play a role in structuring communities include
hydrodynamics, sediment granulometry, inorganic pollutants, dissolved oxygen, salinity, and
temperature (e.g., Burbanck et al. 1956, Rhoads & Young 1970, Gray et al. 1988, Sarda et al.
1995, Bonsdorff et al. 2003, Kennish et al. 2004). Furthermore, inter- and intra-specific
Many of the species in the WFH field survey have been identified in samples along
coastal Cape Cod for decades, in systems such as Rand’s Harbor (Burbanck et al. 1956),
Barnstable Harbor (Mills 1967), Wild Harbor (Grassle & Grassle 1974), the Great Sippewisset
salt marsh (Sarda et al. 1995), and Waquoit Bay (Hauxwell et al. 1998). Reported taxa include
the polychaetes Capitella capitata, Heteromastus filiformis, and Alitta succinea, the amphipods
Ampelisca abdita and Microdeutopus gryllotalpa, and the small bivalve Gemma gemma. Each of
the listed polychaetes is an opportunistic species tolerant of organic enrichment and low-oxygen
conditions, and high densities of C. capitata are a global-scale indicator of polluted conditions
(Pearson & Rosenberg 1978 and references therein). A. abdita and G. gemma are also
opportunists that colonize disturbed sediments, as each display reproductive strategies that foster
high densitities and patchy distributions (Nichols 1985) – such abundance trends were also
observed within the IB of WFH.
Furthermore, direct feedbacks between invertebrates present in the harbor may be
important in either facilitating or hindering recruitment of other species. Ampelisca abdita is an
engineer species that strongly modifies the substratum, through construction of dense tube
formations that trap fine particles and stabilize sediments (Mills 1967). Aggregations of this
tubiculous amphipod have potential consequences upon the distribution of other species, in both
negative (e.g., the gastropod Ilyanassa obsoleta, Mills 1967) and positive directions (e.g., small,
surface-feeding polychaetes and G. gemma, Mills 1967; the bivalve Mercenaria mercenaria,
MacKenzie et al. 2006). Mobility and differentials between faunal body sizes may also be
important regulators, as the (relatively) large mudsnail I. obsoleta can exclude the small
amphipod Microdeutopus gryllotalpa through disturbance and subsequent evacuation of its tubes
bioturbation groups can occur when water-column turbidity and concentrations of suspended
food particles are altered, or biogenic structures impede the burrowing or movement of other
species (Rhoads & Young 1970, Posey 1987).
Species composition and diversity can have important functional consequences, as shifts
in trophic structure, abundance, depth distributions, and other traits have implications for benthic
processes. Effects may depend on the severity of biodiversity loss and degree of functional
redundancy among organisms in benthic communities (Duffy et al. 2001, Mistri et al. 2001,
Raffaelli 2006), which are topics to be explored during future research within WFH. There is
currently an urgent need to understand biodiversity changes on multiple trophic levels, in the
context of feedbacks with stressors such as eutrophication and invasive species (Raffaelli 2006).
We did not examine concurrent environmental variables (aside from the given macroalgal data)
in the present study, and thus cannot ascribe driving forces behind the distributions and spatial
variation within WFH. It was not our intent to provide direct causative evidence or establish
correlative factors, but rather to establish a foundation for which to compare multi-year surveys,
and to develop and promote expanded research at the study site. Planned investigations may
incorporate sediment characteristics such as benthic chlorophyll, organic matter content,
porewater solute concentrations, and rates of nutrient and oxygen exchange at the
sediment-water interface. Further projects will test the question: what factors are driving spatial
Table 2.1. Distributions, feeding guilds and phylogenetic groupings of macroinvertebrates collected throughout West Falmouth Harbor, MA. Guilds are labeled according to Mills (1967), Fauchald & Jumars (1979), and Ranasinghe et al. (1994). Codes: IB = Inner Basin; OB = Outer Basin; C/O = Carnivore/Omnivore; Hb = Herbivore; SbD = Sub-surface Deposit Feeder; SfD = Surface-Deposit Feeder; Sus = Suspension Feeder.
Taxa IB OB Guild Order Family
Crustacea
Ampelisca abdita x Sus; SfD Amphipoda Ampeliscidae
Ampithoe valida x Hb Amphipoda Ampithoidae
Ampithoe longimana x Hb Amphipoda Ampithoidae
Microdeutopus gryllotalpa x x Hb Amphipoda Aoridae
Lysianopsis alba x x SfD Amphipoda Lysianassoidea
Rhepoxynius epistomus x SfD Amphipoda Phoxocephalidae
Eobrolgus spinosus x SfD Amphipoda Phoxocephalidae
Cyclaspis varians x SfD Cumacea Bodotriidae
Leucon americanus x SfD Cumacea Leuconidae
Hippolyte zostericola x Hb Decapoda Hippolytidae
Pagurus longicarpus x C/O Decapoda Paguridae
Rhithropanopeus harrisii x C/O Decapoda Panopeidae
Pinnixa chaetopterana x C/O Decapoda Pinnotheridae
Chiridotea coeca x C/O Isopoda Chaetiliidae
Erichsonella filiformis x Hb Isopoda Idoteidae
Polychaeta
Heteromastus filiformis x x SbD Capitellida Capitellidae
Capitella capitata x x SbD Capitellida Capitellidae
Clymenella torquata x SbD Capitellida Maldanidae
Drilonereis longa x C/O Eunicida Oenonidae
Scoloplosacutus x SbD Orbiniida Orbiniidae
Orbinia sp. x SbD Orbiniida Orbiniidae
Glycera sp. x C/O Phyllodocida Glyceridae
Platynereis dumerilii x SfD; Hb Phyllodocida Nereididae
[image:36.612.78.544.160.653.2]Table 2.1. Continued.
Taxa IB OB Guild Order Family
Polychaeta, continued
Alitta virens x C/O; SfD Phyllodocida Nereididae
Alitta succinea x C/O; SfD Phyllodocida Nereididae
Hypereteone heteropoda x C/O Phyllodocida Phyllodocidae
Lepidonotussublevis x C/O Phyllodocida Polynoidae
Harmothoe imbricata x C/O Phyllodocida Polynoidae
Sabella microphthalma x Sus Sabellida Sabellidae
Tharyx setigera x SfD Spionida Cirratulidae
Prionospio steenstrupi x SfD Spionida Spionidae
Pectinaria gouldii x x SfD Terebellida Pectinariidae
Pista elongata x SfD Terebellida Terebellidae
Gastropoda
Testudinalia testudinalis x Hb Archaeogstrpda. Lottidae
Haminoea solitaria x SfD Cephalaspidea Haminoeidae
Polinices duplicatus x C/O Mesogastropoda Naticidae
Costoanachis lafresnayi x Hb Neogastropoda Columbellidae
Ilyanassa obsoleta x C/O; SfD Neogastropoda Nassariidae Bivalvia
Anadara transversa x x Sus Arcoida Arcidae
Mya arenaria x Sus Myoida Myidae
Mytilus edulis x Sus Mytiloida Mytilidae
Nucula proxima x SbD Nuculoida Nuculidae
Tellina agilis x SfD Veneroida Tellinidae
Gemma gemma x Sus Veneroida Veneridae
Echinodermata
Leptosynapta tenuis x SbD Apodida Synaptidae
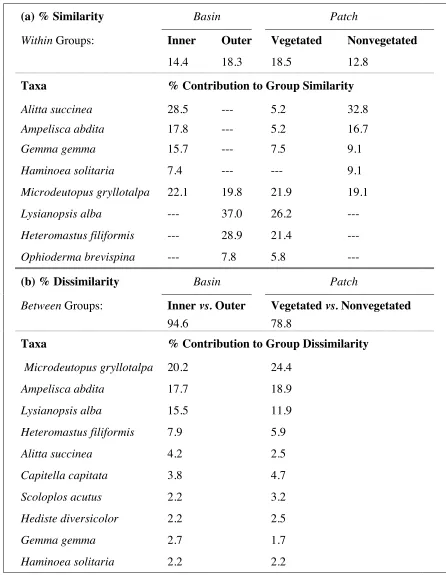
Table 2.2. Results of 2-way crossed tests for similarity percentages (SIMPER). Percentage similarity is presented (a) within groups for Basin and Patch category, along with taxa contributing > 5% similarity to one or more groups. Percentage dissimilarity is shown (b) between groups, along with taxa contributing > 2% dissimilarity within one or both factors.
(a) % Similarity Basin Patch
Within Groups: Inner Outer Vegetated Nonvegetated
14.4 18.3 18.5 12.8
Taxa % Contribution to Group Similarity
Alitta succinea 28.5 --- 5.2 32.8
Ampelisca abdita 17.8 --- 5.2 16.7
Gemma gemma 15.7 --- 7.5 9.1
Haminoea solitaria 7.4 --- --- 9.1
Microdeutopus gryllotalpa 22.1 19.8 21.9 19.1
Lysianopsis alba --- 37.0 26.2
---Heteromastus filiformis --- 28.9 21.4
---Ophioderma brevispina --- 7.8 5.8
---(b) % Dissimilarity Basin Patch
Between Groups: Inner vs. Outer Vegetated vs. Nonvegetated
94.6 78.8
Taxa % Contribution to Group Dissimilarity
Microdeutopus gryllotalpa 20.2 24.4
Ampelisca abdita 17.7 18.9
Lysianopsis alba 15.5 11.9
Heteromastus filiformis 7.9 5.9
Alitta succinea 4.2 2.5
Capitella capitata 3.8 4.7
Scoloplos acutus 2.2 3.2
Hediste diversicolor 2.2 2.5
Gemma gemma 2.7 1.7
[image:38.612.81.527.138.713.2]Table 2.3. Abundance, dominance, and diversity indices for invertebrate counts pooled by basin. Codes: n = total number of individuals; R1 = rank-1 abundance; S = total number of species; d = Margalef’s species richness; J’ = Pielou’s evenness; H’ = Shannon diversity; sΔ+ = sum of taxonomic diversity; sΦ+ = sum of phylogenetic diversity.
Basin n R1 S d J’ H’ sΔ+ sΦ+
Inner 304 0.38 19 3.15 0.57 1.67 1698 1233
Table 2.4. Results of 2-way crossed analysis of similarity (ANOSIM) for macroinvertebrate composition and 2-way analysis of variance (ANOVA) for abundance values and diversity indices. Main factors are Basin (Inner/Outer) and Patch (Vegetated/Nonvegetated), with interactions included under ANOVA. Significant results in bold (p < 0.05).
ANOSIM Global R P
Basin 0.479 0.002
Patch - 0.173 0.929
ANOVA F1,11 p
Total Faunal Abundance (n)
Basin 0.14 0.711
Patch 0.03 0.859
Basin x Patch 0.47 0.508 Rank-1 Abundance (R1)
Basin 6.48 0.027
Patch 0.42 0.532
Basin x Patch 0.56 0.471 Number of Species (S)
Basin 3.89 0.074
Patch 0.00 0.950
Basin x Patch 3.40 0.092 Richness (Margalef’s d)
Basin 8.56 0.015
Patch 0.24 0.636
Basin x Patch 2.99 0.114 Evenness (Pielou’s J’)
Basin 3.37 0.096
Patch 0.30 0.599
Basin x Patch 0.02 0.895 Shannon Diversity (H’)
Basin 6.75 0.025
Patch 0.21 0.654
Basin x Patch 1.97 0.189 Taxonomic Diversity (sΔ+)
Basin 2.77 0.124
Patch 0.02 0.881
Basin x Patch 3.89 0.074 Phylogenetic Diversity (sΦ+)
Basin 2.87 0.118
Patch 0.01 0.910
[image:40.612.143.476.144.712.2]Fig. 2.1. Location of the study site, West Falmouth Harbor, in southwestern Cape Cod, MA (41°36’N, 70°38’W).
Massachusetts
Fig. 2.3. Relative distributions of invertebrate taxa among phylogenetic categories, as determined from abundance data. Factors were classified according to Basin (Inner/Outer) and
Patch (Vegetated/Nonvegetated, as defined as presence/absence of seagrass).
Outer: Nonvegetated
Outer: Vegetated
Inner: Nonvegetated
Inner: Vegetated
Inner: Vegetated
Fig. 2.4. (a) Hierarchical, agglomerative dendrogram of all samples. Clustered groups below the dashed horizontal line denote > 20% similarity. (b) Non-metric multi-dimensional scaling (MDS) plot of all samples. Greater proximity reflects higher relative similarity of macroinvertebrate composition. Samples surrounded by contour bubbles attained >20% Bray-Curtis similarity. Two-dimensional stress = 0.06. Codes: numbers (1 – 8) denote station, and paired letters (V = vegetated; N = nonvegetated) indicate presence/absence of seagrass patch. Stations 1 – 4 are located in the Inner Basin, and Stations 5 – 8 are in the Outer Basin.
(a)
[image:44.612.97.510.92.588.2]Lysianopsis alba
Microdeutopus gryllotalpa
Ophioderma brevispina
Heteromastus filiformis
Gemma gemma
Haminoea solitaria
Ampelisca abdita
Fig. 2.6. Subset of diversity indices for samples pooled according to basin (IB = Inner Basin; OB = Outer Basin) and patch (V = vegetated; N = nonvegetated). Index codes: S = total number of species; d = Margalef’s species richness; J’ = Pielou’s evenness; H’ = Shannon diversity.
S
0 2 4 6 8 10 12
d
0.0 0.5 1.0 1.5 2.0 2.5 3.0
IB
OB
V
N
J'
0.0 0.2 0.4 0.6 0.8 1.0
H'
0.0 0.5 1.0 1.5 2.0
Fig. 2.7. Linear regression for species richness of invertebrates and macroalgae collected during June 2007 field surveys of the sampling stations. Macroalgal data were obtained from McGlathery et al. (pers. comm.).
r
2= 0.366
p = 0.017
0
2
4
6
8
10
12
0
2
4
6
8
10
# macroalgal species
CHAPTER THREE:
Benthic Macroinvertebrate Diversity Regulates
3.1 INTRODUCTION
Primary production in shallow estuaries is often dominated by benthic autotrophs,
including seagrasses, macroalgae, and benthic microalgae (Sand-Jensen & Borum 1991, Duarte
1995). Patterns of abundance and distribution among and within these phytobenthic groups are
regulated through a complex suite of biotic and abiotic factors, including resource availability
and consumer pressure (Valiela et al. 1997, Hauxwell et al. 1998, Worm et al. 2000, Havens et
al. 2001, Nelson et al. 2008). Bottom-up controls on primary production may be modified by
benthic invertebrates through (1) direct excretion of nutrients, (2) promotion or inhibition of
sediment nutrient fluxes, and (3) feedbacks with microbial and benthic microalgal communities
(e.g., Henriksen et al. 1983, Andersen & Kristensen 1988, Fong et al. 1997, Hansen &
Kristensen 1997, Aller & Aller 1998, Karlson et al. 2005). Furthermore, benthic fauna can exert
direct top-down controls through grazing upon macroalgae (Lubchenco 1978, Hauxwell et al.
1998, Worm et al. 2000) and benthic microalgae (Pace et al. 1979, Connor et al. 1982).
In general, growth of estuarine producers in temperate regions is primarily limited by
nitrogen (N) and secondarily by phosphorus (P) (Ryther & Dunstan 1971, Howarth 1988,
Vitousek & Howarth 1991). Enhanced nutrient supply and associated increases in water-column
turbidity can alter the abundance and composition of autotroph communities (Lavery et al. 1991,
Sand-Jensen & Borum 1991, Valiela et al. 1992, McGlathery 2001), and may ultimately shift
1995, Howarth et al. 2002). Coupled with compounding stressors such as biodiversity loss,
climate change, and invasive species (Lotze et al. 2006), there is increased urgency to understand
internal feedback mechanisms in estuaries that may act to either promote or buffer the effects of
nutrient enrichment.
In shallow lagoons with euphotic benthos, an increasingly prevalent symptom of
eutrophication is the emergence of ephemeral macroalgal mats that dramatically modify
ecosystem structure and functioning (Sfriso et al. 1992, Valiela et al. 1992, 1997). Empirical
evidence and direct linkages between nutrient enrichment, intensification of seaweed growth,
and rapid decline of seagrasses have been widely reported (Duarte 1995, Hauxwell et al. 2001,
McGlathery 2001, Burkholder et al. 2007, McGlathery et al. 2007), with consequential impacts
on structural dynamics and ecosystem functions. The seaweeds that replace rooted macrophytes
and perennial macroalgae are typically opportunistic and/or invasive species, including the
genera Ulva, Cladophora, Codium, and Gracilaria. These green and red taxa have been
documented in mono- or multi-specific blooms along the shores of multiple continents (e.g.,
Sfriso et al. 1992, Valiela et al. 1992, 1997, Hauxwell et al. 2001, Eyre & Ferguson 2002,
Cardoso et al. 2004, Neill et al. 2006, Thomsen et al. 2006).
Through rapid growth and formation of mats above the sediment surface, macroalgae can
create conditions of instability due to (1) mass mortality of benthic invertebrates (Norkko &
Bonsdorff 1996), (2) substantial fluctuations in dissolved oxygen concentrations (Hubas &
Davoult 2006), (3) uptake, remineralization, and leakage of N compounds during growth and
senescence (McGlathery et al. 1997, Tyler et al. 2001), and (4) massive fluxes of nutrients and
toxic metabolites from the sediment after the macroalgal blanket is lifted (Krause-Jensen et al.
die-off events may in turn stimulate productivity of phytoplankton (Krause-Jensen et al. 1996, Cerco
& Seitzinger 1997, Valiela et al. 1997, McGlathery et al. 2001). A review by McGlathery et al.
(2007) illustrates that positive feedbacks are created with blooms and crashes of ephemeral
macroalgal populations in shallow bays, as nutrient removal processes tend to decrease and
supply rates are further enhanced through remineralization of organic matter.
In soft-bottom estuaries, regeneration of sediment-derived nutrients is an important factor
mediating the extent and timing of macroalgal growth (Krause-Jensen et al. 1996, McGlathery et
al. 1997, Stimson & Larned 2000, Tyler et al. 2001, 2003, Sundback et al. 2003, Kamer et al.
2004, Engelsen et al. 2008). On the Swedish coast, Sunback et al. (2003) demonstrated that
sediment fluxes could fulfill up to 100% of N and 70% of P macroalgal demand during the
spring when blooms initiate. At the end of the growing season, Engelsen et al. (2008) illustrated
that heterotrophic sediments could supply 20% and 70% of N and P requirements, respectively,
for green macroalgal mats. The development of benthic microalgal communities at the
sediment-water interface can intercept N and P fluxes, and in