-Int. J. Electrochem. Sci., 13 (2018) 5243 – 5252, doi: 10.20964/2018.06.07
International Journal of
ELECTROCHEMICAL
SCIENCE
www.electrochemsci.org
Synthesis and Performance of Nb
5+-Doped LiFePO
4/C as
Cathode Material in Lithium-Ion Battery
Aili Zhang, Axiang Li, Jili Xia, Zhongcai Shao*
School of Environment and Chemical Engineering, Shenyang Ligong University *
E-mail: [email protected]
Received: 5 December 2017 / Accepted: 27 January 2018 / Published: 10 May 2018
Nb5+-doped LiFePO4/C was synthesized as the cathode material by carbon-thermal reduction method in lithium-ion battery. The XRD, SEM, charge and discharge cycles and cycling performance tests were used to study the crystal structure, surface morphology and electrochemical properties of LiFe 1-xNbxPO4/C. The effects of different synthesis conditions on LiFe1-xNbxPO4/C cathode materials were discussed systematically. Finally, the optimal raw materials and process parameters were determined to synthesize LiFe1-xNbxPO4/C cathode material with better performance. The electrochemical properties results showed that LiFe1-xNbxPO4/C (x=0.02) had good electrochemical capacity at 0.1C rate, which also had the highest charge-discharge capacity, good high-rate performance and small attenuation. And the discharge specific capacity reached 146.881 mAh·g-1 at 0.1C rate, which was increased by 11.18% than 132.108 mAh·g-1 of the initial discharge specific capacity without doping Nb5+. After 20 cycles, the charge-discharge specific capacity was almost unchanged and charge and discharge at different rates also showed good stability.
Keywords: LiFePO4; Cathode material; Lithium-ion Battery; Doping; Performance
1. INTRODUCTION
restrict wide use of LiFePO4 material. At present, the methods for modifying LiFePO4 materials mainly include coating conductive materials such as carbon and metal oxides on the surface of LiFePO4 particles, doping metal ions into LiFePO4 crystals, and refining LiFePO4 particle size [10-11]. Ion doping is an important means to improve performance of cathode material of Li-ion battery. LiFePO4 is a semiconductor with a forbidden band width of about 0.3eV. Udoped LiFePO4 is an n-type semiconductor with an activation energy close to 500eV. While doped LiFePO4 is a p-n-type semiconductor, of which activation energy reduces to 60~80eV. Reduction of activation energy is good for the electronic transition, which can enhance the electronic conductivity of the material [12]. The conductivity of the doped material can be increased by 8 orders of magnitude. By doping, the lattice of the LiFePO4 material can form many holes and change the Fermi level of the material to improve the conductivity of the material [13-14].
The main research was modification of LiFePO4/C cathode material by doping Nb5+ in this paper. Through a series of performance tests, the test results were analyzed to study the impact of doping Nb5+ on the physical and electrochemical properties of the composite material to determine the optimal doping amount of Nb5+.
2. EXPERIMENT
LiFe1-xNbxPO4/C with doping Nb5+ was synthesized by carbon-thermal reduction method. The experiment used LiOH·H2O as the lithium source, Fe2O3 as the iron source, NH4H2PO4 as the phosphorus source, tartaric acid (C4H6O6) as the carbon source and Nb2O5 as Nb source. According to the elemental molar ratio of Li: Fe: Nb: P= 1.05: (1-x): x:1(x=0.01, 0.02, 0.03) to weigh the drugs and place them in an agate mortar for grinding. Then grind them thoroughly into the beaker and add ethanol to stir. The sample was placed in a bench-top oven at 85°C after 1h. The dried sample was well ground into in a crucible. Finally, it was placed in a vacuum tube-type high-temperature sintering furnace and calcined at 350°C for 4h in a nitrogen atmosphere and then heated at 750°C (700°C, 800°C, 850°C) for 6h (5h, 7h, 8h) to prepare Nb5+-doped LiFe1-xNbxPO4/C. The target samples LiFe0.98Nb0.02PO4/C, LiFe0.96Nb0.04PO4/C and LiFe0.94Nb0.06PO4/C can be prepared separately.
Phase analysis of LiFe1-xNbxPO4/C powder was carried out by using X-ray diffractometer (D/Max-2200, Rigaku, Japan), in which Cu Kα target was used. The surface morphology of LiFe 1-xNbxPO4/C powder was analyzed and characterized by S-4800 field emission scanning electron microscope (Japan Electronics Co. Ltd.). The new Veyron current charge and discharge meter test system (Liaoning Instrument Research Institute, China) was used to charge and discharge test at room temperature, using the voltage range of 2.5~4.2 V and charge-discharge rate of 0.1C. Using CHI660E electrochemical workstation (Shanghai Chenhua Instrument Co. Ltd.) to test the cycle performance of the material. Scanning rate was 0.1 mV/s and scanning voltage range was 2.0~4.2 V. Shanghai Chenhua CHI660E was used to test AC impedance of electrode materials. The test was conducted under an open circuit voltage. The scanning range was 100kHz~10mHz and the test amplitude was 5 mV.
3. RESULTS AND DISCUSSION
[image:3.596.207.386.570.710.2]3.1. Crystal Structure of LiFe1-XNbxPO4/C Composites
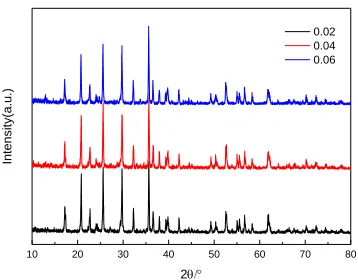
Figure 1 shows the XRD patterns of LiFe1-xNbxPO4/C cathode material prepared with different doping amount of Nb5+. It can be seen that the XRD patterns of the three samples were similar, which has strong diffraction peaks. The three samples are consistent with the standard LiFePO4 spectra, indicating that they all have olivine structure. The Diffraction peaks can be indexed by an orthorhombic Pnma structure (JCPDS 83-2092), which are similar to the previous reports [15,16,19]. The addition of Nb5+ does not 2change the crystal structure of LiFePO4/C but makes it good crystallinity. Compared with LiFePO4/C cathode material without doping Nb5+, the crystallinity is higher and the diffraction peak intensity is bigger and sharper. However, when the doping amount was too high, perhaps the structure of the synthetic LiFe1-xNbxPO4/C would be different, and exhibited some unpleasant results. A comprehensive comparison of the diffraction peaks of the three samples shows that the crystal properties of the samples were best when the doping amount of Nb5+ is 0.02.
10 20 30 40 50 60 70 80
Int
en
sity(a
.u.
)
2
0.02 0.04 0.06
3.2. The Surface Morphology of LiFe1-XNbxPO4/C Composites
Figure 2, SEM images of LiFe1-xNbxPO4/C with different Nb5+ doping amount. A1, A2, A3 represent Nb5+ doping amount of 0.01, 0.02 and 0.03, respectively. As can be seen from the figure, the sample after doping Nb5+, the particle size is significantly refined. It seems that the addition of Nb5+ plays an important role in inhibiting particle growth. Among them, when the doping amount is 0.02, the particle size is small and dispersed uniformly. And the specific surface area of the material is large, which can effectively improve the diffusion path of Li+. When the doping amount is 0.01, difference of the particle size is very large and uneven. When the doping amount is 0.03, the particle size is not uniform and agglomeration phenomenon is very severe. Particle refinement is good for increasing Li+ diffusion rate to improve the electrochemical properties of the material. It is also beneficial for electrolyte to contact the cathode material, which can enhance the electrochemical performance of the samples. LiFe1-xNbxPO4/C with 0.02 Nb5+ doping exhibited better electrochemical performance.
Figure 2. SEM of LiFe1-XNbxPO4/C (x=0.01, 0.02, 0.03) with different Nb5+ doping amount
3.3. The Charge and Discharge Properties of LiFe1-XNbxPO4/C Composites
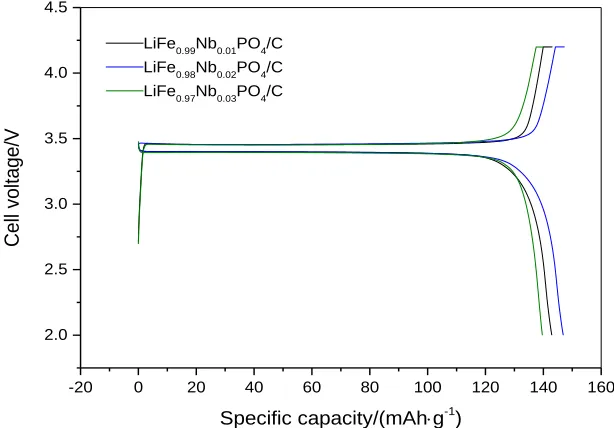
Figure 3 shows the first charge and discharge curves of LiFe1-xNbxPO4/C (x=0.01, 0.02, 0.03) samples at different magnifications.
The specific discharge capacity of LiFePO4/C of un-doped Nb5+ is 136.385 mAh·g-1, and the initial charge-discharge capacity of the sample is increased compared with the Nb5+-doped material. The first discharge capacities of LiFe1-xNbxPO4/C (x=0.01, 0.02, 0.03) are 146.881 mAh·g-1, 142.925 mAh·g-1 and 139.656 mAh·g-1, respectively.
-20 0 20 40 60 80 100 120 140 160
2.0 2.5 3.0 3.5 4.0 4.5
Cell volta
ge
/V
Specific capacity/(mAhg-1)
LiFe0.99Nb0.01PO4/C
LiFe0.98Nb0.02PO4/C
LiFe0.97Nb0.03PO4/C
Figure 3. Initial charge-discharge curve of LiFe1-xNbxPO4/C (x=0.01, 0.02, 0.03) at different magnifications
[image:5.596.135.442.164.378.2]
3.4. Cycle Performance and Rate Performance of LiFe1-XNbxPO4/C Composites
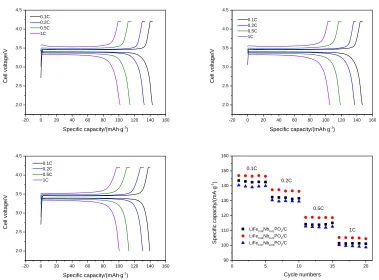
Figure 4 shows the cycle performance and first charge-discharge curve of LiFe1-xNbxPO4/C (x=0.01, 0.02, 0.03) at different magnifications.
-20 0 20 40 60 80 100 120 140 160
2.0 2.5 3.0 3.5 4.0 4.5 Cell volta ge /V
Specific capacity/(mAhg-1 ) 0.1C
0.2C 0.5C 1C
-20 0 20 40 60 80 100 120 140 160
2.0 2.5 3.0 3.5 4.0 4.5 Cell volta ge /V
Specific capacity/(mAhg-1 ) 0.1C
0.2C 0.5C 1C
-20 0 20 40 60 80 100 120 140 160
2.0 2.5 3.0 3.5 4.0 4.5 Cell volta ge /V
Specific capacity/(mAhg-1 ) 0.1C
0.2C 0.5C 1C
0 5 10 15 20
90 100 110 120 130 140 150 160 1C 0.5C 0.2C 0.1C LiFe 0.99Nb0.01PO4/C
LiFe0.98Nb0.02PO4/C
LiFe0.97Nb0.03PO4/C
[image:6.596.103.482.156.436.2]Specific ca pa city/(m A g -1) Cycle numbers
Figure 4. Cycling performance and the first charge and discharge curve of LiFe1-xNbxPO4/C (x=0.01, 0.02, 0.03) at different rates
olivine structure and the minor adjustments of lattice structure upon cycling [19]. Compared with the other two materials, LiFe0.98Nb0.02PO4/C has a higher specific discharge capacity at different discharge rates. The capacity retention rate was up to 98.8% after 20 cycles. In addition, the reversibility is better, showing better electrochemical performance.
Yang [12] synthesized Ni-doped LiFe0.98Ni0.02PO4/C composites to study the electrochemical properties by solid-state synthesis method. The results showed discharge capacity of LiFe0.98Ni0.02PO4/C reached 154.7 mAh g-1 (at 0.2C rate). The capacity retention rate was 98.8% after 30 cycles.
Shao [18] via carbon-thermal reduction method prepared LiFe0.96V0.04PO4/C doping with V5+. We can found that discharge capacity of LiFe0.96V0.04PO4/C reached 141.1 mAh g-1 at 0.1C, after 20 cycles, the capacity retention rate was 97.0%.
Meng [19] studied electrochemical properties of Sm-doped LiFePO4/C by a sol-gel method. The experimental results showed LiFe0.94Sm0.06PO4/C had better discharge capacities of about 162.1 mAhg-1 at a rate of 0.1C and the capacity retention rate was 97.8% after 20 cycles.
Sun [20] prepared LiFe0.96V0.04PO4/C doping with V5+ by solid state reaction. He came to the conclusion that V5+ has obvious effect on improving its electronic or ionic mobility. The tests
[image:7.596.57.550.438.562.2]demonstrated discharge capacity of LiFe0.96V0.04PO4/C reached 146.5 mAh g-1 at 0.1C. The capacity retention rate was 96.0%.
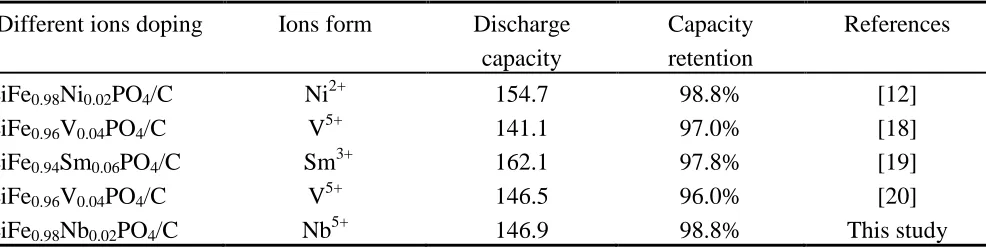
Table 1. Comparison of Different Ion Doping of LiFePO4/C on Electrochemical Properties
Different ions doping Ions form Discharge capacity
Capacity retention
References
LiFe0.98Ni0.02PO4/C Ni2+ 154.7 98.8% [12]
LiFe0.96V0.04PO4/C V5+ 141.1 97.0% [18]
LiFe0.94Sm0.06PO4/C Sm3+ 162.1 97.8% [19]
LiFe0.96V0.04PO4/C V5+ 146.5 96.0% [20]
LiFe0.98Nb0.02PO4/C Nb5+ 146.9 98.8% This study
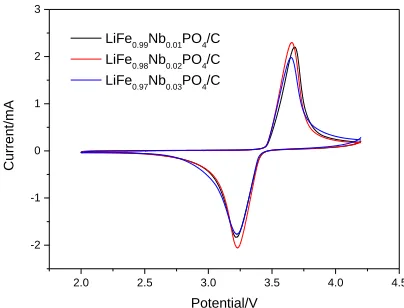
3.5. Cyclic Voltammetry of LiFe1-XNbxPO4/C Composites
2.0 2.5 3.0 3.5 4.0 4.5 -2
-1 0 1 2 3
Curr
en
t/m
A
[image:8.596.191.393.87.241.2]Potential/V LiFe0.99Nb0.01PO4/C LiFe0.98Nb0.02PO4/C LiFe0.97Nb0.03PO4/C
Figure 5. Cyclic voltammetry of LiFe1-xNbxPO4/C (x=0.01, 0.02, 0.03)
The voltage range is 2.0~4.2 V and the scanning speed is 0.1 mV/s. It can be seen from the figure that a pair of redox peaks appear in the cycle corresponding to the redox reactions of Fe3+/Fe2+ and Li+/Li, respectively, which is consistent with the previous report [20]. In addition, as the doping amount increases, the position of the oxidation peak and the reduction peak appear offset of different degrees, but the movement is not so large. Among them, the sample synthesized at a doping amount of 0.02 has a higher peak intensity and a narrower peak shape, which is more conducive to the migration of electrons and the diffusion and insertion of Li+ during the electrode reaction. This result may be important to practical production because it means that the addition amount of a relatively little Nb5+ can fully use the cathode material at a lower charge voltage [21]. Therefore, when the doping amount of Nb5+ is 0.02, synthesized sample has better electrochemical properties.
3.6. AC Impedance of LiFe1-XNbxPO4/C Composites
[image:9.596.150.401.193.383.2]
surface and the electrolyte. This viewpoint is also reported in previous paper [22]. The slopes of slash of the low frequencies in the three samples are approximately the same. This shows that the difference between the impedances of the three materials during charging and discharging is mainly caused by the high frequency region. So LiFe0.98Nb0.02PO4/C impedance is the smallest. Compared to other samples, it is easier to overcome the constraints of dynamic charge and more conducive to Li+ de-embedding. At the same time, electrochemical performance is better.
Figure 6. AC impedance of LiFe1-xNbxPO4/C (x=0.01, 0.02, 0.03)
4. CONCLUSIONS
XRD results showed that doping Nb5+ into the LiFePO4/C changed the lattice constant, but did not change the crystal form of LiFePO4. Physical morphology had also been greatly changed. Particle size is smaller and more uniform.
Through a series of electrical performance tests, it was found that when the Nb5+ doping amount was 0.02, the charge-discharge specific capacity of the material decreased with the increase of doping amount. In addition, the doped material had better high-rate performance and less attenuation.
The results of cyclic voltammetry showed that there were four pairs of redox peaks in the curve, which were consistent with the peaks on the charge-discharge curve. When the doping amount was 0.02, the cyclic voltammetry peak was high. So the material had the best performance when the doping amount was 0.02.
ACKNOWLEDGMENTS
This work was supported by Liaoning Provincial Natural Science Foundation of China(No.20170540776) and Program for Liaoning Innovation Talents in University.
References
1. X.B. Meng, X.Q. Yang, X.L. Sun, Advanced Materials, 24 (2012) 3589.
0 40 80 120 160 200
0 50 100 150 200 250 300
-Z
''/
cm
2
Z'/cm2
0 20 40 60 80 100
0 10 20 30 40 50
LiFe0.99Nb0.01PO4/C
LiFe0.98Nb0.02PO4/C
LiFe0.97Nb0.03PO4/C
-Z''
/
cm
2
2. T.F. Yi, X.Y. Li, H.P. Liu, Ionics, 18 (2012) 529.
3. B. Wang, Al. Abdulla. W, D. Wang, Energy & Environmental Science, 8 (2015) 869. 4. P. Hovington, M. Lagacé, A. Guerfi, Nano Letters, 15 (2015) 2671.
5. M. Shi, L.B. Kong, J. B, Ionics, 22 (2016) 185.
6. Y. Xu, J. Mao, Journal of Materials Science, 51 (2016) 10026.
7. J. Song, B. Sun, H. Liu, ACS Applied Materials & Interfaces, 8 (2016) 15225.
8. O.Y. Posudievsky, O.A. Kozarenko, V.S. Dyadyun, Journal of Solid State Electrochemistry, 19 (2015) 2733.
9. A. Chekannikov, S. Novikova, T. Kulova, Journal of Electrochemical Science And Engineering, 6 (2016) 1.
10.A. Örnek, O. Efe, Electrochimica Acta, 166 (2015) 338.
11.X. Zhang, M.V. Hulzen, D.P. Singh, Nature Communications, 6 (2015)1.
12.Y. Yang, K. Li, H. Li, International Journal of Applied Ceramic Technology, 12 (2015) 163. 13.V. Timoshevskii, Z. Feng, K.H. Bevan, ACS Applied Materials & Interfaces, 7 (2015) 18362. 14.W. Su, K. Xu, G. Zhong, International Journal of Electrochemical Science, 12 (2017) 6930. 15.Y. Ding, P. Pan, L.H. Chen, Z.B. Fu, J. Du, L.G. Guo and F. Wang, Ionics, 1 (2017) 1. 16.B. Zhang, X. Yuan, H. Li, X. Wang, J. Zhang, H. Chen and J. Zheng, Journal of Alloys and
Compounds, 627 (2014) 13.
17.L. Qu, D. Luo, S. Fang, Y. Liu, L. Yang, S.I. Hirano and C.C. Yang, Journal of Power Sources, 307 (2016) 69.
18.Z.C. Shao, J.L Xia, X.Q. Liu and G.Y. Li, Materials and Manufacturing Processes, 31 (2015) 695. 19.X. Meng, B. Han, Y.F. Wang, J.Y. Nan, Ceramics International, 42 (2015) 2599.
20.P.P. Sun, H.Y. Zhang, K. Shen, Q. Fan, and Q.Y. Xu, Journal of Nanoscience and Nanotechnology, 15 (2015) 2667.
21.J.S. Huang, L. Yang, K.Y. Liu, Y.F. Tang, Journal of Power Sources, 195 (2010) 5013. 22.X.J. Yang, Z.D. Hu, J. Liang, Ceramics International, 41 (2015) 2863.