She Figures 2009
Statistics and Indicators
on Gender Equality in Science
EUR 23856 EN
GENER
AL INFORMA
ERRATA
Regarding the Spanish data included in She Figures 2009 in Chapter 3 , please note that Grade A positions wrongly include a category of professors called "catedráticos de escuela universitaria" considered as "catedráticos de Universidad" which is th e Spanish equivalent to a full professor. The correct data are the following:
Figure 3.3 Proportion of women in grade A academic positions: 13% in 2002 and 14% in 2007.
Annex 3.1 Academic Staff:
Grade A: 1300 women and 7772 men. Grade B: 11259 women and 19600 men. Grade C: 2858 women and 2835 men.
Interested in European research?
Research*euis our monthly magazine keeping you in touch with main developments (results, programmes, events, etc.). It is available in English, French, German and Spanish. A free sample copy
or free subscription can be obtained from: European Commission
Directorate-General for Research Communication Unit
B-1049 Brussels Fax (32-2) 29-58220
E-mail: [email protected]
Internet: http://ec.europa.eu/research/research-eu
EUROPEAN COMMISSION Directorate-General for Research
Directorate L — Science, Economy and Society Unit L.4 — Scientific Culture and Gender Issues
Contact:Francesca Crippa
European Commission Office SDME 07/88 B-1049 Brussels Tel. (32-2) 29-91935
Fax(32-2) 29-93746
EUROPEAN COMMISSION
Directorate-General for Research Capacities Specific Programme
2009 EUR 23856 EN
She Figures 2009
LEGAL NOTICE
Neither the European Commission nor any person acting on behalf of the Commission is responsible for the use which might be made of the following information.
The views expressed in this publication are the sole responsibility of the author and do not necessarily reflect the views of the European Commission.
A great deal of additional information on the European Union is available on the Internet. It can be accessed through the Europa server (http://europa.eu).
Cataloguing data can be found at the end of this publication.
Luxembourg: Publications Office of the European Union, 2009
ISBN 978-92-79-11388-8 doi 10.2777/10329
© European Communities, 2009
Reproduction is authorised provided the source is acknowledged.
Printed inGermany
PRINTED ON WHITE CHLORINE-FREE PAPER
EUROPE DIRECT is a service to help you find answers to your questions about the European Union
Freephone number (*): 00 800 6 7 8 9 10 11
(*) Certain mobile telephone operators do not allow access to 00 800 numbers
This year the European Commission marks 10 years of ‘Women in Science’ activities. To understand the urgency and importance of this subject, She Figures 2009 offers numbers.
Take a snapshot of 2006: among European researchers, women remain a minority – only 30% of European researchers are women, to be precise. Browse the scientific fields: some are heavily staffed by women, others by men. In the Government Sector, across the EU-27, while there are equivalent numbers of women and men working in the field of Humanities, only 27% of researchers in Engineering and Technology are female. And what about researchers' career progression? Women account for 59% of graduates, whereas men account for 82% of full professors. Do you find it hard to believe? Check out chapter 3.
There is an imbalance in the number, seniority and influence of women and men in scientific studies and professions. She Figures 2009 is there to ground this statement in the data collected by Eurostat and the Statistical Correspondents of the Helsinki Group. It also aims to keep track of the progress made in this field, and to give all of us reasons to work for a better future of Europe's society and economy.
Indeed, She Figures 2009 tells us that the proportion of female researchers is actually growing faster than that of
men (over the period 2002-2006, +6.3% for women and +3.7% for men). Also, the share of women among scientists and engineers has grown by 6.2%, compared to 3.7% for men over the same period. Moreover, the Glass Ceiling Index is generally decreasing everywhere in Europe. You don't know what the
Glass Ceiling Index is? Another good reason to read chapter 3.
The figures are encouraging but the gender imbalance is not self-correcting. She Figures is recommended reading for all policy-makers, researchers, teachers, students, and parents who share a vision of a democratic, competitive and technologically advanced Europe.
As for previous editions, She Figures 2009 is the outcome of a coordinated effort. I would particularly like to thank the following persons who have made valuable contributions to this booklet:
• The Statistical Correspondents of the Helsinki Group on
Women and Science for providing data and technical advice (for detailed references please see annex 6);
• Síle O'Dorchai and Danièle Meulders at the Department
of Applied Economics of Université Libre de Bruxelles (DULBEA, ULB) for drafting the text and analysing the data of the She Figures 2009 leaflet and booklet;
• Antonia Margherita at SOGETI Luxembourg S.A.
(Luxembourg) for the data collection, layout and production of the She Figures 2009 leaflet and booklet;
• Florence Bouvret, Vera Fehnle, Camilla Gidlöf-Regnier,
and Johannes Klumpers from different units of the Directorate-General for Research for scientific and practical support;
• Veijo Ritola, Tomas Meri, Reni Petkova and Bernard Felix
at Eurostat for support with data quality and methodological issues;
• Francesca Crippa from the Directorate-General for
Research for impetus and overall co-ordination of this project.
She Figures 2009 is the third publication (following She Figures 2003 and She Figures 2006) of a key set of indicators that are essential to correctly comprehend the situation of women in science and research. The She Figures data collection is undertaken every three years as a joint venture of the Scientific Culture and Gender Issues Unit of the Directorate-General for Research of the European Commission and the group of Statistical Correspondents of the Helsinki Group.
The major findings and trends put forward by She Figures 2009 can be summarised as follows:
• Women in scientific research remain a minority,
accounting for 30% of researchers in the EU in 2006.
• In the EU, their proportion is growing faster than that of
men (6.3% annually over 2002-2006 compared with 3.7% for men); the same goes for the proportion of women among scientists and engineers (6.2% annually compared with 3.7% for men).
• On average in the EU-27, women represent 37% of all
researchers in the Higher Education Sector, 39% in the Government Sector and 19% in the Business Enterprise Sector, but in all three sectors there is a move towards a more gender-balanced research population.
• In the EU-27, 45% of all PhD graduates were women in
2006; they equal or outnumber men in all broad fields of
study, except for science, mathematics and computing (41%), and engineering, manufacturing and construction (25%).
• Over the period 2002-2006, there has been an increase
in the overall number of female researchers in almost all fields of science in the EU-27: the most positive growth figures characterised the fields of the medical sciences (+5.6% in HES and +12% in GOV), the humanities (+6.8% in HES and +4% in GOV), engineering and technology (+6.7% in HES and +10% in GOV) and the social sciences (+6.5% in HES and +3% in GOV).
• The highest shares of female researchers in the Business
Enterprise Sector are in the fields of the agricultural and medical sciences and the lowest shares in engineering and technology.
• Women’s academic career remains markedly
characterised by strong vertical segregation: the proportion of female students (55%) and graduates (59%) exceeds that of male students, but men outnumber women among PhD students and graduates (the proportion of female students drops back to 48% and that of PhD graduates to 45%). Furthermore, women represent only 44% of grade C academic staff, 36% of grade B academic staff and 18% of grade A academic staff.
• The under-representation of women is even more striking in the field of science and engineering: the proportion of women increases from just 31% of the student population at the first level to 36% of PhD students and graduates but then falls back again to 33% of academic grade C staff, 22% at grade B and just 11% at grade A.
• The Glass Ceiling Index stood at 1.8 in the EU-27 in 2007
(the higher the score, the thicker the ceiling).
• The proportion of women among full professors is
highest in the humanities and the social sciences (respectively 27.0% and 18.6%) and lowest in engineering and technology, at 7.2%.
• At the level of the EU-27, women account for 23% of
grade A academics among 35 to 44-year-olds, 21% among 45 to 54-year-olds and 18% among those aged over 55. The situation thus appears more favourable for the youngest generations of female academics but the gender gap is still persistent.
• In the Higher Education Sector, in the EU-27, 61% of
female R&D staff were researchers compared with 78% of men in 2006, but 21% of women in R&D hold technical occupations compared with 14% of men and, finally, 18% of women in R&D perform other supporting tasks compared with 8% of men. In the Government and the Business Enterprise Sectors, an even lower share of women are occupied as researchers than in the Higher Education Sector (respectively 47% and 41%), but
instead relatively more women work as technicians (respectively 23% and 33%) or as supporting staff (respectively 30% and 26%).
• The official measure of the overall gender pay gap
covering the entire economy stood at 25% in the EU-27 in 2006, a slight improvement from 2002 when it stood at 26%.
• On average throughout the EU-27, 13% of institutions in
the Higher Education Sector are headed by women and just 9% of universities have a female head.
• On average in the EU-27, 22% of board members are
women.
• R&D expenditure per capita researcher is usually the
highest in the Business Enterprise Sector. There seems to be a negative correlation between the level of expenditure and women’s representation, as the Business Enterprise Sector is precisely the sector in which women are the most under-represented.
Compared to the EU-15, in some new Member States the situation was on average more favourable for female scientists, while in others the situation was much worse. The policy implications of the results analysed in She Figures 2009 are numerous.
A transversal recommendation concerns the lack of harmonised and comparable data in general but particularly regarding the gender pay gap and the measurement of full-time equivalent employment rates to illustrate the part-time trap for women scientists that may turn out to be a major determinant of the persisting problem of vertical segregation in the academic world but also in the broader domain of research in general. Besides gender differences in part-time employment among scientists, in some countries there is also a pronounced gender gap in overtime hours, which cannot be captured in great detail using existing data.
Although in some countries the situation is more favourable for younger generations of women, the data by age groups reject the hypothesis of a spontaneous movement towards equality. Proactive policies are thus essential.
Given that the absence of a balanced gender composition in all study fields is due to the traditional choices made by girls
and boys alike, policy-makers should give equal attention to girls’ and boys’ choices.
A gender-mixed composition of nominating commissions, an increase in the objectivity of the applied selection criteria, tutoring of women, or even the fixing of quotas are all policies that are generally evoked to balance out the unequal situation that continues to prevail in the academic sector and to work against the discriminatory snowball effect (cfr. chapter 4). Moreover, the fight against gender stereotypes and the introduction of measures to promote a gender mix in all primary and secondary school study fields could favour the entry of young girls into the field of engineering and technology where they are particularly under-represented.
10
Table
List of Tables and Figures 11
General Introduction 15
Chapter 1 Setting the scope 19
Chapter 2 Scientific fields 38
Chapter 3 Seniority 65
Chapter 4 Setting the scientific agenda 92
Annex 1 Data relating to Chapter 1 105
Annex 2 Data relating to Chapter 2 109
Annex 3 Data relating to Chapter 3 115
Annex 4 Data relating to Chapter 4 121
Annex 5 Methodological Notes 125
Annex 6 List of the Statistical Correspondents of the Helsinki Group on Women and Science 151
References 153
11
List of Tables and Figures
Chapter 1 Setting the scope
Figure 1.1 Proportion of women in the EU-27 for total employment, tertiary educated and employed (HRSTC) and scientists and
engineers in 2007, compound annual growth rate for women and men 2002-2007 25
Figure 1.2 Employed professionals and technicians (HRSTC) as a percentage of tertiary educated (HRSTE) by sex, 2007 26
Figure 1.3 Proportion of scientists and engineers in the total labour force by sex, 2007 27
Figure 1.4 Proportion of female researchers, 2006 28
Figure 1.5 Compound annual growth rate for researchers by sex, 2002-2006 29
Figure 1.6 Researchers per thousand labour force by sex, 2006 30
Figure 1.7 Proportion of female researchers by sector, 2006 31
Figure 1.8 Distribution of researchers across sectors by sex, 2006 32
Figure 1.9 Compound annual growth rate for researchers in the Higher Education Sector (HES) by sex, 2002-2006 33 Figure 1.10 Compound annual growth rate for researchers in the Government Sector (GOV) by sex, 2002-2006 34
Figure 1.11 Compound annual growth rate for researchers in the Business Enterprise Sector (BES) by sex, 2002-2006 35
Figure 1.12 Distribution of researchers in the Higher Education Sector (HES) by sex and age group, 2006 36 Figure 1.13 Distribution of researchers in the Government Sector (GOV) by sex and age group, 2006 37
Chapter 2 Scientific fields
Figure 2.1 Proportion of female PhD (ISCED 6) graduates, 2006 49
Figure 2.2 Compound annual growth rate of PhD (ISCED 6) graduates by sex, 2002-2006 50 Table 2.1 Proportion of female PhD (ISCED 6) graduates by broad field of study, 2006 51
Figure 2.3 Distribution of PhD (ISCED6) graduates across the broad fields of study by sex, 2006 52 Table 2.2 Compound annual growth rates of PhD (ISCED6) graduates by narrow field of study in natural science and
engineering (fields 400 & 500) by sex, 2002-2006 53
Table 2.3 Evolution of the proportion of female PhD (ISCED6) graduates by narrow field of study in natural science
and engineering (fields 400 & 500), 2002-2006 54
Figure 2.4 Distribution of researchers in the Higher Education Sector (HES) across fields of science, 2006 55 Table 2.4 Compound annual growth rates of female researchers in the Higher Education Sector (HES) by field of science, 2002-2006 56
12
Figure 2.5 Distribution of researchers in the Government Sector (GOV) across fields of science, 2006 58 Table 2.6 Compound annual growth rates of female researchers in the Government Sector (GOV) by field of science, 2002-2006 59
Table 2.7 Evolution of the proportion of female researchers in the Government Sector (GOV) by field of science, 2002-2006 60 Figure 2.6 Distribution of researchers across economic activities (NACE) in the Business Enterprise Sector (BES), 2006 61
Table 2.8 Proportion of female researchers by economic activity (NACE) in the Business Enterprise Sector (BES), 2006 62 Table 2.9 Evolution of the proportion of female researchers in the Business Enterprise Sector (BES) by field of science, 2002-2006 63
Table 2.10 Dissimilarity index for researchers in Higher Education Sector (HES) and Government Sector (GOV), 2006 64
Chapter 3 Seniority
Figure 3.1 Proportions of men and women in a typical academic career, students and academic staff, EU-27, 2002/2006 73 Figure 3.2 Proportions of men and women in a typical academic career in science and engineering, students and academic staff,
EU-27, 2002/2006 74
Table 3.1 Proportion of female academic staff by grade and total, 2007 75
Figure 3.3 Proportion of women in grade A academic positions, 2002/2007 76
Figure 3.4 Percentage of grade A among all academic staff by sex, 2007 77
Figure 3.5 Glass Ceiling Index, 2004/2007 78
Table 3.2 Proportion of female grade A staff by main field of science, 2007 79 Figure 3.6 Distribution of grade A staff across fields of science by sex, 2007 80
Table 3.3 Proportion of female A grade staff by age group, 2007 81
Figure 3.7 Distribution of grade A staff across age groups by sex, 2007 82
Figure 3.8 Distribution of R&D personnel across occupations for the Higher Education Sector (HES) by sex, 2006 83
Figure 3.9 Distribution of R&D personnel across occupations for the Government Sector (GOV) by sex, 2006 84 Figure 3.10 Distribution of R&D personnel across occupations for the Business Enterprise Sector (BES), by sex, 2006 85
Figure 3.11 Distribution of R&D personnel across occupations in all Sectors (HES, GOV, BES) by sex, 2006 86
Figure 3.12 Gender pay gap in % for total economy, 2002/2006 87
Table 3.4 Gender pay gap in % by selected occupations for employees in private enterprise, EU-27 and EU-25, 2002/2006 88 Table 3.5 Gender pay gap in % by selected occupations for employees in public enterprise, EU-27 and EU-25, 2002/2006 89
Table 3.6 Gender pay gap in % by selected occupations in private and public enterprise, EU-27 and EU-25, 2002/2006 90 Table 3.7 Gender pay gap in % by age group for employees in private and public enterprise for ISCO
13
Chapter 4 Setting the scientific agenda
Figure 4.1 Proportion of female heads of institutions in the Higher Education Sector (HES), 2007 97
Table 4.1 Proportion of female heads of universities or assimilated institutions based on capacity to deliver PhDs, 2007 98
Figure 4.2 Proportion of women on boards, 2007 99
Figure 4.3 Evolution in research funding success rate differences between women and men, 2002/2007 100 Table 4.2 Research funding success rate differences between women and men by field of science, 2007 101
Figure 4.4 Proportion of female researchers in FTE and R&D expenditure in Purchasing Power Standards (PPS)
per capitaresearcher, 2006 102
Figure 4.5 R&D Expenditure in Purchasing Power Standards (PPS) per capitaresearchers in FTE by sector, 2006 103
Annex 1 Data relating to Chapter 1
Annex 1.1 Number of researchers by sex, HC, 2002-2006 105
Annex 1.2 Number of researchers in the Higher Education Sector (HES) by sex, HC, 2002-2006 106 Annex 1.3 Number of researchers in the Government Sector (GOV) by sex, HC, 2002-2006 107
Annex 1.4 Number of researchers in the Business Enterprise Sector (BES) by sex, HC, 2002-2006 108
Annex 2 Data relating to Chapter 2
Annex 2.1 Number of ISCED 6 graduates by sex, 2002-2006 109
Annex 2.2 Number of ISCED 6 graduates by broad field of study and sex, 2006 110
Annex 2.3 Number of ISCED 6 graduates by narrow fields of study and sex in natural science and engineering (400 & 500 fields), 2006 111
Annex 2.4 Number of researchers in the Higher Education Sector (HES) by fields of science and sex, 2006 112 Annex 2.5 Number of researchers in the Government Sector (GOV) by fields of science and sex, 2006 113
Annex 2.6 Number of researchers in the Business Enterprise Sector (BES) by economic activity (NACE) and sex, 2006 114
Annex 3 Data relating to Chapter 3
Annex 3.1 Number of academic staff by grade and sex, 2007 115
Annex 3.2 Number of senior academic staff (Grade A) by field of science and sex, 2007 116
Annex 3.3 Number of academic staff (Grade A) by age group and sex, 2007 117
Annex 3.4 Number of R&D personnel across occupations for the Higher Education Sector (HES) by sex, 2006 118
14
Annex 4 Data relating to Chapter 4
Annex 4.1 Number of heads of institutions in the Higher Education Sector (HES) by sex, HC, 2007 121
Annex 4.2 Number of applicants and beneficiaries of research funding by sex, 2002-2007 122
16
Statistics and indicators on women in science are a key element of the mainstreaming approach to equal opportunities. She Figures 2009 is a collection of available data related to the situation of women in science and research. This data collection has evolved from the willingness to pay attention to the gender dimension of research and to monitor gender equality in a field where strong gender imbalances persist. It also reflects a clear wish to develop pan-European harmonised statistics facilitating cross-national comparisons and to build a base of gender disaggregated data available at the EU-level that allows to track changes over time and that has great value both to increase knowledge and to inform policies.
She Figures 2009 follows in the footsteps of She Figures 2003 and She Figures 2006. In general, chapters 1 and 2 are concerned with horizontal segregation, and chapters 3 and 4 with vertical segregation. Chapter 1 assesses the presence of women in research from a cross-country perspective. In particular, while it highlights the rapid progression of women in science, engineering and technology, it also draws the broad lines of the problem of gender segregation in science, fully analysed in chapter 2 on scientific fields. Chapter 2 also shows that a rapid catching up movement by women is taking place so that in the near future women will level with men at the PhD level. Chapter 3 on researchers’ seniority illustrates the workings of a Glass Ceiling that women hit during their ascent in the academic hierarchy. Moreover, there is no spontaneous reduction of vertical segregation and of the gender pay gap over time. Finally,
chapter 4 shows that women’s under-representation at the highest hierarchical levels of the academic career severely cuts their chances of being at the head of higher education institutions, which makes it hard for young women in academia to find female role models, and it biases all decisions that are taken at these high ranks regarding scientific policies, research subjects and credits and nominating rules and criteria.
17
Positive trends can be observed such as the considerable growth in the proportion of female scientists and engineers or in the share of women graduating at PhD level in sciences. However, horizontal gender segregation across different economic sectors and fields of science persists everywhere. Female researchers are far more likely to be employed in the Higher Education and the Government Sectors than in the Business Enterprise Sector, which attracts the bulk of research efforts. Female researchers feature in higher proportions in social sciences, agricultural sciences, medical sciences, and humanities than in engineering and technology, a key research area. Despite an increase in the percentage of women at the different stages of a typical academic career between 2002 and 2006, vertical segregation of women in science is also extremely persistent.
It thus seems that women’s massive entry and rapid progression in science is bringing about a more equal representation of men and women in all fields of science and at all stages of the academic career. However, it still fails to give them an equal opportunity to participate in decision-making concerning scientific policies, research subjects and grants, and so forth. In policy terms, it is crucial to promote a high representation of women on boards that determine scientific policy in all countries. Their presence is not only essential to promote the cause of women in science; in scientific research, diversity is a factor for higher chances of excellence.
The implications of these gender imbalances are highly relevant for the European economy.
Data sources
Most of the statistics used in this publication are drawn from Eurostat, the European Commission services’ official data source. In addition, Statistical Correspondents from all EU Member States, together with Croatia, Iceland, Israel, Norway, Switzerland and Turkey provided data on the seniority of academic staff by sex and age group, differences between men and women for funding success rates, proportion of women on scientific boards and number of female heads of universities and other institutions in higher education. The Statistical Correspondents form a sub-group of the Helsinki Group on Women and Science led by the Scientific Culture and Gender Issues Unit of the Directorate-General for Research. A list of the Statistical Correspondents can be found in Annex 6.
Eurostat
The data from Eurostat all originate from a variety of different surveys conducted at national level:
• Researchers and R&D expenditure data are collected
through the R&D Survey, which since 2004 has been carried out as a joint data collection between Eurostat and the OECD. R&D data for Japan and the United States come from the OECD’s Main Science and Technology Indicators (MSTI).
• Human Resources in Science and Technology (HRST)
data are collected through the European Union Labour Force Survey (EU LFS).
• Education data are collected through the UOE
18
• Gender pay gap data have been collected through
SES2002 and SES2006 (Structure of Earnings Surveys 2002 and 2006).
Statistical Correspondents
The statistics on the seniority of academic staff, research funding success rates, membership of scientific boards and heads of institutions are collected at the national level through Higher Education and R&D Surveys, Ministries and Academies of Science, Research Councils and Universities as part of their own monitoring systems and administrative records. It should be noted that these data are not always ready for cross-country comparison at EU level. Technical details relating to adherence to standards and categorisation and data sources can be found in Annex 5. Key definitions
PhD/Doctorate or equivalent graduates: The International Standard Classification of Education (ISCED) identifies a
specific level – ISCED 6 – as “tertiary programmes which lead
to the award of an advanced research qualification”
(UNESCO, 1997). Education programmes such as PhDs and their equivalents are included in this level for all countries, as well as some post-doctoral programmes and, in a few cases, some shorter post-graduate programmes that are a
pre-requisite for the Doctorate (for example the D.E.A. in France).
Human Resources in Science & Technology (HRSTC): This section of the workforce is defined as those who are both qualified tertiary educated graduates in the labour force and those who are working in professional or technician occupations not formally qualified as above.
Scientists and Engineers (S&E): Data for this group are also drawn from the European Union Labour Force Survey, more specifically from the professional occupations category, but are restricted to “physical, mathematical and engineering occupations” and “life science and health occupations” and therefore exclude scientists in other occupational fields, such as social, or agricultural sciences. Researchers: According to the common definition in the
Frascati Manual (OECD, 2002), “Researchers are
professionals engaged in the conception or creation of new knowledge, products, processes, methods and systems and also in the management of the projects concerned”.
Setting the scope
20
The purpose of this chapter is to assess the presence of women in research in a cross-country perspective and set the context for the chapters that follow. When reading She Figures 2009, one important consideration needs to be kept in mind. For reasons of data limitations, all data presented throughout the different chapters of this publication are measured in headcount and thus fail to take into account the prevalence of part-time employment in the female research population. Headcount data mask substantial variation in working hours both within the population of female researchers and when comparing men and women in research. It is therefore essential to temper the positive image of women’s progression in science keeping in mind their greater likelihood of holding part-time jobs.
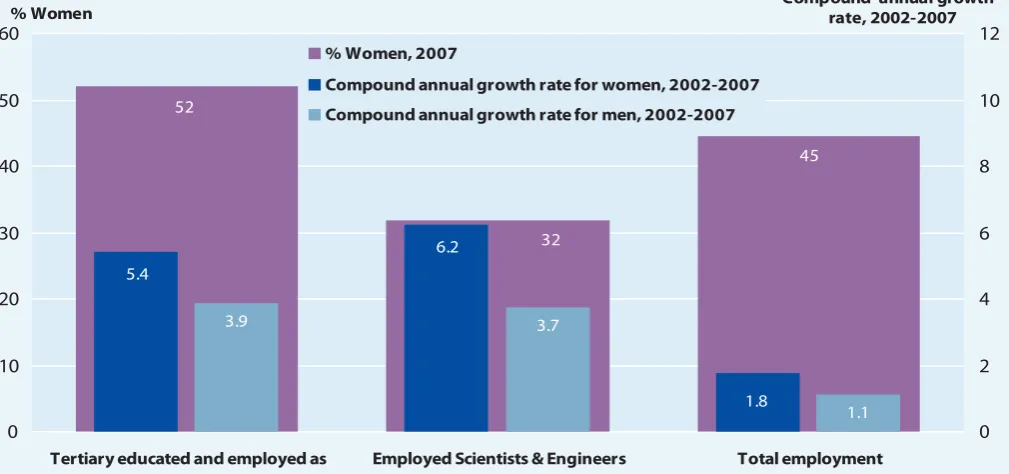
Figure 1.1 compares the proportion of women in total employment with their share among the highly educated employed as professionals or technicians and among those
working as scientists and engineers for the year 2007. The
fact that the proportion of women is higher among highly educated professionals or technicians (52%) than in total employment (45%) illustrates that tertiary educated women are more successful in finding a job than their counterparts with a lower level of education. However, their proportion drops to 32% among employed scientists and engineers which in turn exemplifies the problem of gender segregation in education. Between 2002 and 2007, women have been catching up with men as women’s compound annual growth rate has exceeded that of men both in total employment and in the two more precise subgroups. The
difference is largest among scientists and engineers, where the share of women has grown by an average of 6.2% per year between 2002 and 2007 compared with a male growth rate of just 3.7%. These growth rates are respectively 5.4% and 3.9% for highly educated women and men working as professionals or technicians. Employment in these subcategories thus seems to be expanding much more rapidly over recent years for both men and women than total employment. The growth in total employment was limited to 1.8% on average per year for women and to 1.1% for men over the period considered.
21
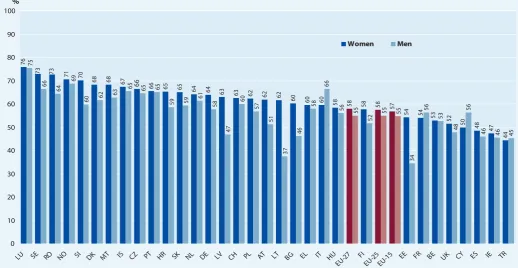
Gender differences stand out more in the field of science and engineering in most EU countries. Figure 1.3 shows that, in 2007, there were only three countries where the proportion of female scientists and engineers was at 50% or more: Latvia (50%), Lithuania (53%), and Poland (54%). On average 32% of scientists and engineers were women in the EU-27. In many countries, the share of women among scientists and engineers was at a much lower level still. Switzerland is at the very bottom of the country ranking with just 18% of women in this category. The gender distribution is very similar in the population of researchers
(Figure 1.4). The average proportion of female
researchers in the EU-27 stood at 30% in 2006 but wide variations were noted between countries: Japan, Luxembourg and the Netherlands respectively have 12%, 18% and 18% of female researchers. At the top of the country ranking according to the proportion of women in research, there are the Baltic States but also Bulgaria, Croatia, Portugal, Romania, and Slovakia, all of which have more than 40% of women in their research population. The compound annual growth rate of the numbers of female and male scientists over the period 2002-2006 is shown in Figure 1.5. Again women seem to be catching up with men over time as their share of the total research population has been growing at a faster rate over recent years (exceptions are the Czech Republic, Romania, Bulgaria, Hungary, Latvia
and France). In the EU-27 on average, the number of
female researchers has increased at a rate of 6.3% per year compared with 3.7% for male researchers. Given that the mean growth rate for women is higher in the EU-15
than in the EU-27 whereas both geographical entities put forth the same growth rate for male researchers, it appears that in the EU’s most recent Member States, the share of women in research is increasing at a slower pace than in the older Member States. Important exceptions are Malta and Cyprus where the compound annual growth rates of female researchers were as high as 14% and 13% respectively between 2002 and 2006. Moreover, from Figure 1.5 it appears that the gender gap in growth rates is generally smaller in low-growth countries and higher in high-growth countries. It is the widest in Malta, Austria and Switzerland. This positive trend over time should not mask the pattern of female under-representation as shown in Figure 1.4 (proportion of female researchers). A similar pattern was also noted in the analysis of the number of researchers in the total labour force by sex. Figure 1.6 plots these results
per thousand for the year 2006. Five exceptions aside, there
are considerably fewer female researchers among active women than there are male researchers among active
men.The male rates were 10 or more points per thousand
22
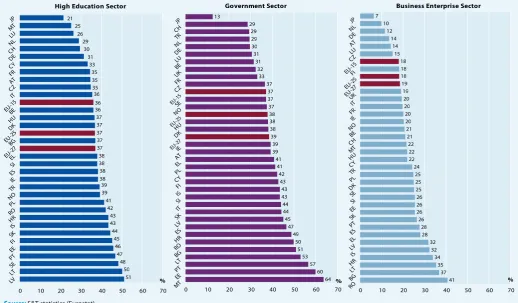
Figure 1.7 allows for a more detailed analysis of the proportions of female researchers as they were presented in Figure 1.4 for the year 2006. It yields the proportion of female researchers in three broad economic sectors: Higher Education, the Government Sector and the Business Enterprise Sector. Whereas women’s presence appears to be relatively similar in the Government Sector and in Higher Education, it is considerably weaker in the Business
Enterprise Sector. On average in the EU-27, women
represent 37% of all researchers in the Higher Education Sector, 39% in the Government Sector but merely 19% in the Business Enterprise Sector.The degree of cross-country disparity is fairly low in the Higher Education and Government Sector but much larger in the Business Enterprise Sector. In the Higher Education Sector, 4 countries have proportions of women in research that are below 30% (the Netherlands, Japan, Luxembourg and Malta). On the contrary, female proportions of 50% or more are found in Lithuania and Latvia. In the Government Sector, below 30% of all researchers are women in the Netherlands, Japan, Turkey and Switzerland; and 50% or more in Lithuania, Estonia, Romania, Bulgaria, Portugal and Malta. In the Business Enterprise Sector, the country distribution in terms of the size of the proportion of female researchers is skewed downwards compared with the previous two sectors. Women represent less than 15% of the research population in 5 countries (the Netherlands, Japan, Austria, Germany, and Luxembourg). Their share is highest, although still only at 41%, in Romania. In sum, regardless of the sector,
two countries systematically show the lowest proportions of female researchers, notably the Netherlands and Japan, whereas Lithuania and Romania always have the highest proportions of women in research.
23
The Private Non-Profit Sector employs a share of researchers that is worth mentioning only in Italy, Cyprus, the UK, and particularly Portugal (12% of female researchers and 13% of male researchers in 2006). Has this gender imbalance across broad economic sectors been levelling out over recent years? From Figures 1.9, 1.10 and 1.11, it appears that this
has not really been the case. In the Higher Education
Sector, which hosts a larger share of female researchers, the compound annual growth rate in the number of female researchers has been stronger than that of men over the period 2002-2006 in most countries (26 out of 31). The opposite was observed only in 5 countries: the Czech Republic, Greece, the Netherlands, Latvia, and Sweden. However, the differences in growth rates are extremely modest in the former three countries. In Latvia, the compound annual growth rate over 2002-2006 of male researchers stood at 4.6% and that of female researchers at 3.6%. Only in Sweden has the gender difference in growth rates of male and female researchers been really sizeable; the number of female researchers has indeed been decreasing over recent years at an average annual pace of -3.5%, whereas the number of male researchers has been slowly on the rise at a rate of 1.4%. These exceptions aside, in most countries there seems to be no move towards a more gender-balanced research population in higher education. Throughout the EU-27, the average annual growth rate for female researchers has stood at 4.8%, compared with 2.0% for male researchers. Finally, growth rates for both female and male researchers are extremely variable between countries, ranging from 22% for women
and 20% for men in Romania to the extremely low, or even
negative, levels already mentioned for Sweden. A very
similar pattern was noted in the Government Sector, which employed a larger share of female researchers than male researchers and where in most countries women’s presence has been strengthening over recent years. On average, in the EU-27, the number of female researchers has been growing at a pace of 5.4% per year compared with 2.3% for men. There are just four exceptions to this overall pattern. In Hungary and Portugal, the growth rate of male researchers is only marginally higher than that of women. In Latvia and Luxembourg, male researchers have been reinforcing their predominance in this sector over the period 2002-2006, at an annual rate of 19.8% in Latvia (compared with an 8.7% for female researchers) and 10.8% in Luxembourg (compared with 5.9% for female researchers). Again, the cross-country distribution of growth rates is very wide, ranging from 21.3% for female researchers in Iceland to -3.8% in Croatia and from 19.8% for
male researchers in Latvia to -4.8% in Croatia. Finally, in the
24
For example, whereas in Lithuania the respective compound annual growth rates for female and male researchers stood at 33.6% and 29.6% over the period 2002-2006, in Norway, the number of female researchers decreased at a slightly lower pace than the number of male researchers ( 1.1% and 2.3% respectively). The opposite was observed in 13 countries, pointing towards a widening over time of the gender gap in the research population of the Business Enterprise Sector. These countries are Turkey, Poland, Hungary, France, Slovenia, the Czech Republic, Cyprus, Portugal, Germany, Bulgaria, Romania, Latvia and Slovakia. Finally, in Sweden, the UK and Croatia, similar growth rates were noted for the male and female researcher populations.
The picture of women in research is further completed by Figures 1.12 and 1.13, which break down the distribution of both male and female researchers into 4 different age groups (<35 years, 35-44 years, 45-54 years, and 55+ years). Figure 1.12 does this for the Higher Education Sector and Figure 1.13 for the Government Sector. In both of these large economic sectors, the greatest gender differences are in most countries observed in the two extreme age classes,
among the youngest researchers aged under 35 and among
those above 55 years of age. Whereas women tend to
outnumber men in the youngest age group, the opposite was observed for researchers above 55 years of age. Clearly, these figures illustrate the workings of a generation effect.
25
Figure 1.1:Proportion of women in the EU-27 for total employment, tertiary educated and employed (HRSTC) and scientists and engineers in 2007, compound annual growth rate for women and men, 2002-2007
52
32
45
1.8 6.2
5.4
1.1 3.7
3.9
0 10 20 30 40 50 60
Tertiary educated and employed as professionals or technicians (HRSTC)
Employed Scientists & Engineers Total employment
% Women
0 2 4 6 8 10 12
Compound annual growth rate, 2002-2007
% Women, 2007
Compound annual growth rate for women, 2002-2007
Compound annual growth rate for men, 2002-2007
Source: Labour Force Survey, HRST statistics (Eurostat)
26
71 70 68 68
67 66 66
65 65 64 64
63 63 62 62 62 60
60 60 58 58 58 58
57
54 54
52 50 48 47
44
75
66 64 69
60 62 63
65 65 65
59 59 61 58
47
60
57
51
37
46
58
66
56 55
52 55 55
34
53
48
56
46 46 45
53
73
73
76
56
0 10 20 30 40 50 60 70 80 90 100
LU SE RO NO SI DK MT IS CZ PT HR SK NL DE LV CH PL AT LT BG EL IT HU
EU-27 FIEU-25EU-15 EE FR BE UK CY ES IE TR
%
Women Men
Source: HRST statistics (Eurostat)
Exceptions to the reference year: HR, IS: 2006 Data unavailable:IL
Data estimated: EU-27 (by Eurostat), EU-25, EU-15 (by DG Research)
[image:27.595.53.572.61.329.2]27
4.0 3.9 3.8 2.9 2.9
2.5 2.2 2.2 2.1 2.0 2.0 2.0 1.9 1.9 1.8 1.7 1.6 1.5 1.5 1.5 1.4 1.4 1.4 1.4 1.3 1.2 1.2 1.2 1.2
1.1 1.1 1.0 0.9 0.9 0.5 4.1 4.6 4.1
4.5
2.5 2.2 2.7
5.4 4.9
2.8 3.3 4.4
3.2 3.3
1.8 3.6
2.9 4.1
1.9 3.1
1.8 3.1
6.4
3.3 4.7
2.8 2.0 2.3
4.4 4.6
2.5 2.3 1.8
2.7
1.1
0 1 2 3 4 5 6 7 8 9 10
BE IS IE SE PL LT EE FI NL ES CY DK NO SI LV
EU-27 RO FR BG EL PTEU-25 CH EU-15 DE HU HR MT UK LU CZ IT SK AT TR
%
Women Men
Source: Labour Force Survey, HRST statistics (Eurostat)
Exceptions to the reference year:HR, IS: 2006 Data unavailable:IL
Data estimated: EU-27 (by Eurostat), EU-25, EU-15 (by DG Research) Confidential data:DK (women), EE (men), LU (women), HR (women) The labour force is defined as the sum of employed and unemployed persons
28
44 44 43 43
42 39 39
37
36 36 36 35
33 33 33 32 32
30 30 30 30 30 29
28 28 27
25
21
18 18
12 26
45 47 49
0 5 10 15 20 25 30 35 40 45 50
LT LV BG HR PT RO EE SK PL IS ES TR EL SE SI NO IT HU CY FI
EU-27 BE DK IEEU-25EU-15 CZ FR CH MT AT DE LU NL JP
%
Source: S&T statistics (Eurostat), Norwegian Institute for Studies in Innovation, Research and Education
Exceptions to the reference year:CZ, EE, SK, NO: 2007; BE, DK, DE, IE, EL, LU, NL, PT, SE, IS, JP: 2005; CH: 2004 Data unavailable: UK, IL
Provisional data: NL
[image:29.595.54.574.54.321.2]Data estimated: EU-27, EU-15 (by Eurostat), EU-25 (by DG Research), EE Head count
29
11. 2 10. 0 9. 1 7. 6 7. 5 7. 1 6. 9 6. 9 6. 9 6. 5 6. 5 6. 4 6. 4 6. 3 6. 1 5. 9 5. 9 5. 8 5. 7 5. 1 4. 6 4. 5 4.4 4.4
4. 3 3. 1 2. 2 0. 9 -0 .2 5. 9 3.
7 4.3
5.
1 5.8
-2
.6
3.
7 3.8
7. 1 5. 5 0. 0 2.
5 2.6
4.
4
0.
3
3.
8 4.1
3. 2 4. 4 2. 5 6. 5 0. 5 -2 .7 2. 6 12. 3 12. 8 13. 7 2. 0 5. 7 2. 4 3. 0 4. 2 4. 3 6. 4 9.
1 9.4
0. 1 3. 6 5. 6 -5 0 5 10 15
MT CY LU AT IT DK ES IS
EU-15 NL EL LT TR CH FIEU-25EU-27 SK CZ EE DE BE JP RO IE NO PT SI FR BG HU LV PL HR
%
Compound annual growth rate for women, 2002-2006 Compound annual growth rate for men, 2002-2006
Source: S&T statistics (Eurostat), Norwegian Institute for Studies in Innovation, Research and Education
Exceptions to the reference year (s):SK, CZ, EE: 2002-2007; CH: 2000-2004; EL, IS, NO: 2001-2005; BE, DK, IE, PT, JP: 2002-2005; DE, LU, NL: 2003-2005; PL: 2003-2006; MT, FI: 2004-2006 Data unavailable: UK, SE, IL
Break in series:MT (2004), DK (2002), FR (2002) Provisional data: NL (2005)
Data estimated:EU-27, EU-25, EU-15 (by DG Research), LU (2003 - women), PT (2002), EE (2007) Head count
[image:30.595.56.569.47.317.2]30
19
13 13
10
9
8
8 8
7 7 7 6
6 6 6 6 6 6 6 6 5 5
5 5 5 5 5 5
5 5
3 3 3
2
25
27
21
20 20
11
8
13
8
17
7
10
6
14
10
6
3
7
10
9
6
17
10
9
6
14
4
5
3
9
10
7
9
13
0 5 10 15 20 25 30
IS FI SE NO DK EE ES LT BE SK AT PT SI EL LV CH IE HU FR HR TR MT CZ
EU-25 PL LUEU-15EU-27 IT DE BG CY RO NL
‰
Women Men
Source: Labour Force Survey, S&T statistics (Eurostat), Norwegian Institute for Studies in Innovation, Research and Education
Exceptions to the reference year:Researchers: SK, CZ, EE: 2007; BE, DK, DE, IE, EL, LU, NL, PT, SE, IS, NO, JP: 2005; CH: 2004 Data unavailable: UK, IL
Provisional data:NL
Data estimated: EU-27, EU-25, EU-15 (by DG Research), EE Researchers: Head count
The labour force is defined as the sum of employed and unemployed persons
31
High Education Sector
51 50 48 47 46 45 44 43 43 42 41 39 39 38 38 38 38 37 37 37 37 37 36 36 36 35 35 35 33 31 30 29 26 25 21
0 10 20 30 40 50 60 70 LV LT SE PT EEFI SK IS HR RO PL NO TR IE ES SI EL EU-27 BG EU-25 DK HU BE EU-15 IT CZAT FR CY DE CH NLLU MT JP % Government Sector 64 60 57 53 51 50 49 47 45 44 44 43 43 43 42 41 41 39 39 39 38 38 38 37 37 37 37 33 32 31 31 30 29 29 29 13
0 10 20 30 40 50 60 MT EE PTLT BG RO HRES LV SK IT SI IS FI CYPL EL AT IE EU-27 DK HU EU-25 NO SE EU-15 CZFR UKBE LU DE NLTR CH JP
Business Enterprise Sector
41 37 35 34 32 32 28 28 26 26 26 26 25 25 25 24 22 22 22 21 21 20 20 20 20 19 19 18 18 18 15 14 14 12 10 7
0 10 20 30 40 50 60 70 ROBG LT HR IS LVEL ES PT SKEE SI SE DKPL TR CY HU MT CHBE NO IE FR IT UK EU-27 EU-25 FI EU-15 CZ LU AT DE NL JP % % 70
Source: S&T statistics (Eurostat)
Exceptions to the reference year: SK, CZ, EE, MT (HES, GOV), IE (GOV): 2007; BE (HES, GOV), DK (BES), DE (BES), IE (BES), EL, LU, NL, PT, SE, IS, NO, JP: 2005; CH (HES, BES): 2004 Data unavailable: IL, UK (HES)
Provisional data: HES:MT, NL; GOV:IE (total), MT, UK (total); BES: BE Data estimated: EU-27, EU-25, EU-15 (by DG Research); HES:NL, CH; BES: EE, UK Head count
[image:32.595.54.573.41.344.2]32
0 10 20 30 40 50 60 70 80 90 100 Wo m en Me n Wo m en Me n Wo m en Me n Wo m en Me n Wo m en Me n Wo m en Me n Wo m en Me n Wo m en Me n Wo m en Me n Wo m en Me n Wo m en Me n Wo m en Me n Wo m en Me n Wo m en Me n Wo m en Me n Wo m en Me n Wo m en Me n Wo m en Me n Wo m en Me n Wo m en Me n Wo m en Me n Wo m en Me n Wo m en Me n Wo m en Me n Wo m en Me n Wo m en Me n Wo m en Me n Wo m en Me n Wo m en Me n Wo m en Me n Wo m en Me n Wo m en Me n Wo m en Me n Wo m en Me n Wo m en Me n Wo m en Me nEU-27 EU-25 EU-15 BE BG CZ DK DE EE IE EL ES FR IT CY LV LT LU HU MT NL AT PL PT RO SI SK FI SE UK HR TR IS NO CH JP
%
Higher Education Sector Business Enterprise Sector Government Sector Private Non-Profit Sector
Source: S&T statistics (Eurostat)
Exceptions to the reference year: SK, CZ, EE: 2007; BE, DK, DE, IE, EL, LU, NL, PT, SE, IS, NO, JP: 2005; CH: 2004 Data unavailable:IL; PNP:DE, IE, LV, LT, LU, HU, NL, NO, CH, TR
Provisional data: HES: NL; GOV:UK (total)
Data estimated:EU-27, EU-25, EU-15 (by DG Research); BES: EE, UK; HES: NL; PNP:UK Head count
33
Figure 1.9:Compound annual growth rate for researchers in the Higher Education Sector (HES) by sex, 2002-2006
10. 4 10. 0 9. 0 8. 8 8. 5 7. 8 7. 7 7. 4 7. 4 7. 2 7. 1 7. 0 6. 9 5. 9 5. 8 5. 0 4. 8 4.
8 4.8
4. 6 4. 5 4. 3 4. 2 3. 7 3. 6 3. 4 1. 3 0. 5 -3 .5 3. 6 2. 2 7. 8 6. 3 4. 9 3. 0 6. 1 3.
9 4.7
1.
7 2.0 2.5 2.6 2.1
1. 0 2. 3 4. 6 1. 7 -0
.7 -0.1
0. 9 -0 .8 1. 4 0. 5 22. 0 19. 4 11. 9 2. 9 1. 8 3. 5 2. 7 6. 0 15. 6 20. 0 2. 0 4. 0 -0 .8 5. 3 4. 3 -5 0 5 10 15 20 25
RO CY AT IS IT DE FI SK DK CZ BE BG LT NO SI CH EL PT IE
EU-15EU-27 TR MTEU-25 EE JP ES LV FR HR HU NL PL SE
%
Compound annual growth rate for women, 2002-2006 Compound annual growth rate for men, 2002-2006
Source: S&T statistics (Eurostat)
Exceptions to the reference year (s):CZ, EE, MT, SK: 2002-2007; DE, PL: 2003-2006; FI: 2004-2006; LU: 2000-2005; EL, SE, IS, NO: 2001-2005; BE, NL, PT, JP: 2002-2005; CH: 2002-2004 Data unavailable: UK, IL
Break in series: DK (2002), FR (2002), SE (2005) Provisional data: MT (2007), NL (2005)
Data estimated: EU-27, EU-25, EU-15 (by DG Research); PT (2002), CH (2002-2004), NL (2005) Head count
34
Figure 1.10:Compound annual growth rate for researchers in the Government Sector (GOV) by sex, 2002-2006
13. 3 12. 3 11. 3 8. 7 8. 3 7. 6 7. 5 7. 0 6. 8 6. 1 5. 9 5. 9 5. 4 5. 0 4. 8 4. 7 4. 5 4. 1 4. 0 3. 6 2. 8 2. 7 2. 2 2. 0 1. 9 0. 9 0. 4 -0 .6 -0 .8 -3 .8 19. 8 5. 0 2. 3 1.
2 1.6
10.
8
-1
.9
1.
5 1.6
-0 .5 4. 1 3. 9 0. 2 -4 .0 1.
0 2.1
-0 .5 0. 4 0. 3 -3 .4 -0 .5 -1 .2 -1 .2 -4 .8 0. 2 21. 3 19. 8 14. 1 0. 6 3. 4 2. 3 2. 4 9. 3 17. 7 5. 3 7. 0 -1 .3 8. 8 -2 .1 2. 7 -5 0 5 10 15 20 25
IS SE ES IT NL TR LV CY BE AT
EU-15 FI DE LUEU-25EU-27 CH CZ NO DK EE SK JP PT IE FR HU EL BG SI LT UK RO PL HR
%
Compound annual growth rate for women, 2002-2006 Compound annual growth rate for men, 2002-2006
Source: S&T statistics (Eurostat)
Exceptions to the reference year (s): CZ, EE, IE, MT, SK: 2002-2007; DE, PL: 2003-2006; FI: 2004-2006; SE: 2003-2005; EL, NL, IS, NO: 2001-2005; BE, LU, PT, JP: 2002-2005 Data unavailable:IL
Break in series: DK (2002), FR (2002), SE (2005)
Provisional data: IE (2007- total), MT (2007), UK (2006 - total) Data estimated: EU-27, EU-25, EU-15 (by DG Research); PT (2002) Head count
35
Figure 1.11:Compound annual growth rate for researchers in the Business Enterprise Sector (BES) by sex, 2002-2006 18. 3 17. 8 17. 8 17. 1 11. 5 11. 0 10. 0 7. 5 7. 1 6. 8 6. 6 6. 2 5. 6 4. 8 4. 3 4. 2 3. 8 3. 2 3. 1 3. 1 2. 8 2. 5 2. 5 2. 1 1. 9 0. 5 0. 1 -6 .4 -7 .8 -9 .3 -1 2. 9 12. 9 3. 6 10. 7 9. 8 -7 .7 5. 9 4. 2 3. 3 3.
0 3.2 5.0
9. 8 2. 3 1. 0 -1 .7 5.
0 6.0
1. 8 15. 8 0. 1 -2 .3 -2 .3 -7
.8 -6.3
3. 5 0. 1 20. 1 25. 8 33. 6 -1 .1 3. 9 3. 3 17. 8 15. 2 7. 2 29. 6 27. 1 12. 4 10. 6 5. 3 0. 6 -15 -10 -5 0 5 10 15 20 25 30 35
LT TR MT EL EE SE ES AT DK PL JP HU CH LU SI IE IS
EU-25EU-15EU-27 FR CZ IT NL BE FI CY PT DE BG UK NO SK HR RO LV
%
Compound annual growth rate for women, 2002-2006 Compound annual growth rate for men, 2002-2006
Source: S&T statistics (Eurostat)
Exceptions to the reference year (s): CZ, EE, SK: 2002-2007; PL: 2003-2006; MT, FI: 2004-2006; LU, SE: 2003-2005; EL, NL, IS, NO: 2001-2005; IE, PT, JP: 2002-2005; CH: 2000-2004; UK: 2005-2006
Data unavailable: IL
Break in series: DK (2002), ES (2002), MT (2004), SE (2005) Provisional data: BE (2006)
36
Figure 1.12:Distribution of researchers in the Higher Education Sector (HES) by sex and age group, 2006
0 10 20 30 40 50 60 70 80 90 100 Wo m en Me n Wo m en Me n Wo m en Me n Wo m en Me n Wo m en Me n Wo m en Me n Wo m en Me n Wo m en Me n Wo m en Me n Wo m en Me n Wo m en Me n Wo m en Me n Wo m en Me n Wo m en Me n Wo m en Me n Wo m en Me n Wo m en Me n
BG CZ EE IT CY LV LT LU HU AT PT RO SI SK FI HR NO
%
<35 35-44 45-54 55+
Source: S&T statistics (Eurostat)
37
Figure 1.13:Distribution of researchers in the Government Sector (GOV) by sex and age group, 2006
0 10 20 30 40 50 60 70 80 90 100 Wo m en Me n Wo m en Me n Wo m en Me n Wo m en Me n Wo m en Me n Wo m en Me n Wo m en Me n Wo m en Me n Wo m en Me n Wo m en Me n Wo m en Me n Wo m en Me n Wo m en Me n Wo m en Me n Wo m en Me n Wo m en Me n
BG CZ EE IT CY LV LT LU HU AT PT RO SI SK HR NO
%
<35 35-44 45-54 55+
Source: S&T statistics (Eurostat)
39
Although girls are generally more successful than boys at school – they less often repeat a year and obtain better results (European Commission 2008a) –, when key study field choices need to be made girls often end up in literary and tertiary fields yielding uncertain professional prospects, whereas boys predominantly make their way towards scientific, technical and industrial fields from which it is generally easier to find a place in the labour market. This signals a gender pattern of study choice that needs to be addressed by considering both sexes equally. The reasons why study field choices are gendered include stereotypes often found in children’s books and school manuals; gendered attitudes of teachers, gendered advice and guidance on courses to be followed; different parental expectations regarding the future of girls and boys; and so forth. As a result, some professions are thought of as feminine, others as masculine. If the aim is to change these trends and introduce more of a gender balance in all study fields, then it is with respect to the entire set of factors upstream of the study field choices that genuine theoretical and political questioning should take place, and while doing so equal attention should be given to both girls’ and boys’ choices.
In 2006, on average in the EU-27, 45% of all PhD graduates were women (Figure 2.1). However, in 11 countries, women accounted for more than half of all PhD graduates, reaching a maximum of 66% in Cyprus. Japan and Malta have particularly low proportions of women among PhD graduates, respectively 27% and 25%. With the
exception of Italy, France, Norway, Finland, Hungary, Bulgaria and Estonia, women’s under-representation among PhD graduates has been on the decline in recent years given that the compound annual growth rate of female PhD graduates has exceeded that of men in the majority of countries between 2002 and 2006 (Figure 2.2). Whereas these growth rates were fairly low (under 10%) in two thirds of the countries, they were much higher, especially for women, in Italy, Ireland, Croatia, Portugal, and Slovakia. Italy recorded an identical compound average growth rate for female and male PhD graduates, reaching 29% over the
period 2002-2006. On average in the EU-27, the number
of female PhD graduates increased at a rate of 6.8% per year compared with 3.2% for male PhD graduates. These figures clearly indicate that women are catching up with men. The strong increase in women’s educational level will result in women being at least equally or even more present than men at the PhD level in the near future.
The share of female PhD graduates varies considerably across the different fields of study. Table 2.1 shows that in 2006, on average throughout the EU-27, women PhD holders accounted for 64% of all PhD graduates in
education. A more or less balanced gender composition
40
On the contrary, the field of science, mathematics and computing and especially that of engineering, manufacturing and construction are characterised by higher numbers of male PhD holders. In the former, women constitute 41% of PhD graduates and in the latter their share drops even lower to 25%. The average figures for the EU-27 level out some very important cross-country variations. The feminisation of the field of education is most pronounced in Portugal, Slovenia and Finland where only one in four PhD graduates in this field is a man. Note that although education appears to be 100% feminised in Estonia, Cyprus, and Iceland, this is probably due to very small sample sizes of PhD graduates in this field in these countries. When comparing the degree of masculinisation of engineering, manufacturing and construction cross-nationally, it appears that less than one in five PhD holders in this field is a woman in Germany (14%), Switzerland (19%) and Japan (11%). On the contrary, in Estonia, engineering appears to be a feminised field of study, with 59% of female PhD graduates. Estonia is clearly an exceptional case. Nevertheless, the smallest relative degrees of masculinisation of this field (>35% of female PhDs) were observed in Italy, Portugal, Latvia, Lithuania, Croatia, and Turkey.
Very similar findings come out of Figure 2.3, which shows the distribution of female and male PhD holders across these broad study fields for the year 2006. On average in the EU-27, whether women or men, most PhD graduates are in the field of science, mathematics and computing (30.6% of men and 26.4% of women). The second largest share of
41
Nevertheless it should be noted that in Germany and Japan more than one quarter of male PhDs (26.8% and 30.2% respectively) are in this field. There is usually more gender balance in science, mathematics and computing and in social sciences, business and law. Across the countries, the share of female PhDs in science, mathematics and computing ranges from 9.3% in Latvia to 43.9% in France — the share recorded for Cyprus (63.2%) is probably overestimated due to the small numbers of female PhD graduates in some of the study fields. The share of male PhDs in this field varies between 6.4% in Romania and 53% in France. A few countries form exceptions to the overall picture of more balance between the proportions of male and female PhDs in the social sciences, business and law. In five countries, the proportion of female PhDs in this field was substantially larger than that of men. Indeed, the gender gap was above 5% in France, Lithuania, Finland, the UK, and the US, and reached a high of 10.1% in Austria. For the humanities and arts, the exceptional cases of Slovakia, Belgium, Lithuania Turkey, the US, and to a lesser extent Croatia, deserve special attention. In these countries the general trend was reversed and a higher share of male PhD graduates than female PhD graduates were in this field of study. Finally, agricultural and veterinary sciences and education accounted for only a small share of male and female PhD holders.
From the above it is thus clear that engineering, manufacturing and construction is one of the fields of study presenting the largest level of gender imbalance. Tables 2.2 and 2.3 allow for a more detailed analysis of this field by
insisting on movements over time. Table 2.2 shows the compound annual growth rate of the number of male and female PhD graduates within subfields of natural science and engineering. These subfields are: life science, physical science, mathematics and statistics, computing, engineering and engineering trades, manufacturing and processes and architecture and building. For each of these subfields, Table 2.3 shows the evolution in the proportion of female PhDs between 2002 and 2006. Both tables allow for similar conclusions to be drawn. First of all, in absolute terms, the highest share of female PhD holders was observed in life science (56% in 2006). Female PhDs were least well represented in computing (18% in 2006) and engineering and engineering trades (22% in 2006). The proportion of female PhDs ranged between 32% and 37% in all other subfields. Between 2002 and 2006, the proportion of female PhDs has increased the most in architecture and building (by 6%) but also in physical science (+4%), mathematics and statistics (+4%), and engineering and
engineering trades (+4%). In all fields, the number of
42
Whereas women’s presence appeared to be similar in the Government Sector and in Higher Education, it turned out considerably weaker in the Business Enterprise Sector. On average in the EU-27, women accounted for 37% of all researchers in the Higher Education Sector, 39% in the Government Sector but merely 19% in the Business Enterprise Sector in 2006. Figure 2.4 focuses on the Higher Education Sector showing the distribution of male and female researchers across the different fields of science in 2006. In the Higher Education Sector, female researchers were best represented in the medical sciences (23% on average in the EU-27) and the least present in agriculture (5% on average in the EU-27). The widest gender gap was not surprisingly observed in engineering, which hosts the largest share of male researchers (23% on average in the EU-27 in 2006) and, agriculture aside, the smallest share of female researchers (13% on average in the EU-27 in 2006). There are many cross-country differences in the relative importance of each of the fields of science. Just 4% of female researchers were in the natural sciences in Malta, compared with 35% in Cyprus. In engineering and technology, the low proportions of female researchers observed in Malta (4.5%), Austria (7.3%), Denmark (7.4%) and Cyprus (7.6%) contrast sharply with the much higher shares of women in Romania (35%), Luxembourg (28%) and Bulgaria (24%). Such contrasting national patterns characterise the medical sciences also with particularly high shares of female researchers in medicine in Malta (42%), and Denmark (42%) and particularly low shares in Estonia (9%), Latvia (8%) and Portugal (9%). Women accounted for only
1% of researchers in humanities in Romania, compared with 35% in Hungary. The lowest cross-country variation in the proportions of researchers was observed in the social sciences. Finally, agriculture generally hosts more female than male researchers but the overall share of this field in research is very small everywhere, with the exception of countries such as Romania, Slovenia and Croatia, which still count a sizeable proportion of researchers in this field. Table 2.4 completes this picture by showing the evolution of the number of female researchers in the Higher Education Sector by fields of science between 2002 and 2006. Table 2.4
shows that the compound annual growth rate of female
43
For example, in engineering and technology, the number of female researchers has increased by more than 20% annually over 2002-2006 in Denmark, Italy, and Malta and by more than 30% in Cyprus. In the natural sciences, although in absolute terms there tend to be more female researchers in this field than in engineering, the trend was much more negative. In the Czech Republic, Spain and Latvia, the number of female researchers has decreased by respectively 14.2%, 9.1% and 8.9% per year between 2002 and 2006. Negative growth rates of around 3% were also observed
over this period for Ireland (- 2.8%), Hungary
(-3.5%), Poland (-3.2%) and Croatia (-2.6%). Conversely, the number of female researchers in the natural sciences increased in the remaining countries.
Given this overall picture of positive growth in the number of female researchers between 2002 and 2006, it is not surprising that the share of female researchers has generally grown or at least stabilised in most fields of science in the Higher Education Sector between 2002 and 2006 (Table 2.5). In the social sciences, the share of female researchers has decreased in five countries (Bulgaria, the Czech Republic, Germany, Slovenia and Croatia), but remained stable or increased in the other countries. The same holds true for female researchers in agriculture (the share of female researchers decreased in the Czech Republic, Denmark, Lithuania and Slovakia, whereas it was stable or increased everywhere else) and humanities (except for Bulgaria, the Czech Republic, Italy, Latvia and Slovakia, the share of
female researchers was stable or increased between 2002 and 2006). In two fields, the recent growth in the number of female researchers is less visible through their proportions of the total number of researchers in 2006. Indeed, in the medical and natural sciences, the share of female researchers has shrunk in 7 of the 21 countries (6 of the 22 countries in natural sciences). In medicine, the largest reductions in the proportion of female researchers were noted in Ireland (-17%), Lithuania (-16%) and Slovenia (-7%). The number of female researchers in the natural sciences decreased strongly in the Czech Republic, falling by 8% between 2002 and 2006.
An analysis similar to the previous one can be carried out for the Government Sector, starting with the distribution of researchers across the different fields of science in 2006 (Figure 2.5), and then looking at their growth rates in the different fields over recent years (Table 2.6) to illustrate the way these affected their relative proportions in the different science fields (Table 2.7).
In the EU-27, women accounted for 39% of all researchers in the Government Sector in 2006.
44
Whereas in medicine the share of female researchers was 12% higher than that of male researchers, the natural sciences, even though they host one of the largest shares of female researchers, employ an even greater proportion of male researchers (37%). A very wide gender gap once again marks the research population in the field of engineering. Whereas engineering hosts a quarter of all male researchers, only 14% of female researchers were in this field (the gap stood at 11% in 2006 throughout the EU-27). As in Higher Education, female researchers are the least present in agriculture (9% on average in the EU-27) and social sciences (also 9% on average in the EU-27). There are many cross-country differences in the relative importance of each of the fields of science. Whereas just 7% of female researchers were in natural sciences in Malta, 46% were in Bulgaria. In engineering and technology, the low proportions of female researchers observed in Estonia (5%), Slovenia (5%), Latvia (4%), Cyprus (3%) and Croatia (1%) contrast sharply with the much higher shares of women in Belgium (44%), Turkey (34%), Luxembourg (28%), and Romania (26%). Such contrasting national patterns characterise the medical sciences also with particularly high shares of female researchers in medicine in Spain (58%) and Portugal (48%) and particularly low shares in Lithuania (1%), Belgium (3%), Cyprus (5%) and Turkey (5%). The share of female researchers in humanities was the lowest in Luxembourg (3%), whereas it peaked at 46% in Estonia. Whereas there was the least cross-country variation in the proportions of researchers in the social sciences in the
Higher Education Sector, in the Government Sector, this fails to hold true. Indeed, the proportion of female researchers ranges from 2% in Turkey to 50% in Malta. Finally, the field of agriculture represents only a small part of research in general, with the exception of countries such as Ireland, Malta, and Turkey.
Tables 2.6 and 2.7 complete this picture by informing on the evolution of the number of female researchers in the Government Sector by fields of science between 2002 and
2006. Table 2.6 shows that the compound annual growth
45
Only in seven countries has the number of female researchers actually dropped in this field between 2002 and
2006: Malta (-100%), Cyprus ( 12%), the Czech Republic
(-4%), Poland (-3%), Slovenia (-3%), Denmark (-1%) and Norway (-1%). In the medical sciences, the trend is rather similar with very high growth rates in the number of female researchers in some countries (+73% in Latvia, +45% in Turkey, +25% in Italy, +22% in Denmark and Norway, and +21% in Spain) and very negative figures in others (-16% in Slovenia, -14% in Lithuania, and -9% in Austria).
As in Higher Education, this trend of overall growth in the number of female researchers between 2002 and 2006 has translated into a growth or at least stabilisation of their relative proportions in most fields of science in the Government Sector (Table 2.7). It is least felt in the fields of the humanities and the social sciences. Indeed, of the 22 countries for which the data allow for a 2002-2006 comparison, 12 countries reported a decrease in the share of female researchers in the field of humanities (of up to -19% in Latvia and -12% in Slovakia) and 9 countries reported a decrease in social sciences (of up to -13% in Latvia and -10% in Portugal). On the contrary, in engineering and technology and in the natural sciences, only five countries reported a decrease in the proportion of female researchers. In the natural sciences the largest decrease was noted in Ireland, where the share of female researchers in this field dropped by 11%. In engineering and technology, reductions of respectively 6% and 7% marked the shares of female researchers in Latvia and Slovenia.
In medicine, seven countries reported reductions in the proportion of their female research population, especially Latvia (-8%). Finally, the proportion of female researchers in agriculture increased in most countries, six exceptions aside. Only in Romania was the reduction in the share of female researchers considerable, as it dropped from 43% in 2002 to 26% in 2006.