Open Access
Review
Statics and dynamics of malaria infection in Anopheles mosquitoes
David L Smith*
†and F Ellis McKenzie
†Address: Building 16, Fogarty International Center, National Institutes of Health, Bethesda, MD 20892, USA
Email: David L Smith* - smitdave@helix.nih.gov; F Ellis McKenzie - mckenzel@mail.nih.gov * Corresponding author †Equal contributors
Abstract
The classic formulae in malaria epidemiology are reviewed that relate entomological parameters to malaria transmission, including mosquito survivorship and age-at-infection, the stability index (S), the human blood index (HBI), proportion of infected mosquitoes, the sporozoite rate, the entomological inoculation rate (EIR), vectorial capacity (C) and the basic reproductive number (R0).
The synthesis emphasizes the relationships among classic formulae and reformulates a simple dynamic model for the proportion of infected humans. The classic formulae are related to formulae from cyclical feeding models, and some inconsistencies are noted. The classic formulae are used to to illustrate how malaria control reduces malaria transmission and show that increased mosquito mortality has an effect even larger than was proposed by Macdonald in the 1950's.
Review
Mathematical models have played an important role in understanding the epidemiology of malaria and other infectious diseases [1-3]. Models provide concise quanti-tative descriptions of complicated, non-linear processes, and a method for relating the process of infection in indi-viduals to the incidence of infection or disease in a popu-lation over time. Important insights have come from dynamic and static analysis of these models [4,5]. Dynamic analysis focuses on changes in the incidence or prevalence of an infectious disease in a population over time. Statics involve populations at a steady state. Dynamic epidemic processes leave a signature in a popu-lation that can be examined statically, often from static analyses of age-specific patterns in epidemiological status, based on an appropriate cross-section of the population at a point in time – a snapshot of a population, stratified by age provides information about its historical dynamics [4,5]. The assumption that a population is at dynamic equilibrium and has a stationary age distribution is fre-quently violated in practice, but it provides a useful start-ing point for more sophisticated analysis. Combinstart-ing
mathematical modelling with statistical analysis allows the use of static patterns to understand dynamics; basic epidemiological parameters can be estimated in the absence of many years of time series data. The
relation-ship between the statics and dynamics of Plasmodium
infections in female Anopheles mosquitoes has been a
focal point in classic studies of malaria transmission [2]. For mosquitoes, it is easier to measure parity, the repro-ductive age of the adult mosquito, than the chronological age of the mosquito, the time since adult emergence [6,7].
Saul et al. reformulated classic models for static
age-infec-tion relaage-infec-tionships as cyclical feeding models; i.e. the mod-els were formulated in terms of parity. They used the models to analyse mosquito statics, derive a formulae for the sporozoite rate, and define individual vectorial
capac-ity [8]. Killeen et al. followed a similar line of thinking and
estimated the entomological inoculation rate (EIR) from
studies of mosquito populations [9]. Both models use the gonotrophic cycle of the mosquito to mark time, but the underlying assumptions about mosquito populations are essentially identical to those of Ross and Macdonald [1,2].
Published: 04 June 2004
Malaria Journal 2004, 3:13 doi:10.1186/1475-2875-3-13
Received: 11 March 2004 Accepted: 04 June 2004
This article is available from: http://www.malariajournal.com/content/3/1/13
The parallel approaches have led to a proliferation of formulae.
In this paper, the classic formulae in malaria are reviewed and re-derived including explicit and simple formulae for
the statics of Plasmodium infection in mosquitoes such as
mosquito survivorship, the human blood index (HBI), the stability index (S), the proportion of mosquitoes that
are infected (i.e. a mosquito with detectable Plasmodium),
and the proportion of mosquitoes that are infectious (i.e. the sporozoite rate). These quantities are related to trans-mission through EIR, vectorial capacity, and the basic
reproductive number, R0. Next, simple dynamic models
are formulated that are slightly different from the classic formulations; these modified equations are consistent with the statics of infection. The focus is on the role of mosquitoes in malaria transmission; for human infec-tions, the equations use simple assumption of Ross, ignor-ing super-infection and immunity [1,2,10]. Super-infection and immunity have been reviewed in greater depth by others [11,12]. Seven independent quantities must be estimated for a simple malaria transmission model. Of these, five can be estimated from mosquito statics. Finally, the classic malaria models are related directly to cyclical feeding models.
Statics of mosquito infections
As in the models used to derive the classic formulae in malaria epidemiology, the following derivations assume that mosquito populations are homogeneous, ignore mosquito senescence, and assume that adult mosquito population size is constant. Moreover, the formulae assume that mosquitoes bite humans at random and uni-formly. Also, the formulae assume that an infected mos-quito never becomes uninfected, and so focus on the initial infection. These assumptions, which are called the classic assumptions, are useful approximations or ideali-zations that form a starting point for more complicated analysis. The classic assumptions are frequently violated in real mosquito populations. For example, mosquito density fluctuates seasonally; emergence and survivorship may depend on environmental factors, such as rainfall, temperature and humidity. Adult mosquitoes may senesce, or there may be intrinsic differences in mortality rates, called demographic frailty. Mosquitoes bite some people more than others [13], either due to inherent mos-quito preferences [14] or proximity to larval habitat [15-18].
Survivorship & Lifespan
The classic models make simple assumptions about mos-quito survivorship, a term from demography that is defined as the proportion of individuals from a cohort that surviving to a given age, and typically presented as a
survivorship curve. Let g denote the "force of mortality,"
the per-capita daily death rate of a mosquito. The assump-tion that survivorship is constant over the mosquito lifespan implies an exponential distribution of survival times (i.e. a hazard model). The proportion of a cohort of
mosquitoes that survives to age A is
λ(A) = e-gA. (1)
Thus, the probability that an individual mosquito survives
one day is p = e-g, or equivalently g = - ln p. The median
sur-vival time (i.e. population half-life) is ln 2/g. In general,
the proportion of mosquitoes that dies at age A is gλ(A),
and the average lifespan of a mosquito is:
Put another way, if g is the force of mortality, then 1/g is
the average mosquito lifespan, or the expected waiting time to death. Mosquito lifespan is one component of the lifetime transmission potential of an individual mos-quito; human feeding rate is the other.
Human Feeding, Stability Index & HBI
How many bites on a human will a mosquito take during
its lifetime? Let f denote the mosquito feeding rate; the
interval between blood meals is assumed to be equivalent to the time interval between successive ovipositions,
denoted 1/f. Further, let Q denote the proportion of bites
that are taken on humans, a parameter that can be esti-mated from the proportion of mosquitoes that have ever
fed on a human, called the human blood index, HBI. The
human feeding rate, a is the expected number of bites on
humans per mosquito, per day; a = Qf. Since a mosquito
lives 1/g days and bites a human once every a days, a
mos-quito bites humans
times over the course of its lifetime; S is called the "stabil-ity index" [2,19]. By assumption, the life expectancy of a mosquito that has already lived 10 days is exactly the
same as a recently emerged mosquito, 1/g days. Thus, S is
also the number of bites given by a mosquito after it has become infectious. The expected number would be lower in a population with senescence and higher in a popula-tion with demographic frailty.
What fraction of mosquitoes of age A have bitten a
human? A mosquito of age A is expected to have given f A
bites, of which a A = fQA are on humans. Following a
cohort of recently emerged mosquitoes over time, the
pro-portion of a surviving mosquitoes of age A that has ever
bitten a human is:
gAλ
( )
A dA= g( )
∞
∫
0 1/ . 2S a
g
η(A) = 1-e-aA. (4)
The proportion of mosquitoes in a population that has
survived to age A and bitten a human is η(A)λ(A), and
HBI is:
Note that the proportion of fed mosquitoes f/(f + g), can
be derived in a similar way, assuming a = f. Thus, the HBI
is a simple function of the mosquito lifespan and the human feeding rate. It can be understood as a ratio of two waiting times: the waiting time to either the first human
bite or death 1/(a + g) and the waiting time to the first
human bite among surviving mosquitoes (1/a).
Proportion of Infected Mosquitoes
What is the probability that a mosquito becomes infected over the course of its lifetime? Infected mosquitoes, in this case, are those with any of the parasite developmental stages, e.g. oocysts or sporozoites. Mosquitoes become
infected upon biting an infectious human. Let X denote
the proportion of humans who are infectious, and since
this is a static analysis, X is assumed to remain constant.
Let c denote the transmission efficiency from an infectious
human to an uninfected mosquito; in other words, c is the
probability that an uninfected mosquito becomes infected after biting an infectious human. Thus,
mosqui-toes become infected at the rate acX. Following a cohort of
recently emerged mosquitoes over time, the proportion of
surviving mosquitoes of age A that have ever become
infected is:
v(A) = 1 - e-acXA. (6)
The proportion of the original mosquito cohort that is
alive and infected at age A is v(A)λ(A), and the proportion
of infected mosquitoes, Y, is:
Thus the proportion of infected mosquitoes is a ratio of two waiting times: the waiting time to either death or
infection, 1/(g + acX), and the waiting time to infection
among surviving mosquitoes 1/(acX).
Proportion of Infectious Mosquitoes
What is the probability that a mosquito survives to become infectious? Infectious is defined as a mosquito
has sporozoites in its salivary glands. Let n denote the
length of the incubation period, from ingestion of game-tocytes to becoming infectious, called the entomological incubation period. That is, only mosquitoes that have
sur-vived at least n days could be infectious; the probability of
surviving n days is Pe = e-gn.
What is the probability that a mosquito becomes infec-tious over the course of its lifetime? The proportion of
mosquitoes of age A that are infectious is:
The proportion of a mosquito cohort that is alive and
infectious at age A is µ (A)λ(A). Thus, the proportion of
mosquitoes that are infectious, Z, (also called the
"sporo-zoite rate"), or, equivalently, the probability that an indi-vidual mosquito ever becomes infectious, is:
This expression is similar to the one given by Macdonald;
they are identical if c = 1 (see page v, formula (7) in [2]).
Note that it is simply the product of the probabilities of ever becoming infected and, then, surviving the
incuba-tion period, Z = YPe.
Lifetime Transmission Potential
The lifetime transmission potential of a mosquito is defined as the expected number of new infections that
would be generated by a newly emerged adult. Let b
denote the transmission efficiency from an infectious mosquito to an uninfected, susceptible human; in other
words, b is the probability that an uninfected human
becomes infected after being bitten by an infectious mos-quito. The expected reproductive output of a cohort of
mosquitoes at age A is baµ(A)λ(A). Lifetime transmission
potential, denoted β, is integrated over a mosquito
lifetime:
Thus, lifetime transmission potential is the product of the
probability that a mosquito becomes infected, Y, the
probability that an infected mosquito survives to become
infectious, Pe, transmission efficiency, b, and the stability
index, S.
Lifetime transmission potential for a mosquito is a func-tion of the proporfunc-tion of a human populafunc-tion that is
infectious, X, as well as the other parameters. The curve β
(X,...) is concave down, with initial slope
η A λ A dA λ A dA a
a g
( ) ( )
( )
=+
( )
∞ ∞
∫
∫
/ . 50 0
v A A dA A dA acX
g acX
( ) ( )
( )
=+
( )
∞ ∞
∫
∫
λ / λ . 70 0
µ A
A n
e acX A n A n
( )
= ≤− >
− ( − )
( )
0
1 . 8
µ A λ A dA λ A dA acX
g acXe
n
gn
( ) ( )
( )
=+
( )
∞
∞ −
∫
∫
/ .0 9
β = µ
( ) ( )
λ = +(
)
( )
− ∞
∫
ba A A dA a bcXeg g acX gn 2
Thus, VX ≈β(X); the two differ by the factor (1 + acX/g)-1
[= g/(g + acX)]. Note that it is the product of three
quanti-ties: the square of the stability index, S2, the net
transmis-sion efficiency bc, and the probability of surviving the
incubation period Pe. Stability index is squared because
transmission requires at least two bites, one for infection and one to transmit.
The formula V describes the total contribution to vectorial
capacity of a single mosquito over its lifetime, and it is used to estimate the critical mosquito density (see below). Note that Saul, et al. [8] define a closely related formula called individual vectorial capacity (IC):
IC is defined as the expected number of infectious bites from a single vector after feeding on an infectious host. It is the product of three quantities: the probability that a
vector becomes infected by that bite (probability c), the
probability that it survives the incubation period, Pe, and
the stability index, S. Thus, V counts infectious bites that
would result in an infection, while IC counts only
infec-tious bites; V begins counting when an adult mosquito
emerges, while IC begins counting after a mosquito has
bitten an infectious human.
EIR & Vectorial Capacity
EIR depends on the statics of a mosquito population as well as the density of mosquitoes. By definition, EIR is the number of infectious bites received per day by a human, or equivalently, the human biting rate multiplied by the sporozoite rate. If mosquitoes emerge at the constant rate
εper human per day, then the equilibrium mosquito
den-sity per human is m = ε/g.
EIR can be written in several equivalent ways. First, EIR =
maZ = εSZ; Z is the sporozoite rate, the proportion of
infectious mosquitoes, and ma = εS is called the human
biting rate (HBR), the number of bites per human per day, the product of the the density of mosquitoes per human, and the human feeding rate. (Note that "human feeding rate" counts the number of bites on a human, per mosqui-toes, per day, while "human biting rate" counts bites on humans, per human, per day.) Next, EIR can be rewritten in terms of the lifetime transmission potential of a mos-quito – a population of humans would receive the same number of infectious bites if each emerging mosquito delivered all of its infectious bites upon emergence and
promptly died [9]; thus EIR = εβ= mgβ. Finally, EIR can be
rewritten in terms of the basic parameters. Thus,
(Again Macdonald gives a nearly identical expression,
set-ting c = 1: see page v, formula (9) in [2]). Note that any
one of these formulae for EIR is correct and could be
gen-erated from an understanding of the underlying entomo-logical parameters.
Note that EIR, like the sporozoite rate, is a function of the proportion of humans who are infectious. In contrast, vectorial capacity, C, describes the transmission potential
of a mosquito population in the absence of Plasmodium
[20]. Vectorial capacity is the expected number of humans infected per infected human, per day, assuming perfect
transmission efficiency (i.e. b = c = 1):
Many authors use an alternative definition for vectorial
capacity, cC, the number of infectious bites that originate
from all the bites on a single infected human in a day [21]. Note that vectorial capacity is not a function of the sporo-zoite rate, or of the proportion of humans who are
infec-tious, X. Thus, vectorial capacity is independent of X while
EIR is dependent on X. In other words EIR does not
pro-vide an independent estimate of the proportion of humans who are infected (the "parasite rate") because its calculation requires information about the proportion of
humans who are infectious. EIR gives an estimate at a
sin-gle point in time of the waiting time to the next infectious
bite. Note that EIR and vectorial capacity are closely
related, since EIR can be regarded as a function of X, and:
Moreover,
That is, vectorial capacity (multiplied by the transmission
efficiency c) gives the slope of the relationship between
EIR and the prevalence of infection in humans when
malaria is virtually absent: cCX ≈EIR when X is small; the
approximation cCX is always larger than EIR by the factor
(1 + acX/g)-1. Finally, note that the "force of infection" is
bEIR; some infectious bites fail to produce an infection.
V a bce g
X X gn
X
= = ∂
(
)
∂
( )
−
=
2 2
0
11
β ,... .
IC ace g
gn
= − .
( )
12EIR maZ ma cXe
g acX gn
= = =
+
( )
−
εβ 2 . 13
C ma e g
ma p p
gn n
= =
−
( )
−
2 2
14 ln .
EIR cCX
acX g
=
+
( )
1
1 / . 15
cC EIR X X
X
= ∂
(
)
∂ =
( )
,... . 0
Thus, EIR is only proportional to the rate that new
infections occur. Thus, bEIR is the inverse of the expected
waiting time to infection for uninfected individuals, or in a population not at steady state, the best estimate at a point in time.
Note that vectorial capacity can be rewritten as the prod-uct of the scaled mosquito emergence rate, the stability index squared, and the probability of surviving the infec-tious period:
C = εS2P
e. (17)
Note the parallels between formulae summarizing
ento-mological aspects of transmission. For example, εV = bcC
and εβ= bEIR. The formulae V and βdescribe
transmis-sion rates per mosquito over a lifetime, while cC and EIR
describe the number of infectious bites per human. Also,
VX ≈βand bcCX ≈bEIR. Thus, V and bcC measure
trans-mission when X ≈ 0 while βand EIR describe transmission
(statically) as a function of X.
Dynamics & control
Having described the statics of mosquito populations and defined the parameters (see Table 1) an equation for the population dynamics of malaria infection in mosquito populations is the following:
= acX (e-gn - Z) - gZ. (18)
This equation ignores the time lag introduced by incuba-tion (parasite development from ingested gametocytes to salivary-gland sporozoites) but incorporates mosquito mortality during this period. Uninfected mosquitoes
become infected at the rate acX, but only the portion that
would survive the infectious period, e-gn, become
infec-tious. This model differs slightly from others (see
Appen-dix 1). The equation gives a correct formulation for R0,
and the proportion of infectious mosquitoes is correct; at
equilibrium (setting = 0, and solving for Z) Eq. 8 is
recaptured.
The dynamical model is completed using the classic assumptions about the epidemiology of malaria in
humans. Let r denote the recovery rate for humans; this is
equivalent to assuming that humans remain infectious for
1/r days after initially becoming infectious, regardless of
super-infection and the effects of acquired immunity [10-12,22]. The change in the proportion of infectious humans is described by:
= mabZ(1-X)-rX (19)
This equation ignores the time lag necessary for parasite development from inoculated sporozoites to circulating gametocytes, and human mortality that would occur dur-ing this period.
Mosquitoes play a critical role in the life cycle of
Plasmo-dium, but mosquito populations have a relatively rapid
turnover. For example, the incubation period in mosqui-toes is ignored (1–2 weeks); so is the longer delay in humans (2–3 weeks). Mosquitoes complete a generation during the delay in humans, and, as a consequence, the proportion of mosquitoes that are infectious changes rap-idly in response to changes in the proportion of humans that are infectious. Thus, ignoring the time lags, the expression for EIR can be substituted into Eq. 13, to derive a single equation for the dynamics of the proportion of humans that are infectious:
This equation de-emphasizes mosquitoes, per se, by
reduc-ing their role to a sreduc-ingle function describreduc-ing transmission. A simpler equation can be derived using the
approxima-tion: bEIR ≈bcCX:
= bcCX(l-X)-rX (21)
A similar equation, omitting b, was discussed by Dye and
Williams [21]. The equation gives a biased estimate for the proportion of humans at equilibrium who are infectious,
Table 1: The classic parameters. A minimal set of parameters for simple malaria models, following notation commonly used by malariologists. The main exception is mosquito lifespan 1/g; the more common alternative is to replace mosquito lifespan with the daily mosquito survival probability, g = -inp.
m Ratio of mosquitoes to humans
a Human feeding rate (# bites on a human, per mosquito, per day) 1/g Average mosquito life-span, (days)
n Incubation period (days)
c Transmission efficiency: infected human to mosquito b Transmission efficiency: infected mosquito to human 1/r Human infectious period (days)
Z
Z
X
X ma bce
g acX X X rX
gn
=
+
(
−)
−( )
−
2
1 20
since bcCX overestimates bEIR by the factor (1 + acX/g)-1. The bias introduced by using vectorial capacity must be weighed against the added mathematical simplicity of the model. In line with the premise that "all models are wrong, but some are useful," [23] the choice of equation 20, 21, or some other model should depend on how the model is to be used.
In short, the role of mosquitoes in transmitting human malaria can be reduced to a simple functional relation-ship describing transmission intensity, with parameters that can be estimated from studying the statics of mos-quito populations.
Threshold Criteria
The basic reproductive number, R0, provides a threshold
criterion. Conceptually, R0 was defined as the expected
number of infected humans per infected human, or the number of infected mosquitoes per infected mosquito.
The basic reproductive number, R0 is derived from the
coupled
Eqs. (18,19):
(using the "next generation" matrix, this expression is
called (R0)2, see [24,25].) Note that R
0 computed from
either Eq. 20 or Eq. 21 is identical to 22. This formula
dif-fers from more traditional expressions for R0 by including
the transmission-efficiency parameter c. For example,
Macdonald derives what is otherwise the same expression
(his expression for z0 is identical if c = 1: page viii, formula
(21) in [2]); his formula is widely used (e.g. see [26]).
The threshold can be expressed in various ways that are entomologically and epidemiologically meaningful. Since the basic number is relevant exactly when malaria is
absent (i.e. X ≈ 0) thresholds can also be expressed in
terms of the basic reproductive number, vectorial capac-ity, or the transmission potential of an individual mosquito:
R0 = bcC/r = εV/r = mgV/r > 1. (23)
Rearranging, the threshold can be rewritten as bcC >r;
malaria can invade if people can become infected faster than they can recover. How many mosquitoes must be present to sustain an epidemic? The answer is given in
terms of scaled emergence, ε>r/V or scaled mosquito
den-sity, m >r/(gV). Macdonald called this the critical density
of mosquitoes ([2]).
Proportion of Infected Humans
The equations can be used to derive the static relation-ships for the proportion of infected humans. Using equa-tion 20, the prevalence of infecequa-tion in humans at
equilibrium, denoted , can be written as a function of
EIR, C, or R0:
The shape of these curves is illustrated in Figure 2. Note that each of these curves is concave down (i.e. the second derivative is negative, and the curve would shed water like
an umbrella not hold it like a cup) and asymptotes at
= 1 for high EIR (or C or R0). The relationship between
vectorial capacity or the basic reproductive number is
more complicated: = 0 unless bC >r or R0 > 1. When the
force of infection exactly balances the rate of recovery (bEIR = r), exactly half of the human population is infected. In other contexts, this point is called a half-satu-ration constant, and it determines the shape of the curve.
Malaria Control
The classic formulae provide quantitative insights into the entomological aspects of malaria transmission relevant to malaria control. The most critical insights come directly
from the formula for R0, that is rewritten using scaled
mosquito emergence:
Reductions in mosquito emergence, from εto , or in the
duration of the human infectious period, from 1/r to 1/ ,
have linearly proportional effects on transmission. That is,
if the change is expressed relative to the baseline, θ= ε/
or φ = /r, R0 is reduced by the factor θ or φ (e.g θ = 2
would imply that mosquito emergence had been cut in
half). Reductions in the human feeding rate from a to
have quadratic effects: if ψ= a/ , R0 is reduced by the
fac-tor ψ2.
Increases in mosquito mortality from a baseline value of g
to a post-control value of have three effects. First,
mos-quito density is reduced to from ε/g to ε/ , a factor of g/
(Macdonald ignored this effect [2]). Second, the prob-ability of surviving the incubation period is reduced from
e-gn to , a factor of . Third, the number of
bites per infectious mosquito is reduced from a/g to a/ ,
R ma bce rg
ma bcp
r p
gn n
0
2 2
22
= =
−
(
)
( )
−
ln
X
X bEIR
bEIR r
bC r bC ra g
R R ac g
=
+ =
−
+ =
−
+
( )
/ /
0
0 1
24
X
X
R a bce
g r gn
0 2
2 25
=ε −
( )
ˆ
ε
ˆ
r
ˆ
ε
ˆ
r
ˆ
a
ˆ
a
ˆ
g
ˆ
g
ˆ
g
e−gnˆ e
(
g g/ −1)
gnˆ
an additional factor of g/ . Thus, if mortality is increased
from the baseline value by a factor ζ= g/ , R0 is reduced
by the total factor egn(ζ-1)/ζ2. The longer the incubation
period, the larger the effect. If the incubation period is
roughly equal to the average mosquito lifespan (i.e. gn ≈
1), and adult mortality is doubled, the reduction in R0 is
22e, a factor of about 11; tripling adult mortality would
reduce R0 by a factor 32e2 ≈ 67! Single control measures
often affect more than one aspect of malaria transmission, as does integrated malaria control. The important point, long understood but often forgotten, is that the benefits are multiplicative. For example, a net reduction of 50% in
mosquito emergence (θ= 2) combined with a doubling in
adult mortality (ζ≈ 2, again assuming gn ≈ 1) reduces R0
by a factor of θζ2e ≈ 22. A more ambitious programme
that doubled adult mortality, ζ≈ 2, reduced emergence by
90%, θ≈ 10, delayed biting by 25%, ψ= 4/3, and reduced
the human infectious period by 90% through mass drug
administration, φ = 10, would reduce R0 by a factor of
φθψ2ζ2e ≈ 1, 932. If such results could be achieved
glo-bally, malaria would be eradicated.
Vectorial capacity is far removed from the costs and bene-fits of actual control programmes, but the analysis sug-gests that mortality of adult mosquitoes is particularly sensitive to control. Also, since the benefits are multiplica-tive, integrated malaria control may be the most effective means of control over the long-run.
Parameter estimation
Malaria surveillance requires seven parameters for the simplest models of malaria transmission (see Table 1). Assuming that human population density is well-charac-terized, it is necessary to know the density of mosquitoes, the human feeding rate (a), the average mosquito lifespan
(1/g), the length of the incubation period (n), the
trans-mission efficiencies (b and c), and the average human
infectious period (1/r). Many of these parameters are
dif-ficult to estimate directly, but indirect parameter estimates can often be calculated from estimates of independent quantities that are measured directly. For example, mos-quito lifespan in a constant population can be estimated in several ways [6,19,27]. Once mosquito lifespan has been estimated, human feeding rate can be calculated from an estimate of the human blood index (Eq. 5). Once
g and a are known, cX can be estimated from the
propor-tion of mosquitoes that are infected (Eq. 7). Next, the Classic relationships between EIR or R0 and the proportion of humans with parasitemia
Figure 2
Classic relationships between EIR or R0 and the proportion of humans with parasitemia. The relationship between EIR and the proportion of infectious humans, , is plotted to illustrate the shape of the curve, assuming a human infectious period of 100 days (r = 0.01) and transmission efficiency to humans of 50% (b = 0.5). At this rate, 50% of the human population
is infectious with a yearly EIR of 7.3 infectious bites. The relationship between R0 and the proportion of infectious humans, , is also plotted assuming a human feeding rate of 3 human bites every ten days (a = 0.3), a transmission efficiency to mosquitoes
of 50% (c = 0.5), and an average mosquito lifespan of about 10 days (g = 0.1). Note that = 0 unless R0 > 1.
0 20 40 60
0.0
0.4
0.8
Entomological Inoculation Rate
Yearly EIR
X
0 5 10 15 20
0.0
0.4
0.8
Basic Reproductive Number
R0
X
X
X
X
ˆ
g
ˆ
incubation period (n) can be calculated from an estimate of the sporozoite rate (Eq. 8; also see page xvi, formula 69 in [2]). Transmission efficiencies are difficult to estimate independently, but an estimate of the proportion of
humans with circulating gametocytes, X, would provide
an independent estimate of c. Some of these parameters
may be relatively constant for vector species; were this true, those values would need to be estimated just once, reducing the effective number of parameters to be esti-mated thereafter.
Other shortcuts may exist. Depending on the purpose of a
study, for instance, it may be sufficient to estimate cX
without knowing c [8]. The "gold standard" method for
estimating EIR involves estimating two quantities directly, the human landing rate (approximately equal to the
human biting rate, ma) and the sporozoite rate (Z), but in
this case the extrapolation of such estimates to other places or times may be of limited utility.
An alternative is detailed study of mosquito populations. In practice, it is more difficult to measure the chronologi-cal age of a mosquito than its parity, the number of ovipo-sitions it has completed [6,7]. An explicit method for relating transmission parameters to mosquito statics in cyclical feeding models is given by Saul et al. [8]. Thus, cyclical feeding models have been formulated in terms of the reproductive age of the mosquito [8,9].
Parameter values from cyclical feeding models have a one-to-one mapping onto parameters for models formulated in continuous time, assuming a mosquito of
chronologi-cal age A has reproductive age τ= A/f. In particular, Pf = e
-g/f is the probability a mosquito survives exactly one
feed-ing cycle. Thus, cyclical feedfeed-ing models and the classic models can be compared directly by rescaling time and
plotting λ(τ) and µ(τ) for τ= 0,1, 2, 3,... (see Figure 1 and
Appendix 2). The chronological age of a mosquito with
parity τdepends on time required to find hosts and
suc-cessfully feed as well as the time required to find oviposi-tion sites and successfully oviposit. Thus, cyclical feeding models and the classic models are both approximations of a more complicated reality.
Conclusions
Classic formulae for the entomological inoculation rate,
basic reproductive number R0, vectorial capacity, and
prevalence of infection in humans (the proportion of humans who are infected, or parasite rate) are usually based on the same simplifying assumptions, whether they are formulated as cyclical feeding models or as dynamical equations. The classic assumptions and corresponding models provide a starting point for quantifying malaria transmission and for relating static and dynamic aspects of malaria infection in humans and mosquitoes. They
should be regarded as idealizations, serving a purpose similar to that of the Hardy-Weinberg equations in popu-lation genetics. The underlying epidemiology of malaria is, of course, more complicated.
The logic of modelling is a priori, from putative cause to
effect; the formulae would be correct provided the under-lying assumptions were reasonably good approximations to reality and the parameters could be estimated without introducing too much bias [28]. Discrepancies in the
actual relationship between EIR (or R0 or vectorial
capacity) and the prevalence of infection in humans could be due to sampling error, measurement error, variability in mosquito populations, human immunity, super-infec-tion, heterogeneity in human or mosquito populations, or something else. Discrepancies are not reasons to reject mathematical models; if it is important to have some quantitative understanding of malaria transmission, mathematical models are necessary. Instead, discrepan-cies between model predictions and reality point out shortcomings in the theory; some of the assumptions are unrealistic for a particular population at a particular time, but which ones? Model building and model selection integrated with field studies will produce models with the appropriate level of complexity.
Which important factors have been omitted from malaria models that must be included? The models of Ross and Macdonald have not performed well in places where malaria is endemic [22]. Ross-Macdonald models may perform well for analyzing thresholds, but these models assume that human biting is evenly distributed. In reality, mosquitoes bite some humans more than others because they are more attractive [14], or live close to larval habitat [17,18] which has a surprisingly large impact on the basic reproductive number [13,29]. Mosquito survivorship, adult emergence rate, feeding rate, and parasite sporogony may vary with temperature, humidity and rainfall, gener-ating wide fluctuations in the density of mosquitoes, pro-portion of infectious mosquitoes, and EIR. Mosquito populations may senesce or be subject to demographic frailty. The problems of estimating survivorship in a changing population with frailty, senescence, and migra-tion may be intractable. These problems with parameter estimation are still more complicated when several vector species contribute to malaria transmission in an area.
Understanding malaria control through R0 or vectorial
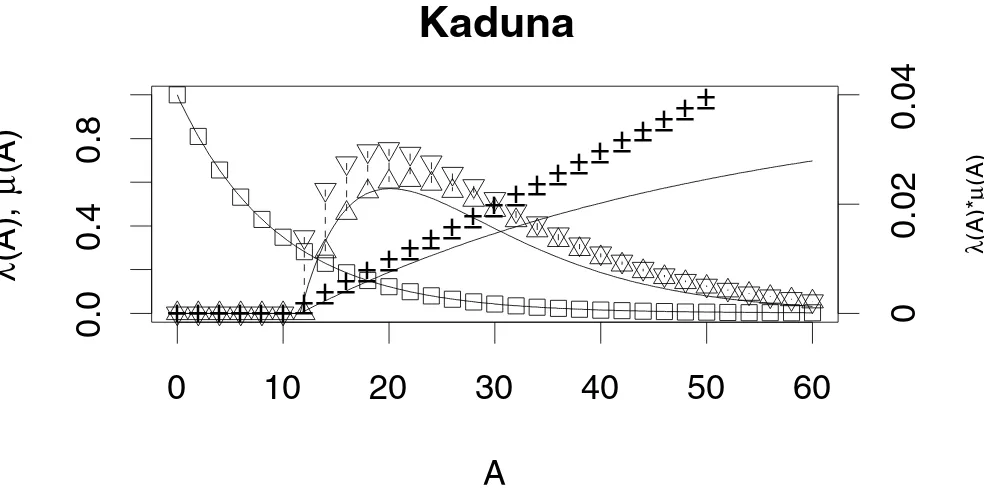
Mosquito survivorship and age-at-infection Figure 1
Mosquito survivorship and age-at-infection. Using parameter values from Killeen, et al., (1999), mosquito survivorship λ(A) is plotted from Equation 1 (squares), the proportion of surviving mosquitoes that are infectious, µ(A) from Equation 2 (diamonds), and the proportion of the original cohort that is alive and infectious λ(A)µ(A) ((triangles) note the units are given on a separate axis). The corresponding values from a cyclical feeding model are plotted, assuming that a mosquito with parity τ has chronological age A/f. The discrepancies between this algorithm and the one used by Killeen, et al. are explained in Appen-dix 2.
0 20 40 60 80
0.0
0.4
0.8
Kankiya
A
λ
(A),
µ
(A)
0
0.02
0.04
λ
(A)*
µ
(A)
0 10 20 30 40 50 60
0.0
0.4
0.8
Kaduna
A
λ
(A),
µ
(A)
0
0.02
0.04
λ
(A)*
µ
(A)
0 10 20 30 40
0.0
0.4
0.8
Namawala
A
λ
(A),
µ
(A)
0
0.0025
0.005
λ
(A)*
µ
(A)
0 10 20 30 40 50
0.0
0.4
0.8
Butelgut
A
λ
(A),
µ
(A)
0
0.01
0.02
λ
(A)*
µ
may be particularly effective since the benefits are multi-plicative. On the other hand, there may be practical limits on increasing mosquito mortality, and benefits may not increase linearly with expenditures. In other words, while the enormous potential benefits of increased adult mor-tality argue that insecticide-impregnated bed-nets and residual indoor spraying should always be considered, there may be constraints. Indeed, the global DDT-based campaign failed to eradicate malaria due, in part, to the evolution of insecticide resistance and avoidance. Since adult mosquitoes fly long distances but larval habitat is fixed, larval control might be more effective in relative terms; the relative benefits would vary with the larval ecol-ogy of the vectors [30]. Furthermore, optimal allocation in integrated malaria control may require a strategy that changes allocations over time. Environmental engineer-ing approaches to larval control may require high initial investments but relatively low-cost maintenance, for example; long-term reductions in adult emergence multi-ply any subsequent benefits of other measures.
The classic formulae for the stability index, R0, C, and EIR
were instrumental in shaping and guiding the DDT-based campaigns to eradicate malaria. Although global eradica-tion failed, in many places the programmes succeeded in substantially reducing mortality and morbidity by reduc-ing transmission. Current malaria control programmes do not explicitly aim to eradicate malaria or even reduce
transmission, per se, but these formulae can provide a
sound basis for understanding the transmission effects of current control measures, such as insecticide treated bed-nets and anti-malarial drugs. On the other hand, critical issues for current malaria control policy revolve around the relationship between transmission intensity and human infection, morbidity and immunity [31]. Trans-mission models may not provide the insights necessary to manage disease, especially when most people receive many infectious bites per day [22]. For disease-focused management programmes such as Roll-Back Malaria, new mathematical models relating transmission, immunity and superinfection to disease are needed [32].
Before measuring any aspect of malaria, it is important to decide why malaria is being measured. Malaria control may require data to estimate relative reductions in mos-quito mortality, emergence, or human biting. In such cases, it is more important to have several consistent esti-mates of epidemiological parameters. For example, light-trap data to monitor mosquito density at the same place every week would be much more useful for understanding malaria epidemiology than would point estimates of EIR from human landing catches made once a year, even if the "gold standard" provides a more accurate estimate of human biting rate.
Mathematical models should never be confused with truth. They are useful approximations. The classic formu-lae in malaria epidemiology are a starting point. Reality is always more complicated, and so malaria epidemiology will always involve some approximation, and parameter estimation will always involve some degree of error and bias. Approximation, error, and bias do not, by them-selves, invalidate the utility of an estimate as long as the scientist understands the nature of the problems. The question for malaria epidemiology is not whether the classic formulae are wrong, but what to do next. The answer should depend on the goals of local malaria control.
Appendix 1
The equation for the proportion of infectious mosquitoes provided by Anderson and May (compare with formula 14.3 in [4]) ignores the incubation period:
In their equation is presented as "the proportion of bites by susceptible mosquitoes on infected people that produce a patent infection." This is interpreted to mean that is the product of probability that a mosquito
sur-vives the incubation period, e-gn, and the transmission
effi-ciency c. Substituting = ce-gn:
= acXe-gn (1-Z) - gZ. (27)
This equation would lead to a formula for R0 consistent
with Eq. 22. However, solving for Z at equilibrium in Eq.
27 gives:
This is not consistent with Eq. 8 (or formula 14.1a from [4]); thus, the statics are not consistent with the assump-tions. The difference between Eq. 27 and Eq. 18 is the
dif-ference between e-gn(1 - Z) and (e-gn - Z). The former asserts
that noninfectious mosquitoes, (1 - Z), become infectious
at the rate acXe-gn, the latter that mosquitoes become
infected at the rate acX, but only those who would survive
the latent period, e-gn, ever become infectious. Eq. 18 is
consistent with the other assumptions in the model. The two are equal if and only if the probability of surviving the
incubation period, e-gn = 1.
Appendix 2
There are two differences between the lines and symbols in Fig. 3. The first difference involves the definition and
use of δ. The second issue involves the formula for the
proportion of infectious mosquitoes.
Z=acX
(
1−Z)
−gZ( )
26
c
c
c
Z
Z acXe
acXe g
gn
gn
=
+
( )
−
Killeen, et al [9] define δas the number of feeding cycles that would elapse before an infected mosquito becomes infectious. The mosquito would transmit on the
subse-quent bite. This would suggest that δshould always be the
next largest integer (often the ceiling function). Killeen et
al. always use the next smallest integer (often called the
floor function). For example, if δ= 3.4, an infected
mos-quito would be infectious on the fourth subsequent bite,
but Killeen et al. use the third bite. Which way is correct?
Like the classic models, cyclical feeding models are also simple, deterministic approximations to much more com-plicated processes. Mosquitoes may feed at different rates, so the time to infection would be described by a distribu-tion. Fig. 1 was generated using the average. One curve
was produced using the smaller integer value of δand a
second curve using the larger integer. Next, the
non-inte-ger part of δwas used to weight the two curves. For
exam-ple, for δ= 3.4, the upper curve was generated using δ= 3
and a lower curve using δ= 4, then 40% of the upper value
was added to 60% of the lower value.
Killeen et al. [9] give a formula for the proportion of
mos-quitoes that are infectious, Si after surviving to a given
feeding cycle, i. In their notation, k is the probability of
infection per bite on an infectious human; thus k = cX. The
proportion of blood meals on humans is Q. In their
model, Si = kQ(i - δ), where δ is the number of feeding
cycles that must elapse between becoming infected and becoming infectious. This formula is, at best, an
approxi-mation for short-lived mosquitoes when kQ is small; that
is, it describes the proportion of infected mosquitoes as a linear function of the number of feeding cycles, and so encompasses the nonsensical possibility that more than 100% of mosquitoes can be infectious (see Fig. 3). Their
formula for EIR (from Eq. 13 in Killeen, et al. [9]) is kLE/
Nh, where:
where E is the daily emergence rate of adult mosquitoes
and Nh is human population density. The formula was
[image:11.612.59.551.86.332.2]Revisiting Kaduna Figure 3
Revisiting Kaduna. The statics for a cohort of mosquitoes are plotted using parameter values from Kaduna and the algo-rithm described by Killeen, et al., with δ rounded to the next lowest integer (using + for the proportion of a cohort that sur-vives and the downward pointing triangles for the proportion of an original cohort that is alive and infectious). Also plotted are the lower values where δ was rounded to the next highest integer (using – or an upward pointing triangle). Killeen et al. (1999) use a linear approximation for the proportion of infectious mosquitoes; the approximation is bad in some circumstances. In this case, it predicts that > 100% of mosquitoes are infected, after about 50 days. For comparison, the age-specific survivorship and the probability infection for Kaduna are replotted, as in Figure 1 (lines).
0
10
20
30
40
50
60
0.0
0.4
0.8
Kaduna
A
λ
(A),
µ
(A)
+++++++
++
++
++
++
++
++
++
++
++
+
0
0.02
0.04
λ
(A)*
µ
(A)
−−−−−−−−
−−
−−
−−
−−
−−
−−
−−
−−
−−
L Q i Pf i
i
= −
( )
= ∞
∑
2
29 ( δ)( ) .
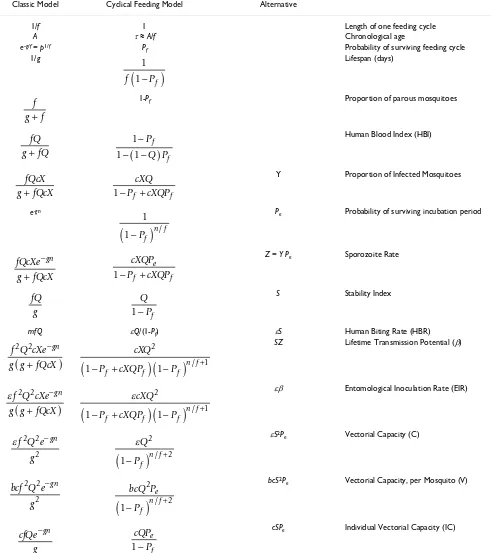
Table 2: Formulas from classic and cyclical feeding models. A comparison of classic formulae with those from cyclical feeding models [8]. In the third column, a simple alternative is given using a term defined in an earlier row. For direct comparison, the formula fQ is used instead of a. Also, εdenotes the number of adult mosquitoes that emerge per human per day, and X denotes the proportion of infectious humans. Other parameters are described in Table 1. The emergence rate εmay differ from the number that are feeding for the first time on a human per day, N, used by Saul, et al., depending on the behavior of nulliparous mosquitoes [8,27]. All these formulae are given for a random sample of mosquitoes; sampling methods may take a biased sample of mosquitoes at various stages in the gonotrophic cycle.
Classic Model Cyclical Feeding Model Alternative
1/f 1 Length of one feeding cycle
A τ≈A/f Chronological age
e-g/f = p1/f P
f Probability of surviving feeding cycle
1/g Lifespan (days)
1-Pf Proportion of parous mosquitoes
Human Blood Index (HBI)
Y Proportion of Infected Mosquitoes
e-gn P
e Probability of surviving incubation period
Z = Y Pe Sporozoite Rate
S Stability Index
mfQ εQ/(1-Pf) εS Human Biting Rate (HBR) SZ Lifetime Transmission Potential (β)
εβ Entomological Inoculation Rate (EIR)
εS2P
e Vectorial Capacity (C)
bcS2P
e Vectorial Capacity, per Mosquito (V)
cSPe Individual Vectorial Capacity (IC) 1
1
f
(
−Pf)
f g+f
fQ g+fQ
1
1 1
− − −
(
)
P
Q P f
f
fQcX g+fQcX
cXQ Pf cXQPf
1− +
1
1−
(
Pf)
n f/ fQcXeg fQcX gn
−
+
cXQP P cXQP
e
f f
1− +
fQ g
Q Pf
1−
f Q cXe g g fQcX
gn
2 2 −
+
(
)
Pf cXQPcXQf Pf n f 21
1− + 1
(
)
(
−)
/ +εf Q cXe g g fQcX
gn
2 2 −
+
(
)
Pf cXQPεcXQf Pf n f 21
1− + 1
(
)
(
−)
/ +εf Q e g
gn 2 2
2
− εQ
Pf n f 2
2 1−
(
)
/ +bcf Q e g
gn 2 2
2
− bcQ P
P e
f n f 2
2 1−
(
)
/ +cfQe g
gn
− cQP
P e
f
rewritten, factoring (Pf)δ and changing the index to j = i
-δ, then taking the infinite sum:
Note that (Pf)δ= Pe. This formula does not match the one
given by Saul, et al. [8]. An exact formula for the
propor-tion that are infectious after i feeding cycles is:
Si = 1 - (1 - kQ)i-δ (31)
That is, to remain uninfected after i - δfeeding cycles, a
mosquito must have failed to become infected by each
one of the i - δpreceding bites. After δfeeding cycles have
passed, the mosquito would be infectious. The exact for-mula is given by Saul, et al. (Table 2, [8]).
Authors' contributions
The authors contributed equally to this draft.
Acknowledgments
We thank Wendy Prudhomme and Jonathan Dushoff for their comments.
References
1. Ross R: The prevention of malaria London: John Murray; 1911. 2. Macdonald G: The Epidemiology and Control of Malaria London: Oxford
University Press; 1957.
3. McKenzie FE: Why model malaria?Parasitol Today 2000, 16:511-6. 4. Anderson RM, May RM: Infectious Diseases of Humans Oxford: Oxford
University Press; 1991.
5. Bailey NTJ: The Biomathematics of Malaria Oxford University Press; 1982.
6. Gillies MG, Wilkes TJ: A study of the age composition of popu-lationas of Anopheles gambiae and An. funestus in North East Tanzania.Bull Ent Res 1965, 56:237-262.
7. Lines JD, Wilkes TJ, Lyimo EO: Malaria Infectiousness Measured by Age-Specific Sporozoite Rates in Anopheles gambiae Human in Tanzania.Parasitology 1991, 102:167-177.
8. Saul AJ, Graves PM, Kay BH: A cyclical feeding model for patho-gen transmission and its application to determine vectorial capacity from vector infection rates. J Appl Ecol 1990, 27:123-133.
9. Killeen GF, McKenzie FE, Foy BD, Schieffelin C, Billingsley PF, Beier JC: A simplified model for predicting malaria entomologic inoculation rates based on entomologic and parasitologic
parameters relevant to control. Am J Trop Med Hyg 2000, 62:535-544.
10. Fine PEM: Superinfection – A Problem in Formulating a Problem.Bureau of Hygiene and Tropical Diseases 1975, 72:475-488. 11. Aron JL, May RM: The population dynamics of malaria. In Popu-lation Dynamics and Infectious Disease Edited by: Anderson RM. Chap-man and Hall; 1982:139-179.
12. Dietz K: Mathematical models for transmission and control of malaria. In Principles and Practice of Malariology Edited by: Wernsdor-fer W, McGregor I. Edinburgh: Churchill Livingston, Inc; 1988:1091-1133.
13. Dye C, Hasibeder G: Population dynamics of mosquito-borne disease: effects of flies which bite some people more fre-quently than others.Trans Roy Soc Trop Med Hyg 1986, 80:69-77. 14. Takken W, Knols BGJ: Odor-mediated behavior of Afrotropical
malaria mosquitoes.Ann Rev Entomol 1999, 44:131-157. 15. Smith T, Charlwood JD, Takken W, Tanner M, Spiegelhalter DJ:
Map-ping the densities of malaria vectors within a single village.
Acta Trop 1995, 59:1-18.
16. Hii JL, Smith T, Mai A, Mellor S, Lewis D, Alexander N, Alpers MP: Spatial and temporal variation in abundance of Anopheles (Diptera:Culicidae) in a malaria endemic area in Papua New Guinea.J Med Entomol 1997, 34:193-205.
17. Staedke SG, Nottingham EW, Cox J, Kamya MR, Rosenthal PJ, Dorsey G: Short report: proximity to mosquito breeding sites as a risk factor for clinical malaria episodes in an urban cohort of Ugandan children.Am J Trop Med Hyg 2003, 69:244-246. 18. van der Hoek W, Konradsen F, Amerasinghe PH, Perera D, Piyaratne
MK, Amerasinghe FP: Towards a risk map of malaria for Sri Lanka: the importance of house location relative to vector breeding sites.Int J Epidemiol 2003, 32:280-285.
19. Davidson G: Estimation of the survival of Anopheline mosqui-toes in nature.Nature 1954, 174:792-793.
20. Garrett-Jones C: Prognosis for interruption of malaria trans-mission through assessment of the mosquito's vectorial capacity.Nature 1964, 204:1173-1175.
21. Dye C, Williams BG: Non-Linearities in the Dynamics of Indi-rectly-Transmitted Infections (or, Does having a Vector make a Difference?). In Ecology of Infectious Diseases in Natural Pop-ulations Edited by: Grenfell BT, Dobson AP. Cambridge, UK: Cam-bridge University Press; 1995:260-279.
22. Dietz K, Molineaux L, Thomas A: A Malaria Model Tested in the African Savannah.B World Health Organ 1974, 50:347-357. 23. Box GEP: Robustness in the stratetgy of scientific model
building. In Robustness in Statistics Edited by: Launer RL, Wilkinson GN. New York: Academic Press; 1979.
24. Dietz K: The estimation of the basic reproduction number for infectious diseases.Stat Methods Med Res 1993, 2:23-41. 25. Diekmann O, Heesterbeek JAP, Metz JAJ: On the definition and
the computation of the basic reproduction ratio R0 in models for infectious diseases in heterogeneous populations.J Math Biol 1990, 28:365-382.
26. Snow RW, Gilles HM: The epidemiology of malaria. In Essential Malariology 4th edition. Edited by: Warrell DA, Gilles HM. London: Arnold; 2002:85-106.
27. Mutero CM, Birley MH: The effect of pre-gravid development on the estimation of mosquito survival rates.J Appl Ent 1989, 107:96-101.
m
[image:13.612.51.544.156.209.2]bcC/r Basic Reproductive Number, R0
Table 2: Formulas from classic and cyclical feeding models. A comparison of classic formulae with those from cyclical feeding models [8]. In the third column, a simple alternative is given using a term defined in an earlier row. For direct comparison, the formula fQ is used instead of a. Also, εdenotes the number of adult mosquitoes that emerge per human per day, and X denotes the proportion of infectious humans. Other parameters are described in Table 1. The emergence rate εmay differ from the number that are feeding for the first time on a human per day, N, used by Saul, et al., depending on the behavior of nulliparous mosquitoes [8,27]. All these formulae are given for a random sample of mosquitoes; sampling methods may take a biased sample of mosquitoes at various stages in the gonotrophic cycle. (Continued)
εbcf Q e g r
gn 2 2
2
− εbcQ P
P r
e
f 2
2 1−
(
)
L Q P j P Q P
P
f f
j f
f j
=
( )
( )
=( )
−(
)
( )
+
= ∞
∑
2 2
1 2
1 1
30
δ δ
Publish with BioMed Central and every scientist can read your work free of charge "BioMed Central will be the most significant development for disseminating the results of biomedical researc h in our lifetime."
Sir Paul Nurse, Cancer Research UK
Your research papers will be:
available free of charge to the entire biomedical community peer reviewed and published immediately upon acceptance cited in PubMed and archived on PubMed Central yours — you keep the copyright
Submit your manuscript here:
http://www.biomedcentral.com/info/publishing_adv.asp
BioMedcentral 28. Dye C: Epidemiological significance of vector-parasite
interactions.Parasitology 1990, 101:409-415.
29. Dietz K: Models for vector-borne parasitic diseases.Lecture Notes in Biomathematics 1980, 39:264-277.
30. Killeen GF, Fillinger U, Knols BGJ: Advantages of larval control for African malaria vectors: Low mobility and behavioural responsiveness of immature mosquito stages allow high effective coverage.Malaria J 2002, 1:8.
31. Molineaux L: Malaria and mortality: some epidemiological considerations.Ann Trop Med Parasit 1997, 91:811-825.