Open Access
Research
Reader technique as a source of variability in determining malaria
parasite density by microscopy
Wendy Prudhomme O'Meara*
1, Mazie Barcus
2, Chansuda Wongsrichanalai
3,
Sinuon Muth
4, Jason D Maguire
5, Robert G Jordan
2, William R Prescott
2and
F Ellis McKenzie
6Address: 1Division of International Epidemiology and Population Studies, Fogarty International Center, National Institutes of Health, 16 Center
Dr., Building 16, Bethesda MD 20892, USA, 2Hydas World Health, Hershey, PA, USA, 3U.S. Naval Medical Research Unit No.2, Jakarta, Indonesia, 4National Center for Parasitology, Entomology and Malaria Control (CNM), Ministry of Health, Phnom Penh, Cambodia, 5U.S. Naval Medical
Research Unit No.2, Jakarta, Indonesia and 6National Institutes of Health, Bethesda, MD, USA
Email: Wendy Prudhomme O'Meara* - [email protected]; Mazie Barcus - [email protected]; Chansuda Wongsrichanalai - [email protected]; Sinuon Muth - [email protected];
Jason D Maguire - [email protected]; Robert G Jordan - [email protected]; William R Prescott - [email protected]; F Ellis McKenzie - [email protected]
* Corresponding author
Abstract
Background: Accurate identification and quantification of malaria parasites are critical for measuring clinical trial outcomes. Positive and negative diagnosis is usually sufficient for the assessment of therapeutic outcome, but vaccine or prophylactic drug trials require measuring density of infection as a primary endpoint. Microscopy is the most established and widely-used technique for quantifying parasite densities in the blood.
Methods: Results obtained by 24–27 expert malaria microscopists, who had independently read 895 slides from 35 donors, were analysed to understand how reader technique contributes to discrepancy in measurements of parasite density over a wide range of densities.
Results: Among these 35 donations, standard deviations ranged from 30% to 250% of the mean parasite density and the percent discrepancy was inversely correlated with the mean parasite density. The number of white blood cells indexed and whether parasites were counted in the thick film or thin film were shown to significantly contribute to discrepancy amongst microscopists.
Conclusion: Errors in microscopy measurements are not widely appreciated or addressed but have serious consequences for efficacy trials, including possibly abandoning promising vaccine candidates.
Published: 12 December 2006
Malaria Journal 2006, 5:118 doi:10.1186/1475-2875-5-118
Received: 06 September 2006 Accepted: 12 December 2006
This article is available from: http://www.malariajournal.com/content/5/1/118
© 2006 O'Meara et al; licensee BioMed Central Ltd.
Background
Microscopy has been used to detect malaria parasites in the blood of infected patients since Laveran first identified the parasites in 1880 [1]. Microscopic examination of blood is the most affordable, accessible, widely used and reliable technique for diagnosis of malaria infection. Although molecular techniques for quantifying parasites have made significant progress in recent years, microscopy remains the primary technique for quantification of para-sites. Microscopy is routinely relied upon as a primary endpoint measurement for epidemiological studies, inter-vention studies, and clinical trials. Despite the critical importance of microscopy for the study and treatment of malaria, little effort has been made to precisely determine and distinguish sources of error in microscopic diagnosis and quantification of parasitaemia or to evaluate the impact of this error on endpoint measurements.
Like all detection methods, microscopy is an imperfect technique. However, unlike other methods, such as PCR and immunochromatographic assays, it relies heavily upon the judgment and experience of the individual user. This was noted at least as early as 1930, when Knowles and White reported on the 'Training and experience of the observer, the personal factor in the diagnosis of malaria' [2].
To understand how reader technique contributes to dis-crepancies in reporting parasite species and densities, results from 895 slides made from 35 blood donations were analysed. Some of the slides were parasite-positive and some were guaranteed parasite-negative donations. One slide from each donation was sent to each of 27 expert malaria microscopists for evaluation of parasite presence, species and density. Each participant was asked to report the number of sexual and asexual stages of each species present, but was permitted to choose the manner in which slides were read. There were considerable differ-ences in the densities and species reported for each sam-ple. Analysis of these results yields important insights into the sources of discrepancies between readers reported elsewhere [3-5] and points to possible unevaluated error in reported microscopy results supporting much of the malaria literature.
Methods
Details of the patient selection, sample collection and preparation, and reference reader selection and participa-tion have been described in detail elsewhere [6] and are summarized below.
Sample collection and preparation
Donors were chosen from among symptomatic patients self-presenting to regional health clinics or involved in Internal Review Board-approved malaria research
proto-cols in Cambodia and Indonesia and consent specific to this study was obtained from each participant prior to drawing blood. Malaria-negative donations were taken from individuals who are natives of non-endemic areas who had not been exposed to risk of malaria in the past two years. Approximately 3 ml of venipuncture blood was collected in an ethylene-diaminetetraacetic acid (EDTA)-filled tube and multiple slides (up to 150), with both a thick and a thin smear, were prepared from each donation within hours of sample collection. Thick films were made by spreading exactly 6 µl of blood in a circle of 12 mm in diameter. Two microliters of blood were spread using the edge of a clean slide to make a thin film. The thin film was fixed with methanol and the entire slide was stained with Giemsa solution using standard procedures. Negative donations were stained in separate containers which had never been used for positive donations. Only slides from the same donor were stained in the same batch. Slides were coverslipped to preserve them.
Density and species determination
Slides from 35 donations were sent to 27 reference readers from 13 countries who were considered skilled malaria microscopists by reputation and who accepted the invita-tion to participate. Each reader received a slide from each of the 35 donations, but each slide was unique (i.e. no reader observed exactly the same slide). Each reader was asked to record the density of asexual and sexual forms of each species observed on the slide. When it was not possi-ble to distinguish between asexual forms in mixed infec-tions, readers often reported the species observed and recorded a total asexual parasite density. No guidelines were given as to how to count the parasites, whether by co-counting white blood cells (WBC) or co-counting red blood cells (RBC), or how many reference RBCs or WBCs should be reported, although the spreadsheet used by each reader to record data included columns for number of WBCs and number of RBCs. The absence of a rigid counting protocol generated a heterogeneity of counting techniques which permitted us to analyse differences between them.
Analysis
Results
Variation between readers
Differences in results reported by individual readers eval-uating different slides from the same donation include differences in individual judgment and technique, and differences which arise due to handling or random distri-bution of parasites in the blood. Figure 1 shows the stand-ard deviation of density readings scaled by the inter-reader mean density for each donation plotted as a function of the mean density. There is a significant inverse correlation between discrepancy among microscopists and mean density (p = 0.0096, Spearman rank correlation). The median scaled deviation is 0.58.
To further dissect the source of reader discrepancy at very low density, one microscopist examined the entire thick film of two slides from the same donation. He identified 57 parasites on one slide and 49 parasites on the other, giving densities of 10 and 8 parasites/µl, respectively. The original results reported for these same two slides by two other independent readers were 80 parasites/µl and 0 par-asites/µl, indicating that random chance in the selection of fields to examine may play a considerable role in reader discrepancy, particularly at low densities.
Counting technique
Readers were permitted to use either the thick film or the thin film and to count either parasites per WBC or para-sites per RBC. There were no guidelines given as to how many WBCs or RBCs should be indexed when measuring the parasite density. Some readers indexed as many as 8,600 WBCs and 150,000 RBCs or as few as 3 WBCs and 400 RBCs (median WBCs and RBCs counted were 203
and 2,000, respectively). 10.4% of all positive results were reported as parasites per RBC.
Thick film (WBC) method
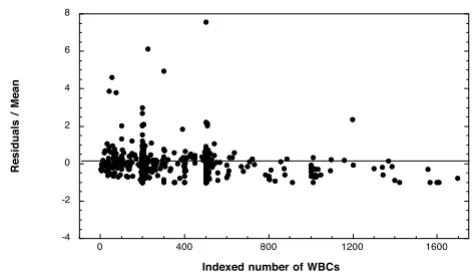
In order to understand how the differences in the num-bers of reference blood cells counted contributed to over-all discrepancy among readers, the first analysis used only counts made from the thick film (WBCs) and excluded counts made from the thin film (RBCs). The difference between the individual reads and the group mean for a donation was scaled by the group mean (residual of reader X for sample Y divided by the mean density of sam-ple Y). This scaled residual was plotted versus the mean density for every measurement of every donation (Figure 2). For all donations, the deviation of the scaled residuals from the mean decreased as the number of reference WBCs increased. There is a significant negative correlation between the magnitude of the residuals and the number of WBCs counted for each measurement (p = 0.0003, Spearman rank correlation).
Thick film (WBC) method vs. thin film (RBC) method Next, the parasite densities reported based on readings from the thick film were compared to those from the thin film. RBCs are lysed during staining of the thick film; therefore, parasite densities reported against a reference number of RBCs could only have been counted in the thin film. The inverse was also assumed to be true, i.e. that par-asite densities reported as parpar-asites per WBC were always counted in the thick film. There were nine donations for which reads (at least two) were reported from both the
[image:3.612.315.551.474.610.2]Deviation from the mean parasite density decreases as the number of WBCs indexed increases
Figure 2
Deviation from the mean parasite density decreases
as the number of WBCs indexed increases. The
resid-ual of each measurement (read of sample Y from micro-scopist X-mean of all micromicro-scopists for sample Y) was scaled by the sample mean and plotted as a function of the number of reference WBCs counted for that read. Reads which were made by indexing RBCs were excluded from this plot, but were included in the sample mean.
-4 -2 0 2 4 6 8
0 400 800 1200 1600
Residuals
/
Mean
Indexed number of WBCs
Standard deviation of parasite density scaled by the mean decreases as the mean density of infection increases
Figure 1
Standard deviation of parasite density scaled by the mean decreases as the mean density of infection
increases. Standard deviation of reads from 27 malaria
microscopists evaluating parasite density from slides made from 30 different donations is scaled by the mean density of each donation and plotted against the mean density.
0.5 1 1.5 2 2.5 3 3.5 4
0 5 103 1 104 1.5 104 2 104 2.5 104 3 104 3.5 104 4 104
Standard
deviation
/
mean
thick and thin film. These donations had a higher mean density than donations for which all microscopists counted the thick film (70,613/µl versus 1,569/µl), indi-cating that microscopists were more likely to choose to count parasites on the thin film as parasite density increased. There were no donations for which all the microscopists counted parasites in the thin film. The mean density among measurements taken from the thick film were compared to those taken from the thin film. Fig-ure 3 shows the ratio of the mean density reported from WBCs to the total mean density and the ratio of the mean density from RBCs to the total mean density for each donation which had more than one instance of each method. The measurements from the thin film averaged about 30% higher than the total mean whereas densities measured from the thick film averaged 10% lower than the total mean. The difference between the thick- and thin-film counts was significant as determined by the Mann-Whitney U test (p = 0.0011). It is possible that this difference could arise from the multiplicand used to con-vert from RBC or WBC to volume. If the approximation of 4,500,000 RBCs per microliter represents a large overesti-mate compared to 8,000 WBCs per microliter, this could account for the systematically higher means from RBC counts. There was no consistent trend for gametocyte counts (data not shown). The density of gametocytes is generally much lower than that of asexual forms, and, therefore, the volume of blood examined greatly affects the number observed. The volume of blood per field of a thin film is about 20–30 times less than a thick film, lead-ing to a greatly decreased probability of observlead-ing a game-tocyte in any given field. In these nine donations, gametocytes were more often observed in the thick film. When gametocytes were identified by readers examining the thin film, the reported density of gametocytes was higher in the thin film than in the thick film.
White blood cell distribution
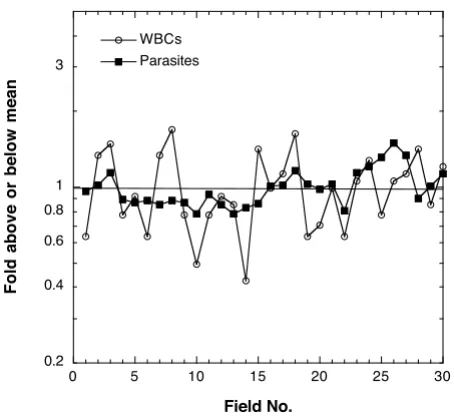
As demonstrated above, the precision or agreement of the density measurements is strongly dependent on the number of WBCs counted. To determine how uniform the distribution of WBCs is from field to field in the thick film, one microscopist counted the parasites per field and the WBCs per field over 30 high-powered fields of a single thick film. He found a total of 424 WBCs and 8,897 para-sites in 30 fields. Figure 4 shows the number of parapara-sites and WBCs per field. Each per-field value is divided by the mean over all 30 fields to give the proportion of parasites or WBCs above or below the mean in each field. The number of parasites per field is more evenly distributed than the number of WBCs per field. A thick film prepared from 6 µl of blood had approximately 2,800 fields, as evaluated by one reader. Calculating the parasite density by adding the total WBCs and the total parasites counted in 30 fields and using the WBC approximation (8,000
WBC per µl) gives a value of 168,000 parasites/µl ([8,897 p in 30 fields/424 WBCs in 30 fields] × 8,000 WBCs/µl = 168,000 p/µl). Using the conversion factor of 2,800 fields per thick film gives a value of 138,000 parasites per µl ([8,897 p/30 fields] × [2,800 fields/6 µl of blood] = 138,000 p/µl), a difference of 18%.
Discussion
There is a critical and long-standing need for tools to standardize the training and evaluation of malaria micro-scopists. Slide sets consisting of donations with three spe-cies individually or in mixed infections and with a wide range of densities were produced to serve as such a tool [6]. Because microscopy is the only technique available for enumerating parasites in dried blood films, such slides must be validated by the very technique they are designed to improve. The slides intended for these sets were vali-dated by a panel of reference readers with extensive expe-rience in malaria microscopy. Comparing results among such a large panel of experienced microscopists from all over the world was only possible due to the meticulous banking of large numbers of slides prepared simultane-ously from each donation. Despite the collective knowl-edge and experience of the readers, there was considerable discrepancy among them concerning species [6] and den-sities. This study analysed the contributions of reader
Parasite density measurements made by counting parasites per RBC in the thin film are consistently higher than meas-urements made using WBCs in the thick film
Figure 3
Parasite density measurements made by counting parasites per RBC in the thin film are consistently higher than measurements made using WBCs in the
thick film. The fold-difference of the mean from RBC-based
densities and WBC-based densities compared to the total mean.
0 0.5 1 1.5 2
A B C D E F G H I
Counts by RBC Counts by WBC
Fraction
of
the
total
m
ean
technique and method of enumeration to the variability in the density measurements.
Discrepancy among readers decreased with increasing par-asite density. This is in agreement with an analysis of field data from Peru and Thailand [5] and from Uganda [4]. Counts from the same slide made by two different micro-scopists reported by Earle and Perez in 1932 [8] also show a very similar trend with density. The data in these three studies compared the differences between two readings performed on individual samples. The data analysed in this study are unique in the number of readings taken for each sample (n = 24–27) by independent experts. It is the first study analysing more than three quantitative meas-urements per sample. The median standard deviation of parasite density for a donation was 58% of the mean and ranged from 30% of the mean to 250% of the mean. The deviation among reads of a single sample is attributable to differences in reader technique and judgment as well as differences between slides made from a single blood sam-ple, a complication that is not present in the studies men-tioned above where reads were made from the same slide. It was not possible to estimate from these data differences between slides prepared from the same blood sample which arise due to sample handling and preparation, imperfect lysis of RBCs in the thick film, and random dis-tribution of parasites in the blood, but the preliminary data reported above indicate that the latter may be quite
significant. The analysis of field data from Peru and Thai-land demonstrated that differences between slides made from the same blood sample and read by the same micro-scopist are not trivial and were, on average, 8–17%. This is a critical issue which remains to be addressed systemat-ically in a manner which will allow the magnitude of the differences between reader technique, differences between slides, and random error to be quantified and compared.
The observation that the deviation from the mean decreased as the number of WBCs indexed by the reader increased is logical. In general, as the number of measure-ments in any experimental system increases, the sample mean approaches the true mean or the expectation of the mean. Since the parasite density was evaluated as a func-tion of the number of parasites per WBC, the estimate of the true number of parasites per WBC improves as the number of measurements (i.e. WBCs) increases. The validity of this technique is limited by the implicit assumption that WBCs are evenly distributed in the film. To test this assumption, the number of parasites and the number of WBCs per field were counted in a single thick film. Over 30 fields, the WBCs were much less uniformly distributed than the parasites. This leads to the conclusion that, even if the readers identified every true parasite with-out error, the variation in the distribution of WBCs from field to field could significantly contribute to discrepancy among readers and errors in estimating true parasite den-sity.
Comparing parasite densities observed in thick films to those observed in thin films confirmed the finding of Dowling and Shute [9] and others [10] who reported that as much as 60% percent of parasites were either obscured in the thick film or lost during staining and lysis of red blood cells. The results presented here show that 0–65% fewer parasites were counted in the thick films when com-pared to the thin film. In only one instance were more parasites (46%) observed by microscopists reading the thick film. One other study [11] found acceptable agree-ment between thin and thick film density measureagree-ments when parasite density counted against RBCs in the thin film was compared to parasite density counted per high powered field (HPF) in the thick film.
This analysis of differences in reader technique suggests several important considerations when attempting to reli-ably estimate parasite density from blood films. To improve precision, or agreement among readers, a uni-form counting protocol should be applied. Increasing the number of indexed cells (WBCs or RBCs) also improves agreement between readers. However, to improve both precision and accuracy, the use of WBCs could be elimi-nated in favour of a grid counting or HPF counting method which allows the parasites per volume to be
[image:5.612.61.288.91.299.2]WBC distribution in the thick film is less uniform than para-site distribution
Figure 4
WBC distribution in the thick film is less uniform
than parasite distribution. The parasites per field and
WBCs per field for 30 fields of a thick film are plotted as fold above or below the mean parasites or WBCs per field for all 30 fields.
0.2 0.4 0.6 0.8 1 3
0 5 10 15 20 25 30
WBCs Parasites
Fold
above
or
below
mean
counted directly and avoids the problem of unevenly dis-tributed WBCs and an inaccurate conversion factor [11,12]. Using the standard conversion factor of 8,000 WBCs per µl was adequate in this application because reads were only being compared between microscopists examining the same blood sample. For studies where patient parasitaemias are being compared to each other or within a group, the standard WBC approximation is grossly inadequate as WBC counts can vary greatly between individuals and decrease as a result of malaria infection [13]. Applying a volume-counting method or using true WBC counts for each patient as has been done in some clinical trials [14-16] would eliminate this source of error.
Conclusion
Accurate and precise quantification of malaria parasites is a critical endpoint for many types of intervention trials. In a clinical setting, errors could endanger a patient. Recent studies and unpublished personal experience have shown that false positive and negative rates using microscopy in the field can be as high as 30% [3] and discrepancies in density measurements can be as much as 2–3 fold [5]. This study identified similar discrepancies in ideal labora-tory conditions among expert microscopists and demon-strated that at least a portion of the discrepancy is due to differences in reader technique and the use of WBCs as a counting index. It also highlights the importance of reporting slide reading protocols in published studies and the potential danger of comparing density data between studies. More experiments and analyses need to be done to determine how much this problem could be amelio-rated by increased training, standardization of techniques and counting protocols, and improved awareness of the errors inherent in microscopic detection and quantifica-tion of malaria parasites.
Conflict of interest
The author(s) declare that they have no competing inter-ests.
Authors' contributions
WPO contributed to the study design and data analysis and prepared the first draft of the manuscript. MB contrib-uted to the design and execution of the study, data analy-sis, and writing of the manuscript. CW contributed to the design and execution of the study as well as the analysis and intellectual content of the manuscript. SM uted to the design and execution of the study. JM contrib-uted to the intellectual content of the manuscript. RJ contributed to the study design and analysis. WRP con-tributed to the study design, data analysis, and drafting of the manuscript. FEM contributed to the study design, data analysis, and drafting of the manuscript.
Disclaimer
The views and opinions are those of the authors and do not purport to represent those of the U.S. Navy or Depart-ment of Defense.
Acknowledgements
We thank Dr. S. Duoung of the Cambodian National Center for Parasitol-ogy, Entomology and Malaria Control (CNM), and Dr. P. Sismadi of the Indonesian National Center for Health Research and Development for their support. We would like to express our sincerest appreciation to the technical and support staff of Parasitic Diseases Program, NAMRU-2 and the Ministry of Health, Cambodia. Finally, we gratefully recognize the ded-icated work ofour reference malaria smear readers. This work was sup-ported in part by U.S. National Institutes of Health Malaria Research and Reference Reagent Resource Center (MR4) Prime Award Number NO1-AI-85355.
References
1. Laveran A: Deuxieme note relative a un nouveau parasite trouve dans le sang des malades atteints de la fievre palud-isme. Bulletin de l'Academie medicale 1880, 2ieme serie:1346-1347. 2. Knowles R, White RS: Studies in the parasitology of malaria.
Indian Medical Research Memoirs 1930, 18:.
3. McKenzie FE, Sirichaisinthop J, Miller RS, Gasser RA, Wongsrichanalai
C: Dependence of malaria detection and species diagnosis by
microscopy on parasite density. Am J Trop Med Hyg 2003,
69:372-376.
4. Kilian AHD, Metzger WG, Mutschelknauss EJ, Kabagambe G, Langi P, Korte R, von Sonnenburg F: Reliability of malaria microscopy in epidemiological studies: results of quality control. Trop Med Int Health 2000, 5:3-8.
5. Prudhomme O'Meara WA, McKenzie FE, Magill AJ, Forney JR, Perm-panich B, Lucas C, Gasser RA Jr, Wongsrichanalai C: Sources of var-iability in determining malaria parasite density by microscopy. Am J Trop Med Hyg 2005, 73:593-598.
6. Maguire J, Lederman E, Barcus M, Prudhomme O'Meara W, Jordon R, Duong S, Muth S, Sismadi P, Bangs M, Prescott W, Baird J, Wong-srichanalai C: Production and Validation of Durable, High Quality Standardized Malaria Microscopy Slides for Teach-ing, Testing and Quality Assurance during an Era of Declin-ing Diagnostic Proficiency. Malaria Journal 2006, 5:92.
7. Warhurst DC, Williams JE: Laboratory diagnosis of malaria. J Clin Pathol 1996, 49:533-538.
8. Earle WC, Perez M: Enumeration of parasites in the blood of malarial patients. J Lab Clin Med 1932, 17:1124-1130.
9. Dowling MAC, Schute GT: A comparative study of thick and thin films in the diagnosis of scanty malaria parasitemia. Bull World Health Organ 1966, 34:249-267.
10. Bejon P, Andrews L, Hunt-Cooke A, Sanderson F, Gilbert S, Hill A:
Thick blood film examination for Plasmodium falciparum malaria has reduced sensitivity and underestimates parasite density. Malaria Journal 2006, 5:104.
11. Planche T, Krishna S, Kombila M, Engel K, Faucher JF, Ngou-Milama E, Kremsner PG: Comparison of methods for the rapid
labora-tory assessment of children with malaria. Am J Trop Med Hyg
2001, 65:599-602.
12. Greenwood BM, Armstrong JRM: Comparison of 2 Simple Meth-ods for Determining Malaria Parasite Density. Trans R Soc Trop Med Hyg 1991, 85:186-188.
13. McKenzie FE, Prudhomme WA, Magill AJ, Forney JR, Lucas C, Perm-panich B, Gasser RA Jr, Wongsrichanalai C: WBC counts and malaria. J Infect Dis 2005, 192:323-330.
Publish with BioMed Central and every scientist can read your work free of charge "BioMed Central will be the most significant development for disseminating the results of biomedical researc h in our lifetime."
Sir Paul Nurse, Cancer Research UK
Your research papers will be:
available free of charge to the entire biomedical community
peer reviewed and published immediately upon acceptance
cited in PubMed and archived on PubMed Central
yours — you keep the copyright
Submit your manuscript here:
http://www.biomedcentral.com/info/publishing_adv.asp
BioMedcentral 15. Genton B, Betuela I, Felger I, Al-Yaman F, Anders RF, Saul A, Rare L,
Baisor M, Lorry K, Brown GV, Pye D, Irving DO, Smith TA, Beck HP, Alpers MP: A recombinant blood-stage malaria vaccine reduces Plasmodium falciparum density and exerts selective pressure on parasite populations in a phase 1-2b trial in Papua New Guinea. J Infect Dis 2002, 185:820-827.