SECONDARY STUDENTS
A thesis
m
partial fulfillment of the requirements for the degree of
Master of Arts in Psychology
Massey University
Acknowledgements
Many people have contributed and helped with this thesis, and without them, it would never have been completed. Firstly, thanks to my supervisor, Dr Richard Fletcher, who was prepared to take me on board. Your enthusiasm and faith helped keep the research project moving to its completion.
I would also like to acknowledge the participating schools who were kind enough to allow their students to take time out from class to take part in this research. I
appreciate the time and help given to me from the staff who I dealt with from these schools. I am also very grateful to the students who participated in the research and wish you all well for your futures.
Working on a thesis can be both isolating and frustrating, so thanks to my friends for your support and encouragement, particularly Katherine, my long time study partner and close friend, for your sympathy and understanding.
Acknowledgements Table of Contents
List of Tables and Figures Abstract
List of Appendices
Table of Contents
CHAPTER ONE INTRODUCTION Introduction
Academic underachievement Identifying underachievers
CHAPTER TWO: LITERATURE REVIEW Underachievement
Measuring underachievement Discrepancy model
Academic peiformance measures Ability measures
Learning disabilities
Issues to consider when selecting a discrepancy model Regression to the mean
Measurement error Norm groups
Students schooling experiences
Summary/Conclusion
Characteristics of underachievers
Psychological constructs and underachievement
Social support Motivation Self-efficacy
Outcome e.."Cpectancies!future consequences Study strategies
Test anxiety
Summary
Research Objectives
CHAPTER THREE: METIIODLOGY
Introduction
Participants
Phase I; Underachievement
Measures used in discrepancy model
Measure of abilities (TOSCA)
Academic assessments (Standardised grade averages)
Identifying underachievers
Data analysis
Selecting matching comparison groups with underachiever groups
Phase 2; Questionnaire
Social Support scale
Self- efficacy, study strategies and intrinsic motivation scales
Persistence, effort and disorganisation scales
Future Consequences scale
Procedure
Phase 2; Psychological dimensions and underachievement
Phase 2; Data Analysis
CHAPTER FOUR: RESULTS 40
Phase l~ Underachievement: 40
Descriptive statistics 40
Regression analyses to identify underachievers 40
Results of the matching comparison groups 41
Phase 2: 43
Descriptive Statistics 43
Mean Scores on Questionnaire 43
Factor Analysis 46
Marjoribanks Perceived Family Environment Questionnaire 47
Motivated Strategies Learning Questionnaire 47
Three Factor Structure for the scales effort, disorganisation and effort 48 One Factor Structure for the scale Future Consequences 49
Internal Consistency 49
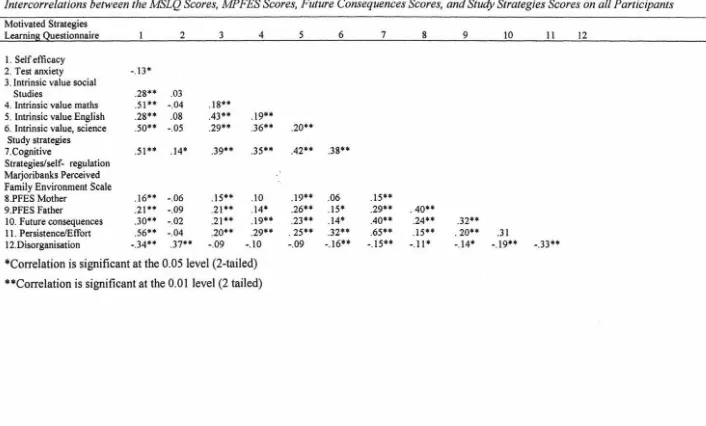
Intercorrelations 50
Motivated Strategy Learning Questionnaire 50
Future Consequences 51
Disorganisation and persistence/ effort (.r;tudy strategies) 51 Marjoribanks Perceived Family Environment Scale 51
Underachiever intercorrelations 54
Differences between the intercorrelations for 'same TOSCA 'and
Underachievers 56
Intercorrelations between the variables for the comparison group 'same
grades' 58
Differences between underachievers and non-underachievers in: self-efficacy, intrinsic value, test aTL'riety, study strategies, social support, and
CHAPTER FIVE: DISCUSSION 63
Identifying underachievers 63
Problems in matching the comparison non-underachievers with underachievers 64
Summruy 65
Psychological variables and underachievement 66
Low response rate 66
Factor structure of the psychological variables 66
Relationships between the scales in the questionnaire 67 Relationships between the scales in the questionnaire for underachievers 69
Study strategies 70
Self-efficacy 71
Intrinsic value 72
Test anxiety 73
Future consequences 74
Social support 75
Limitations 76
Future recommendations 76
Implications and conclusions 77
References 79
Appendix A 84
Table 1 Table 2 Table 3 Figure 1 Figure 2 Table 4 Table 5 Table 6 Table 7 Table 8 Table 9 Table 10
List of Tables and Figures
Methods for Measuring Underachievers
Characteristics of Underachievers
Parental Characteristics of Underachievers
Regression/prediction Equation
Standard Error of Estimate Equation
Means and Standard Deviations of Standardised
Grades and TOSCAS
Regression of Standardised Grades on TOSCA scores
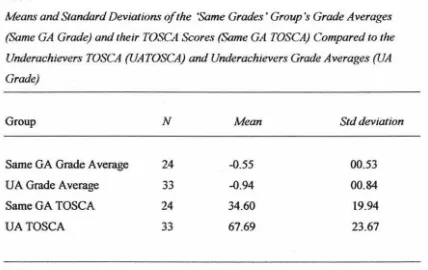
Means and standard deviations of the 'same grades' group's grade
averages (same GA grade) and their TOSCA scores (same GA
TOSCA) compared to the Underachievers TOSCA (UATOSCA)
and underachievers grade averages (U A grade)
Means and standard deviations of the same TOSCA group's grade
averages, and same TOSCA groups' TOSCA scores compared to
the Underachievers TOSCA and underachievers grade averages
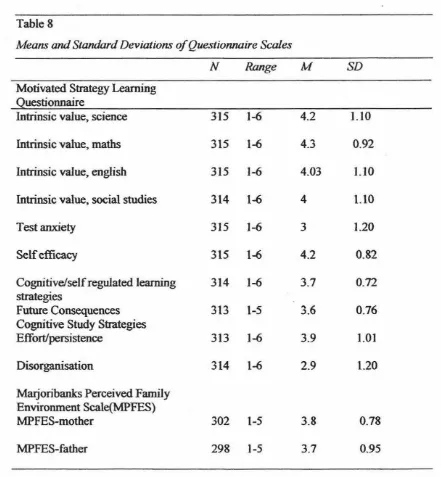
Means and Standard Deviations of the Questionnaire Scales
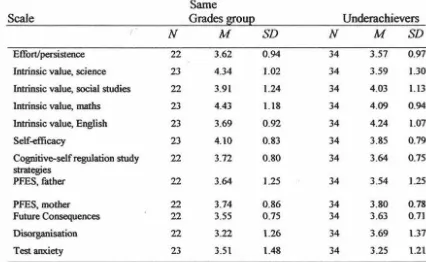
Means and Standard Deviations of the Questionnaire Scores for
the Comparison Group 'Same Grades' and the Underachiever
Group
Means and Standard Deviations for the Comparison Group 'Same
Grades" and the Underachiever Group
Table 11 Table 12 Table 13 Table 14 Table 15 Table 16 Table 17 Table B.l Table B.2 Table B.3
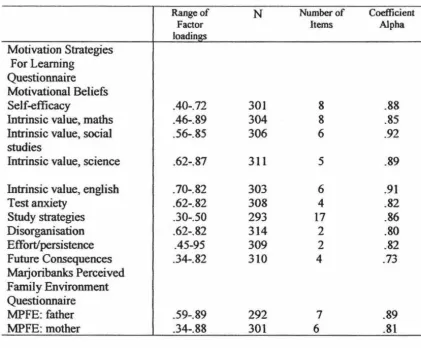
Reliability Estimates and Range of Factor Loadings for Questionnaire Scales
Intercorrelations between the MSQL Scores, Future Consequences Scores and Study Strategies Scores in all Participants
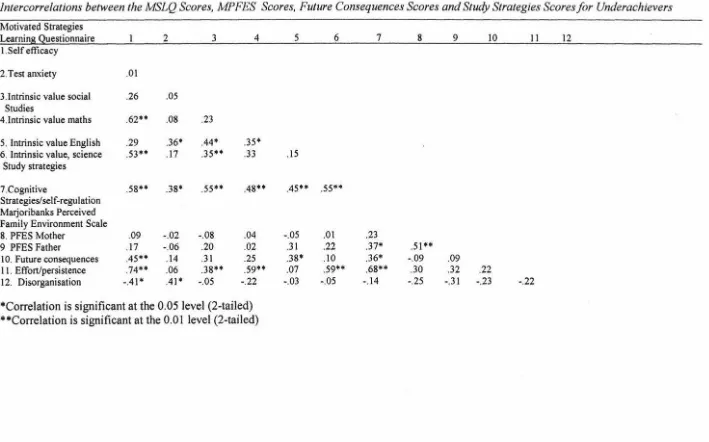
Intercorrelations between the MSQL Scores, Future Consequences Scores and Study Strategies Scores for Underachievers
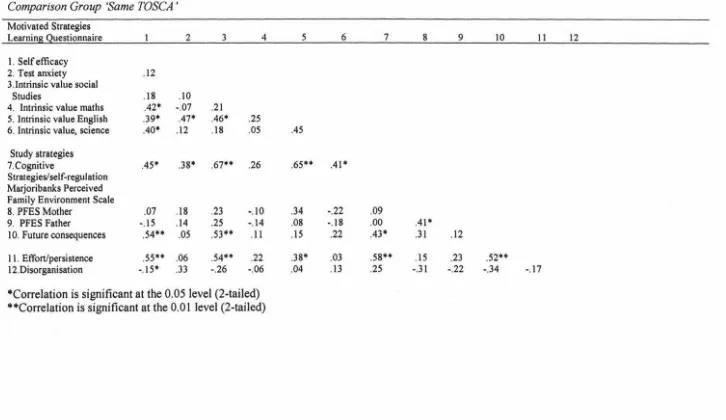
Intercorrelations between the MSQL Scores, Future Consequences Scores and Study Strategies Scores for
'Same TOSCA'
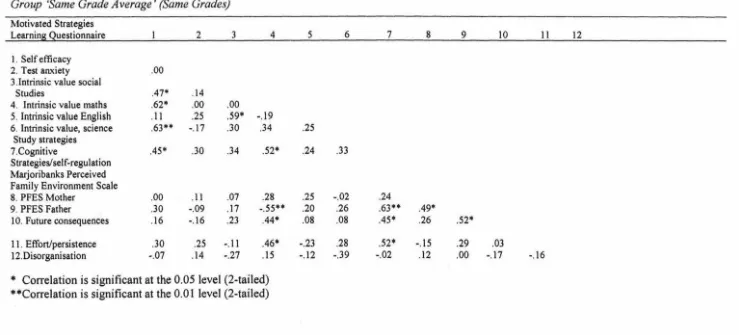
Intercorrelations between the MSQL Scores, Future Consequences Scores and Study Strategies Scores for 'Same Grade Average'(Same Grades)
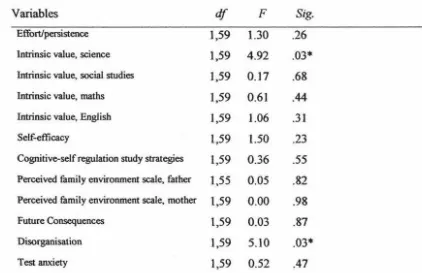
Results of analysis of variance for Underachievers and Same TOSCA group at Significance Level p<.05 for the Dependent Variables
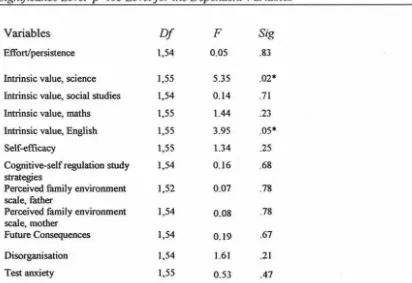
Results of ANOV A between Underachievers and Comparison Group: 'Same GA' at Significance Level p<.05 level for the Dependent Variables
Standardised Grade Averages and TOSCA scores of the Underachievers and Matched Comparison Groups
Pattern Matrix of Maximum Likelihood Factor Analysis of the Marjoribanks Perceived Family Environment Scale
Maximum Likelihood Factor Analysis of Scales
Table B.4
Table B.5
Maximum Likelihood Factor Analysis of Scales
Pattern Matrix for Maximum Likelihood Factor Analysis of Future Consequences
102
List of Appendices
Appendix A 84
Information Sheet 85
Consent Form 86
Demographic Questionnaire
87
Index for Questionnaire 88
Questionnaire
89
Oral Instructions
97
AppendixB
98
Abstract
This study explored academic underachievement of fourth form boys in male secondary schools within the Auckland area There were two aspects to this study; firstly, to identify students who are underachieving relative to their abilities and secondly, to explore possible psychological differences between underachievers and non-underachievers. An underachiever for the purpose of this study is a student who is achieving lower grades than expected in accordance with his abilities (McCall, Evahn & Kratzer, 1992).
598 of the 770 students enrolled in the participating schools had the necessary data for regression analyses to identify underachievers. Of the 598 students with valid data, 315 consented to participate in the questionnaire. The sample for this study comprised 315 fourth form boys. A discrepancy model using regression analysis was carried out on the 315 students to identify underachievers within the schools. 82 students were identified as underachievers using this method, which resulted in 13.9% of the sample being defined as underachievers. In addition, a self-report questionnaire was administered to the 770 students. The questionnaire measured six psychological dimensions that have been identified in previous research to be related to academic achievement. The responses of the underachievers and
non-underachievers were compared to ascertain whether these two groups differ on the psychological dimensions measured. These psychological constructs measured in the questionnaire included study strategies (cognitive/self-regulation,
persistence/effort, and disorganisation), social support, self- efficacy, test anxiety, intrinsic motivation/interest in school subjects, and outcome expectancies. There was a significant mean difference between non-underachievers and underachievers on the disorganisation scale. This finding suggests that underachievers had more disorganised study habits than their non-underachieving comparison group. There were also significant mean differences between underachievers and
Introduction
Academic underachievement
Academic achievement is considered within Western culture to be an important step in one's life course, whereby great significance and worth is placed on an
individual's ability to achieve (Covington, 2000; Harackiewicz & Barron & Elliot, 1998). These performance oriented values induce many adolescents to judge their worth as students by the grades they receive (Covington, 2000; Harackiewicz et al., 1998). Accordingly, those adolescents who may not be performing to their ability levels or potential in their secondary school years may be adversely affected. These lower than expected outcomes by some students may detrimentally affect their self-efficacy and outcome expectancies, which may result in an undesirable downward spiral effect whereby motivation to study and study skills could also be diminished, resulting in lowered grades. In addition, underachieving students may make internal attributions about their abilities with the possibility that they give up trying because they believe that they have no control over their academic performances (learned helplessness) (Mineka & Henderson as cited in Covington, 2000; Weiten, 1995). Therefore, it seems important to identify those students who are not reaching their potential so they can be given opportunities to help reach their potential, thus preventing any possible downward spiral in either achievement or loss of belief in their abilities. Underachievement (or not performing to one's academic capabilities) also has the potential to adversely affect secondary students' future decisions
Identifying underachievers
Academic underachievement traverses countries, gender, socioeconomic status, race and culture (Carr, Borkowski & Maxwell, 1991; Francis, 2000; Noble & Bradford, 2000; Rimm, 1986). However, academic underachievement appears to be more specific to males. The ratio of underachievers is generally two or three males for every female (McCall et al., 1992; Noble & Bradford, 2000). Research has found differences in educational achievement between girls and boys in spite of their comparable IQ test scores. Moreover, girls do better than boys in each ethnic group, particularly in English (Education Review Office, 1999; McCall et al, 1992; Noble &
Bradford, 2000). Two thirds of students who attend reading recovery programs in New Zealand are boys (Education Review Office, 2000; Education Review Office,
1999). Furthermore, the relative underachievement of boys to girls in England has been described as an educational crisis (Noble & Bradford, 2000). Boys are
achieving less than girls in most subjects, but especially in English and other subjects that call for higher level language and organisational skills. The consequences of failing to investigate underachievement of boys will be detrimental to both the underachievers and society. The likely societal consequences include loss of potential and talent in a changing workplace. The possible consequences to the individual include lost opportunities, experiences and low-paid jobs in a society that demands workers who are highly educated, well organised and communicative; the very skills boys are lagging behind in (Education Review Office, 2000; Francis, 2000; McCall, Beach & Lau, 2000; Noble & Bradford, 2000). Accordingly,
addressing the issue of underachievement in secondary school boys is a focus of this study.
Wilson and Cone ( 1984) assert that the factors that may contribute to academic success and failure cannot be accurately researched without a valid discrepancy measure. In addressing underachievement as a problem, it is necessary to investigate both achievement and ability information to ascertain which students are not
achieving as well as they could, using objective and valid discrepancy measures. The Dictionary of Psychology (Chaplin, 1985) defines an underachiever to be a person who does not perform at the level indicated by his or her aptitude. Although the conceptual definitions of academic underachievement in the literature appear to be similar, it appears that operational definitions on underachievement are
Lau, 2000; Peters & Van Boxtel, 1999). McCall et al. (2000) argue that empirically, very little is known about underachievement and assert that "systematic, broad-based methodologically sophisticated research on underachievers per se is generally
lacking" (p. 785). Furthermore, underachievement is not easy to recognize by academic achievement alone. For example a gifted student, especially, may be underachieving while scoring perfectly averagely in comparison to peer's
achievement test scores (Peters & Van Boxtel, 1999). Moreover, previous research on underachievement found that the highest proportion of underachievers were found among the students with average ability (Noble & Bradford, 2000). Therefore, it seems important to explore methods that can validly identify those students who may not be performing to their capabilities across the whole range of student ability levels. This is one of the aims of this study.
Once underachievers have been accurately and validly identified, this research aims to explore possible mechanisms that may be linked with individuals who are not performing to their respective abilities. The constructs that this study will focus on that are predicted to influence academic performance include; study strategies/skills, social support, self- efficacy, intrinsic motivation/interest in school subjects, test anxiety and outcome expectancies. The rationale for examining these variables is primarily based on prior research that suggests that all these variables have positive relationships with academic achievement (Anderman & Midgeley, 1997; Archer,
1994; Covington, 2000; Gohm, Humphries & Yao, 1998; MiJler, Greene, Montalvo, Ravindran & Nicholls; 1996; Pintrich & De Groo~ 1990; Reynolds, 1999; Stanton,
1999; Wentzel, 1998; Zimmerman, 2000). Since these variables have been
associated positively with academic achievement, it seems reasonable to suggest that these same variables could have negative relationships with academic
underachievement In addition, the variables selected for this study are closely aligned with certain characteristics of underachievers. These include lack of persistence and failure to implement problem solving strategies (study strategies), lower educational and occupational aspirations and lack of integration toward goals (outcome expectancies); low perception of abilities (by self-efficacy); and
anxiousness (test anxiety).
Chapter2
Literature Review
Underachievement
Although researchers seem able to agree on a conceptual definition, variances can be
found when it comes to operationally defining underachievement for research
purposes (Butler-Por, 1993; McCall et al., 1992; Peters & Van Boxtel, 1999). The
general conceptual definition of an underachiever is the student who performs less
well than expected on the basis of their ability. However, the measures defining
academic underachievement seem to vary. Underachievement has been defined as
the discrepancy between an intelligence test score and school results or achievement
test scores. The discrepancy is often indexed as one standard error of estimate below
the value predicted on the basis of their test scores. Other definitions include: the
difference between two standardised measures; the differenee between a standardised
measure and performance on some nonstandardised measures; and the difference
between two nonstandardised measures (Butler-Por, 1993; Colangelo, Kerr,
Christensen & Maxey, 1993; Peters & Van Boxtel, 1999). Each method by its very
nature will operationally define underachievement differently. Consequently, each
method will likely identify different students as underachievers. This means that
unless researchers all use the same methods to identify underachievers, each study
will be classifying underachievers inconsistently. These inconsistencies of
definitions within the literature, combined with varying sample characteristics (e.g.
gifted underachievers versus those that cover the range of abilities) complicates the
issue of identifying underachievers accurately and reliably. Hence replication of
various studies will be difficult. For example, Annesley et al. compared( as cited in
McCall et al., 1992), four different methods/measures for identifying underachievers
and found that only 16 of the 57 underachievers classified under one of the four
definitions were classified by all four definitions. Due to the varied procedures used
to define underachievers, and the varying sample populations used, past studies
claiming the defining characteristics of their particular identified underachievers,
may not be generalisable across studies. For example, if one study defines
underachievers using the arbitrary split method (i.e., those students who score above
age level) and another study uses the regression definition (those students whose grades are more than one standard error of estimate below the value predicted on the basis of their test scores) they will have different classification outcomes for
underachievers (McCall et al., 1992). It is therefore also likely that as underachievement has different meanings for the two studies, each study' s underachievers will differ in their characteristics. This makes it difficult to find meaningful relationships between underachievement and other salient factors such as personal, behavioural, or environmental variables.
The stability of underachievement offers further definition complications. Because underachievers do not learn as much in school as expected, their mental ability may decline to match their grades, thereupon they wiJJ no longer be underachieving. For example, decreases in performance have been observed via percentile scores, which decline steadily when students begin underachieving (McCall et al., 1992; Rimm, 1986). The possibility of excluding those individuals that have been underachieving for a long period of time is a crucial consideration regarding the construct of
underachievement. A further important factor to consider is that these chronic underachievers are possibly the students who need identifying the most. Any measure that is cross sectional in nature as opposed to longitudinal may exclude these long- term underachievers. Although longitudinal research is more likely to identify the chronic underachievers, it is beyond the scope of this research.
Measuring underachievement
Discrepancy model
Measuring underachievement normally involves using some sort of sort of discrepancy model which involves comparing an individual student's academic achievement with a measure of ability (McCaJl et aJ., 1992) (Refer to Table 1 ). However, some studies have merely used teacher, parent or student ratings to define underachievers. An academic/achievement discrepancy refers to the difference between what a student is predicted to achieve and what they actually achieve as defined by the discrepancy model implemented. A discrepancy model requires two measurements for comparison purposes: a measure of academic achievement and a measure of mental ability.
Academic performance measures
A commonly used measure of academic achievement for the purposes of the
Pintrich & De Groot, 1990). Furthermore, grades can be standardised within schools so they are comparable across schools (McCall et aL, 1992).
Ability measures
There are various ways to measure abilities of an individual. Some form of IQ test is preferable as it relates to a range of mental performances. However, scholastic achievement tests are often used as proxies for IQ tests, as academic achievement is closely related to school performance (McCall et al., 1992). Furthermore,
correlations between specific IQ tests, aptitude tests and achievement tests correspond closely, meriting use of either as a measure for mental ability
(Humphries, 1974; Kaplan & Sacuzo, 1982; Sternberg cited in McCall et aL, 1992).
An important issue concerning both IQ tests and achievement tests is that they are standardised and objective measures of ability. This allows comparisons of school performance (as assessed by grades) with the standardised tests to start from an objective platform to accurately ascertain possible performance discrepancies (or underachievement). One of the commonly used standardised tests for testing students' ability levels used in New Zealand schools is the Test of Scholastic Abilities (TOSCA).
Learning Disabilities
Much of the literature on discrepancies between mental abilities and school
performance is found in the learning disabilities arena Although learning disabilities and underachievement are different concepts, they utilise similar methods in
ascertaining discrepancy in performance. The major difference between the two is that underachievement focuses on students who do not have any apparent learning disabilities, but are not scholastically achieving as well expected based on their ability tests. In contrast, the field of learning disabilities focuses on those students who are not performing to their abilities due to an identifiable learning disorder. Learning disabled students suffer from some sort of learning impairment and are termed non-l~ers (McCall et al., 1992). Since most studies of underachievement revolve around some sort of discrepancy model between performance and ability, as do studies on learning disabilities, some of the methods and definitions for
following table is a summary of the different methods for assessing underachievers
found in the literature.
Tablet
Methods for Measuring Underachievers
Definition Measures Methods Source
Students in each of Used ability or The regression of grades on McCall Beach & the regressions whose achievement tests and test scores was performed Lau (2000).
residuals from the school grades and included separately for the subjects of regression line were general grade average over Chinese, English, and equal to or more than all subjects plus specific math's as well as for total one standard error grades in English and test scores and general below the regression Math's. grades.
line).
Arbitrary absolute IQ test plus reading or Broman Bien, splits; underachievers spelling subtest scores on and Shaunessy defined to be higher the Wide Range cited in McCall, than a certain Achievement Test et al., (1992). minimum on a
measure of mental ability but lower than a certain maximum on a measure of school oerformance.
Children with Look at current IQ scores Ascertain whether IQ scores Rimm (1986). average, above and have a psychologist or have declined ten or more
average and even teacher administer a test points.
gifted abilities who battery. (Weschler Observe if there is a are not performing up intelligence tests) Compare difference of two categories to their capabilities school or more between IQ and
Grades, IQ scores, achievement tests achievement tests, and
Definition Measures Methods Source
Underachievement Intellectual ability was A linear regression equation Lacasse, (2000). was defined as a measured by the MAT-SF was used to identify
statistical (standardised test) and underachievers.
discrepancy academic performance, was between measured by GP A.
intellectual ability,
and academic performance
Talor (1969) Potential often defined in To identify gifted Butler-Par defined tenns of IQ scores and underachievers a large (1993). underachievement achievement on the basis of discrepancy between the
in terms of ability achievement tests and student's school in relation to teacher grades achievements and some
predicted indication of the child's
achievement - one potential such as standard error of intelligence, creativity, estimate below teachers' and parents' expectance based observations is required. in intelligence
quotient
Students whose Using Serenes system, the The students were selected Guerney ( 1985). GPA fell one nominated students' GP A s by participating teachers
category below that were compared with their IQ (students whom teachers felt which was scores (Otis-Lennon group were achieving below a expected were score tests. The Serene standard that the teachers classified as system provides expected had set) were screened underachievers. grades for different IQ score according to Serene's (1953)
cateoories. criteria
Procedures used I .Clinical judgement; 5.regression model to Ross (1995).
for identifying 2.deviation from actual grade determine expected standard achievement- or age level; 3.expectancy score for achievement, ability formula deviation from which is compared with discrepancies by expected grade level based actual achievement score, school on IQ or MA; 4. Difference 6. Percentage lag
-psychologists between actual standard functioning below a certain scores on an ability test and level compared to peers an achievement test,
Pupils who do not To make inter-test Where a pupil's stanine Reid Jackson, attain an academic comparisons for individual combination is outside the Gilmore& level predicted pupils between scores made acceptable margin of error Croft, ( 1981 ). from their on the PAT and performance estimates, teachers should;
measured on the TOSCA, the scores on check the marking and score performance on a both types of measure should conversion ofboth tests; standardised test be converted to stanines as check last years test scores eg. TOSCA, these scores represent broad and teacher ratings; evaluate termed categories of performance. the student's present class underachievers. performance, in an attempt
Definition Measures Methods Source
The current In accurately identifying The following approaches Reid & Elley standard of some students whose perlormance is can contribute to identifying (1991). students' work is lower tl1an expected using test students underachieving; A
often found to be scores, regression effects and comparison of reading below the level at standard errors of percentile ranks with results which they have measurement need to be taken obtained from an individual consistently into consideration_ intelligence test (WISC-R).
performed in the R Comparison of reading
past. scores over the years to
ascertain any significant decline in level score. C. Comparison of reading assessment with those based on other group tests, especially those with less emphasis on reading.
Definition Frequency of regression Assesses the magnitude or Reynolds Of learning prediction discrepancy uses as severity of this discrepancy (1984). disabilities; the discrepancy score the by comparing it against the
An individual residual l"-Yi based on the base rate in the population Not achieving regression of aptitude on from which the correlation commensurate achievement. The discrepancy rxy was derived_
with his/her age Y - Yi is significant when it and ability when equals or exceeds the value provided with SD Za ...J 1-r2 .xy when both appropriate measures (IQ and
Issues to consider when selecting a discrepancy model
Regression to the mean
There are some important considerations to heed when attempting to define and measure underachievement. A crucial consideration is regression to the mean, which is the tendency of extreme scores on one measure to be Jess extreme on a second related measure. The second scores regress or "move" toward their mean. Therefore, if scores on two tests are positively correlated (or related), then individuals who have extreme scores on one test will almost always have a score more in line with the population average (i.e. regress toward the mean") on the other test The extent of the regression toward the mean depends on the strength of the correlation between the two variables. This is pertinent for measuring
underachievement, as most people with extreme lQ scores wiIJ tend to have less extreme achievement levels. That is, achievement measures regress upon lQ. For underachievement to have any meaning, it is important to make allowances for the regression effect. Thorndike (cited in McLeod, 1979) asserts that underachievement needs to be defined "as the discrepancy of actual achievement from the predicted value, predicted on the basis of the regression equation between aptitude and achievement'' (p. 326).
It is clear that due to regression effects, expected achievement will not necessarily be as extremely high or low as the lQ score. Failing to take into consideration
regression effects may result in some students with high IQ scores being incorrectly identified as underachievers. Similarly, students with below average mental abilities are more likely to be under-identified as underachievers. For example, if teachers use standardised test results as a benchmark for assessing students, they may expect that a student who scores 99 in their TOSCA (Test of Scholastic Abilities) should score 99% or thereabouts in their school exams. Therefore measures or methods that fail to consider regression effects will be excluding those students who need
to the mean phenomenon. Methods of underachievement, therefore, need to include regression effects to be useful.
Measurement E"or
Measurement error is an important factor to consider when defining
underachievement. Thus when determining what is an acceptable discrepancy the measurement errors that are inherent in both IQ and achievement/aptitude measures both need to be considered. Wilson and Cone (1984) further explain measurement error through test theory which states that any specific score comprises both the true value and an error element that can either add to the true value of a score, or lower it, thereby making the actual score either too large or too small. The error of
measurement is a computation that predicts the probable range of fluctuation in an individual's test score due to unknown or irrelevant chance factors (Anastasi &
Urbina, 1997). The standard error of measurement is therefore used to estimate the 'reasonable limits' of the true score with any actual attained score. In other words, rather than using an actual attained score of an individual in a test, it is preferable to interpret test results in the context of a range as produced by the standard error of estimate equation. By using the standard error of estimate, when comparing test results against school performance, small differences that may well be attributable to chance are not mistakenly interpreted as significant. Many studies on
underachievement establish the need for a large discrepancy to classifying students as underachievers due to chance errors inherent in single test scores. This
discrepancy is normally at least one standard error of estimate below the predicted school performance, measured by grade average (Butler- Por, 1987; McCall et al., 1992; Reid & Gilmore, 1981; Wilson & Cone, 1984).
Norm Groups
tests rather than discrepant performance (Cone & Wilson. 1981 ). This factor is pertinent for this study, as TOSCAS are the aptitude tests used for this study and have been standardised using NZ norms (Reid, Jackson, Gilmore & Croft, 1981). Furthermore, Cone and Wilson (1984) maintain that comparability of the norm groups is important rather than necessitating the same norm groups for valid comparative purposes between two tests.
Students schooling experiences
A further important point to regard when selecting a discrepancy measure is the number of years a student has been in school. Cone and Wilson (1981) exhort the need for caution with using chronological age as part of a discrepancy model. Not all students start school at the same age and students may progress with their learning at different rates, giving rise to different age groups in various class levels. These factors need to be considered when measuring underachievement. Similarly, Reid and Gilmore (1984) maintain that for the TOSCA test to be a reliable and assessment measure of a student's abilities, it is assumed that all students have had similar opportunities and have had the same exposure to test material. Any measure for underachievement must also be able to ascertain underachievers at all levels of mental ability consistently. For example, measures that systematically over or under identify students at particular IQ levels are inadequate and will produce biased classifications. In order to identify underachievers as accurately as possible, it is judicious to consider all the factors discussed when selecting a method that will
exhibit discrepant achievement.
Summary/Conclusion
The regression analyses method suggested by Wilson and Cone (1984) incorporates all the important elements necessary in a discrepancy model. Therefore, based on the preceding arguments, the regression analyses appears to be the most
Characteristics of underachievers
There are certain hallmarks of underachievement recognisable in students (Butler-Por, 1987). These behavioural characteristics have been cited in the literature and include; lack of attention in class, not completing assignments, failing to do homework, inconsistent etf ort and performances, poor or nonexistent study skills, disruptiveness, lateness and absenteeism (McCall et al., 1992; Rimm, 1986). Previous studies on underachievement have discovered certain defining
characteristics of underachieving students, although some of the findings seem to be contradictory. This may be explained by the heterogeneous nature of
Table 2
Characteristics of Underachievers
Characteristics of underachievers Lower opinions of their
abilities/competence
Lower educational and occupational desires and expectations
Think less about their future careers
Poor self-concept and low self-esteem
Self critical. Fear of failure/ success
Anxious/nervous
Unrealistic standards
Lack of persistence External locus of control
Inadequate problem solving strategies
A less positive attitude toward their high school education.
Lack of integration toward goals
Table 3
Parental Characteristics of Underachievers
Parental characteristics of underachievers
Indifference or disinterest Low affection
Neutral to negative attitudes to education or conversely, overemphasis on achievement Parental disagreement, conflict
Source
Butler & Por (1993 ); McCall et al. (1992).
Colangelo et al. ( 1993); Gohrn et al.
(1998); McCall et al. (1992).
McCall et al. (1992).
Butler & Por (1993); McCall et al. (1992); Peters & Van Boxtel (1993), McCall et al. (1992).
McCall et al, (1992); Peters & Van Boxtel, (1999).
McCall et al. 1992
Peters & Van Boxtel (1999); McCall et
al. (1992).
Peters & Van Boxtel (1999).
Colangelo et al., (1993).
Butler-Por, (1993).
Source
Of particular interest to this study regarding characteristics of underachievers is recent research which suggests that (McCall et al., 1992) whilst controlling for both ability and grades, underachievers, relative to their comparison groups, lacked persistence in the face of challenge. Within the realms of study, persistence refers to a continued application to learning when the going gets cognitively tough (Elliot, McGregor & Gable, 1999). A more recent study found a tendency for the stability of underachievement to be higher for different subjects, especially the harder ones, in their study on underachievers (McCall et al, 2000). These authors suggest that this indicated a need for further study on the persistence of underachievement pertaining to the extra effort and challenge needed in these more difficult subjects in light of the finding that lack of persistence appears to be a characteristic of underachievers.
Lack of persistence may be due to a variety of factors. The psychological constructs selected for this study are associated with certain defining personality characteristics of underachievers, in addition to their positive relationships with academic
performance. By measuring the constructs that are associated with characteristics of underachievers as well as academic achievement, further insight into the
underachievement issue may be found. For example, underachievers' lack of persistence may influence their study strategies. Contrastingly, underachievers' levels of the psychological constructs in this research may also influence Jack of persistence. For example, could lack of persistence be related to parental social support (too much or too little)? Do these underachieving students think that there is little point in doing well at school (outcome expectancies) and fail to persist at
difficult or boring tasks? Or do they believe that they lack the capabilities to perform (self-efficacy)? Do these students perform less well than expected due to test
anxiety/poor.study skills and are those poor study skills related to lack of
persistence? This study's constructs also involve other personality traits found to be associated with underachievement These include lower educational and
personality traits found in underachievers in conjunction with selt~fficacy, outcome expectancies, study strategies, intrinsic motivation, and social support could be a useful future research project
Psychological constructs and llllderachievement
Social Support
Evidence in the literature suggests social support may contribute to academic performance (Archer, 1994; Levitt, Guacci-Franco & Levitt, 1994; Pintrich & De Groot, 1990; Reynolds, 1999; Stanton, 1999; Veil & Baumann (Eds.), 1992; Wentzel, 1998; Zimmerman, 2000). It follows that if social support is linked to academic achievement in a positive way, then academic underachievement could be linked to social support in a negative way. Social support refers to the clarity or certainty with which an individual experiences being loved, valued and able to collllt on others should the need arise (Veil, H.O.F. Baumann, U. (Eds.)., 1992). Social support is a broad construct that embraces one's network of supportive family, friends and peers ( Chellllg, 1995). Pertinent to this study is the suggestion that perceived social support from students' parents, teachers, and peers has been found to positively influence adolescents' academic outcomes (Cheung, 1995; Cutrona, Colangelo, Assouline & Russell, 1994; Reynolds, 1999; Wentzel, 1998).
achieve at school. Also, in accordance with attachment theory, social support
provides the psychological security (reassurance of worth) that helps students' self
confidence and their self concepts, thus providing them with the ski1Is to cope with
the demands of scholastic requirements (Cutrona et al, 1994; Levitt et al., 1994;
Wentzel, 1998).
Reynolds' (1999) study identified how the motivational support of families and
teachers helped students' to persist in their scholastic work and goals. This finding
may help explain the premise that there may be a link between lack of social support
and Jack of persistence. It seems reasonable that if parental support helps students to
persist in their school work, a lack of parental social support in an adolescent's
crucial schooling years may contnbute to students' lack of persistence in their
schoolwork and possible underachievement An apparent parental disinterest in
adolescent students' schoolwork is likely to affect students' aspirations, their
motivation to do weJJ, and other related variables (self concept, informational help)
which in tum will affect persistence i.e. "What's the point?" This reasoning ties in
with the literature on academic underachievers, which suggests that a parental
characteristic of underachievers is indifference to education and scholastic
achievement (McCall et al., 1992). Moreover, studies on how family environments
affect students' academic aspirations and outcomes have found that students'
academic aspirations and outcomes are positively related to supportive family
environments which are in harmony with the school's learning environment
(Marjoribanks, 1998). Similarly, Kellaghan, Sloane, Alvarez, and Bloom (cited in
Marjoribanks, 1998) have suggested that "when the home and school have divergent
approaches to life and to learning, children are likely to suffer in their school
learning. Conversely, when home and school have similar emphases on motivation
and learning, children are likely to do well" (p.145). Conceptually contrasting with the relationship between a lack of social support and underachievement, is the
apparent relationship between underachievement and parental overemphasis on
achievement. McCall et al. (1992) have found in their research on
underachievement, that whilst a defining parental characteristic of underachieving
students, is lack of interest in schoolwork, the opposite end of this spectrum is those
parents who are too interested. These parents are preoccupied with achievement, and
tend to place too much pressure on their children. Other aspects of parents that place
overprotective and too helpful. An intention of this study is to empirically explore the relationships between perceived parental social support and adolescents' academic achievement and underachievement.
Motivation
Previous research has demonstrated a strong relationship between high interest and enjoyment of a topic (otherwise known as intrinsic motivation) and motivation for that topic (Pintrich & De Groot, 1990; Remedios, Lieberman & Benton, 2000). Previous research also suggests that there is an association between
underachievement and lack of interest and enjoyment of subjects (Gohm, Humphries & Yao, 1998). Intrinsic motivation for a task has been defined by some theorists as an individual's self reported ratings of interest and enjoyment of a task (Remedios et al., 2000).
Students who are intrinsically motivated by their schoolwork are more likely to place more importance, interest and understanding of their coursework than those students who are not as intrinsically motivated by schoolwork. Consequently, they are also more likely to exert more effort Effort has been cited as a gauge of motivation to learn (Lambert & McCombs (Eds.), 1998). It has been suggested that interest and effort may have positive effects on each other. For example, if students are intrinsically motivated by their coursework in a particular subject, it is likely that they will they may become more attentive and diligent with their studies and as a result perform at a higher level. These higher performances may further influence the student's motivation in that course, with a possible upward spiral effect of
academic performance in other less intrinsically motivating courses (Harackiewicz et al., 1998).
engaging in more metacognitive activity and utilising cognitive strategies to a greater
degree, are more likely to have higher academic results than those students who do
not engage in cognitive strategies to the same extent. Conversely, the students who
do not find their schoolwork intrinsically motivating are less likely to engage in and
persist at their schoolwork. Consequently, these same students may not perfonn
academically in accordance with their ability levels.
Self-efficacy
Previous research suggests that self-efficacy is positively associated with academic
achievement. High self-efficacy in students has been found to be positively related
to persistence, level of effort, motivation, and cognitive strategies (Archer, 1994 ~
Pintrich & De Groot, 1990; Stanton, 1999; Zimmennan, 2000). Conversely, low
self-efficacious students should have negative associations with academic
achievement. It is also predicted that low self-efficacy would be related to
underachievement as low self-efficacious students would have lower levels of
persistence, effort and cognitive strategies than the highly self-efficacious students.
Furthermore, underachievers have been associated with a lack of persistence,
(McCall et aJ., 1992) which may be associated with low self-efficacy.
The concept of self -efficacy is a component ofBandura's (cited in Zimmennan,
2000) social cognitive theory. Self-efficacy has been defined by Bandura as
"personal judgements of one's capabilities to organise and execute courses of action
to attain designated goaJs" (p.83). Perceptions of self-efficacy can differ across
various aspects of a person's life. For instance, it is conceivable to have high
self-efficacy in a specific domain, such as academic ability, yet low in another domain,
such as musical ability (Zimmerman, 2000). According to Bandura (cited in
Covington, 1999) the most influential source of self-efficacy is one's past
performance. Favourable results generally enhance self- efficacy, whilst less
favourable results lower self-efficacy. How individuals interpret their perfonnance
results affects their self-beliefs, which can then affect their subsequent perfonnance.
According to attributional theory, if the individual attributes their outcome to poor
ability, their self- efficacy is likely to suffer. However, if they attribute their poor
suffer as badly (Schunk, cited in Stanton, 1999). Further, individuals who already have a high sense of self-efficacy are less likely to be affected by poor performance results.
Perceptions of one's abilities to successfully perform an activity (self-efficacy beliefs) affect behaviour in a myriad of ways. For example, they can influence a person's willingness to undertake an activity, the amount of effort they will expend, their level of persistence when faced with difficulties, and their resilience in the face of adversity (Miller et aL, 1996~ Pajares, 1996; Stanton, 1999). Individuals with high self-efficacy are more likely to exhibit greater amounts of effort, persistence and resilience than those with less self- efficacy (Pajares, 1996; Stanton, 1999; Zimmerman, 2000). These fuctors wil1 positively affect performance of a given activity. Individuals with high self-efficacy are consequently more likely to achieve higher levels of performance in the goals they are seeking to attain (Pajares, 1996). Prior studies on self- efficacy demonstrate the mediational role it has to play in contributing to academic achievement These studies suggest that high
self-efficacious students used more cognitive strategies, worked harder, embraced more challenging roles and were more persistent in their academic tasks than less self-efficacious students (Pintrich & De Groot, 1990; Stanton, 1999; Zimmerman, 2000). lt is evident how these behaviours could combine to positively affect academic grades. Thus, high self- efficacy is able to play a facilitative role in creating an upward spiral effect on academic achievement. Conversely, a lowering of one's self-efficacy as a consequence of poor academic performance could create a spiral effect whereby study efforts and skills are also lowered, resulting in a new set of lowered marks. Hence, self-efficacy has an important facilitative role for student academic outcomes.
Outcome expectancies/future consequences
individual's expectancies for success and the incentive value of a particular task which in tum influence the persistence of achievement behaviour (Anderman & Midgely, 1997; Weiten, 1996). For these reasons, expectancy value theorists maintain that positive expectancy/value outcomes are motivational (Wigfield & Eccles, 2000). Therefore, outcome expectancies of individuals may play an important and instrumental role in their academic performances. The second component of outcome expectancy is essentially the incentive value of a specific task. Outcome expectancy encompasses both an individual's beliefs in their ability to succeed, and their beliefs that succeeding at the specified task is worth expending effort for. The first component of outcome expectancy is covered in this study by the construct self-efficacy. The second component of outcome expectancy wi11 be measured by the scale future consequences. Previous research suggests that students who believe their class-work to be useful and valuable perform at a higher level than those who do not, illustrating the value of academic expectancy outcomes in school performance (Anderman & Midgeley, 1997; Miller et al., 1996; Pintrich & De Groot, 1990; Raynor, Atkinson & Brown, 1974). Previous research has found that those students who valued future goals more than other students had higher grades and reported higher study efforts than those who did not (Miller et al., 1996). Future consequences have been defined by Miller et al. ( 1996) as "anticipated and valued distant consequences thought to be at least partially contingent on task performance but not inherent in the performance itself' (p390). They embrace such goals as long term financial rewards, gaining entrance to a college (university), and attaining future career objectives.
thought of as female domains. This poses two potential problems for boys~ a
perceived threat to their maleness, and uncertainty for their future job prospects
(Francis, 2000; Noel & Bradford, 2000). There exist two opposing theories as to
how the diminished demand for traditionally masculine unskilled jobs may affect
sectors of adolescent boys: The first theory is that due to the Jack of demand for
unskilled work boys with average or below average school marks may have low
expectations for gaining a job, and so tend not to try at school. The second
proposition is that some boys are unaware of the changing demands in the
workplace, and therefore believe they will be able to gain employment irrespective of
their lack of qualifications, so may feel that they do not need to work on their school
grades (Francis, 2000; Noel & Bradford, 2000). Both goal setting and discussing
aspirations for the future beyond school have been advocated as motivational tools in
schools to aid students in acquiring positive outcome expectancies and future
consequences (Anderman et al., 1999; Miller et al., 1996). Previous research has
found positive correlations between students' future consequences scores and
schoolwork (Miller et al., 1996).
Study strategies
Evidence suggests that proficient study skills and habits also positively affect
students' academic perfonnances (Covington, 2000; Pintrich & De Groot, 1990).
Although study skills seem an obvious requirement for academic success, research
has found that many academically able students are unable to produce school results
of which they are capable due to inadequate study skills (Crittenden, Kaplan &
Heim, 1984). These able students may well be underachieving due to their poor
study skills. Therefore study skills have been included as a construct in this study as
a possible link to academic achievement and underachievement Inadequate study
skil1s may arise for various reasons. Some students may simply lack the necessary
knowledge on how to study, others may lack the motivation and persistence needed
for effective study strategies. Persistence is a salient characteristic of
underachievers, therefore, investigating students' study habits may reveal an
important understanding of underachievement The term study strategies for the
purposes of this research include cognitive strategy use and self-regulation strategies
as measured by the Motivated Strategies Learning Questionnaire (MSLQ). In
achievement goal theory. Disorganisation is also included as a study strategy, with
negative relationships to academic outcomes (Elliot, McGregor & Gable. 1999).
The learning strategies measurements in the MSQL are derived from a general
cognitive model of learning and information processing whereby the student is
viewed as an active processor of information whose cognition's and beliefs impact
the actual teaching given (Pintrich., Smith., Garcia & McKeachie, 1993 ). Essentially, cognitive self- regulation necessitates that students are proactively engaged in their
own learning. This involves planning monitoring and analysing both their
schoolwork and homework (Pintrich & De Groot, 1990; Zimmerman & Schunk (Eds.), 1989). Cognitive strategies comprise different strategies that students utilise
for processing information they have gained from both class lectures and textbooks.
An example of a cognitive strategy is rehearsal (Pintrich et al., 1993). Elliot et al.,
(1999) maintain that persistence and effort study strategies act as mediators between
achievement goals and exam results. They define persistence as a " continued
investment in learning when obstacles such as comprehension difficult are
encountered, and effort refers to the overall amount of effort expended in the process of studying (p.550)". Several theories have been proposed as to why some students
employ favorable study strategies. Elliot et al., ( 1999) assert that students are
motivated to employ healthy study strategies so they can achieve the goals they have set themselves. However, an important part of self- regulation is that students take on the responsibility of achieving their self-set goals (Zimmerman & Schunk, 1989). Literature reviews on underachievement suggest that a characteristic of some
underachievers is their external locus of control, which may inhibit their abilities to
set themselves goals let alone be responsible for their own study skills (McCall et al.,
1992). Measuring both underachievers and achievers' study habits may contribute to
our understanding of why some students are not performing to their capabilities.
Test anxiety
Test anxiety has been conceptualised by Printrich and De Groot ( 1990) as an
affective motivational aspect of learning skills. Test anxiety has also been associated
with cognitive strategy use and effort. One finding is that highly anxious students
put in the same amount of effort and persistence as less anxious students.
Opposingly, it has also been suggested that test anxiety may be a function of
(Pintrich & De Groot, l 990; Rothblum cited in Elliot et al., 1999). Test anxiety may also be related to a lack of self-esteem and self-efficacy, which have also been found
to be defining characteristics of underachievers (McCall et al., 1992).
Underachievers have also been characterised as high in anxiety. Students who suffer
from test anxiety are thought to perform less well in their exams. Students may not
believe they have the abilities to perform well, so when exam time is approaching,
begin to feel anxious which in tum may affect their actual performance in the exams.
Test anxiety therefore has been included as a construct of interest for this research. It
is predicted that underachievers will suffer from test anxiety more than the
non-underachievers will.
Summary
Of all the methods described in Table I for measuring underachievement, the method
that best incorporates the elements considered important to validly identify a
discrepancy is the regression equation. Wilson and Cone (1984) argue the following
reasons why the regression equation method is deemed as the most appropriate for
determining an academic discrepancy. The regression equation is the only method
that takes into consideration regression (to the mean) and measurement errors.
Moreover this method considers error measurement in the predicted as well obtained achievement scores. These authors explain that the regression equation produces the
empirically_determined expected achievement for a particular IQ score and it also
automatically adjusts expected academic scores so that they are less extreme i.e.
regression effects will be incorporated within the relationship. Furthermore, the
more recent research on academic underachievement recommends and uses
regression analyses to identify academic underachievers (Cone & Wilson, 1981;
Lacasse, 2000; McCall et al., 1992; McCall et al., 2000; Reynolds, 1984; Wilson &
Cone, 1984). Regression analyses will be used in this study to identify
underachievers.
Study strategies employed by students are due to a myriad of influences that interact
in complex ways with each other (Elliot et al., 1999). The constructs discussed in
this study are all believed to be influential in students' employment of and
persistence in studying. For example, if a student believes he is able to obtain high
study and employ effective study strategies. In addition, if students are intrinsically
motivated by their coursework in a particular subject, they are more likely to become
more attentive and diJigent with their studies and as a result perform at a higher level
(Harackiewicz et al., 1998). Likewise, students who receive positive social support
achieve psychological security (reassurance of worth) that helps students'
self-confidence and their self-concepts. This in turn conceivably provides students with
the skills to cope with the demands of scholastic requirements including effective
study strategies. Relatedly, it has been found that students who value future goals more than other students had higher grades and reported higher study efforts than those who did not Conversely, students who suffer from test anxiety are more likely
to have poor study skills than students who do not feel anxious sitting examinations.
Since the psychological constructs of this study have positive relationships with
academic achievement, it seems reasonable that these same constructs will have
negative relationships with underachievement As suggested in the literature review,
underachievers have been found to have certain characteristics, which may influence
their self-efficacy, outcome expectancies, study strategies, test anxiety, social
support or intrinsic motivation. The underachievers' responses to this study's
constructs in comparison to the non-underachievers are a focus of this study.
Research Objectives
The primary objective of this study is to identify those students who are
underachieving relative to their mental abilities using regression analyses. Secondly
this study aims to investigate the differences between underachievers and achievers
on the following constructs: self-efficacy, social support, test anxiety, intrinsic
Introduction
Chapter 3
Methodology
An objective of this study was to identify underachieving secondary school males in a New Zealand context. Males were chosen due to their relatively higher
underachievement status compared to females (McCall et al . ., 1992; Noble & Bradford, 2000). Auckland schools were chosen due to their geographic proximity and accessibility to the researcher. The second purpose of this study was to
investigate psychological factors that may contribute to underachievement These were explored via a questionnaire of approximately 40 minutes duration. The use of a single self-report questionnaire in the participating schools was thought to
minimise disruption to schoolwork. The methodology has been separated into the two phases, identifying underachievers, and investigating psychological factors that may contribute to underachievement via a questionnaire.
Participants
Approval to undertake this research project was granted by the Massey University Ethics Committee. Participants were drawn from three Auckland seconclary schools. In compliance with ethical requirements, all students from the participating schools were invited to participate in the questionnaire prior to the first stage of the data
analysis. To be eligible for inclusion of the first stage of data analyses, each fourth form participant needed to have complete school records for all three sets of
requested information. At this stage, many students were eliminated from the study, as they had missing data or had left the participating schools before the fourth form, or had not started until the fourth form, or were simply absent when either the
students are likely to be identified as underachieving (McCall et al., 1992). The schools who had already agreed to participate in this study agreed to allow access to their school records, on the basis that confidentiality of both students and schools
was protected. The school records needed for regression analyses on fourth formers were; third form TOSCA results and fourth fonn school exam results of the core subjects, English, Maths, Social Studies and Science.
Phase 1; U nderacbievement
.
Measures used in discrepancy model
The data needed for the discrepancy model used to identify underachievers were archival and included mental ability tests for a measure of students' abilities and students grade averages as a measure of academic achievement. This infonnation
was accessed from the participating schools' existing records.
Measure of abilities (TOSCA).
The measure of students' ability levels used in this study was the TOSCA (test of scholastic abilities). This test was used in the present study as a measure of
academic ability. The TOSCA is an official standardised test, given to third formers in many New Zealand schools. The normal ages of third form students range from 13 to 14 years. All participating schools had administered this test to students in their third form year. Therefore, schools were able to provide this data to the researcher. The TOSCA_is designed to measure verbal and nwnerical reasoning abilities needed for academic success. Accordingly, test items in the TOSCA are included that assess school-related abilities rather than specific skills taught in the classroom. The TOSCA is a valid test of scholastic abilities as there is evidence that it combines both verbal and nwnerical reasoning abilities that reflect the skills
needed for scholastic achievement (Reid & Gilmore, 1988). Factor analyses revealed that the TOSCA is "heavily saturated with a verbal/educational group factor
providing strong evidence that the test is tapping the kinds of scholastic abilities it was designed to measure". (Reid & Gilmore. 1988, p5). Further, there are high to
Achievement Tests (PAT) battery and WISC-R subtests of arithmetic and
vocabulary. The TOSCA's reliability has been estimated in four different ways. The reliability coefficients for equivalent forms of the tests for secondary tests are .86. The split-half reliability coefficients range from .89 to .93. The Kuder-Richardson Formula 20 coefficients ranged from .90 to .92. Since the TOSCA comprises a wide range of item difficulties, these coefficients indicate reasonably high internal
consistency. The test retest reliability coefficients range from .90 to .92. The standard error of measurement for the TOSCA was calculated at 3 raw score points.
Academic assessments (Standardised grade averages).
Most researchers focus on grade point averages in school exams and or tests as an assessment of student academic achievement (Guemey, 1985; Lacasse, 2000; Miller et al., 1996; McCall et al., 1992; McCall et al., 2000; Pintrich & DeGroot, 1990; Wentzel, 1998). Although grades lack standardisation, the justification for their use is that classroom assessments have ecological validity (McCall et. al., 1992; Miller et al., 1996; Wentzel, 1998; Pintrich & DeGroot. 1990). Grade averages were used in the present study as a measure of academic achievement In addition, grades were standardized (mean ofO, standard deviation of 1), due to possible biases arising from potentially different awarding of grades by different schools. Furthermore, grades were standardised across schools rather than within schools so that the resulting identified underachievers would be more representative of New Zealand male
secondary students, rather than of the particular schools. For example, if grades were standardised within schools, a student who may be an underachiever in their school, may well be a non -underachiever across the schools and vice versa, creating
underachievement as a function of the school they are in rather than
underachievement per se. The standardised, cwnulative grade average (GA) represents the mean GA for English, mathematics, science, and social studies.
Identifying underachievers
scores using ability tests (TOSCAS) compared to grades were defined as
underachievers.
Data Analysis
The regression method suggested by Wilson and Cone (1984) involved the following
procedures:
1. The expected (i.e. average achievement) values were calculated for each
participating student's mental ability using the students' standardised test score
(TOSCA) as the Mental Ability Index. These TOSCA test scores were used to
predict each student's school performance the regression equation (see Figure 1).
2. Averaged school exam marks of each student were standardised across the
schools on the basis of the entire sample available and were a measure of school
performance (converted to z scores). Standardised grades across the schools
were used in the regression analyses in this research for identifying
underachievers. Correlations between the TOSCA scores and achievement
scores were carried out for the regression analyses as well as the means and
standard deviations for both the TOSCAS and the averaged standardised grades.
The correlations. means and standard deviations were needed for the following
regression equation in order to determine a discrepancy figure for each student
3 Regressions of standardised grade averages on the mental ability index were
then calculated using the equation in Figure 1. The following equation gives the
y = r
S/S:c
(IQ-~ +y
Where
Y =the expected achievement for a given IQ r.'CY = the IQ achievement correJation
Sy =the standard deviation of the achievement scores
x =the mean lQ
Sx = the standard deviation of the lQ scores
Y
=the overall mean achievement (Wilson & Cone, 1984).Figure l. Regression/prediction equation
The regression equation produces a predicted grade point average for each student based on his or her ability score (TOSCA). Actual grade point averages that were at least one standard deviation below the expected value depicted performance that was below potential (underachievement). A significant achievement discrepancy as suggested by McCall et aJ. (1992) was any residual standardised grade average that was one standard error of estimate or more below the predicted achievement value (see Figure 2). The [Q (TOSCA) /achievement (standardised grade averages) correlation and the standard deviation of all the achievement scores were data
obtained in the preceding regression analyses equation that were needed to calculate the standard error of estimate. The standard error of estimate is the square root of the IQ/ achievement (r xy) correlation squared multiplied by the standard deviation of all the achievement scores. Any values that were one standard error (or more) below the expected values were classified as a significant discrepancy.
Where SDy = the standard deviation of aJI the achievement scores r.'CJ' = the lQ achievement correlation