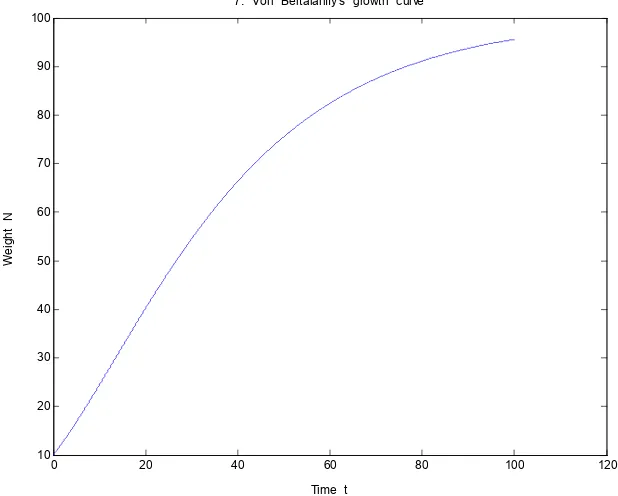
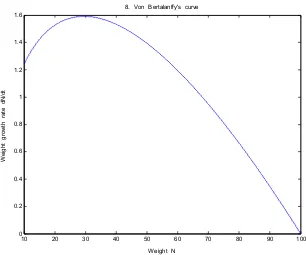
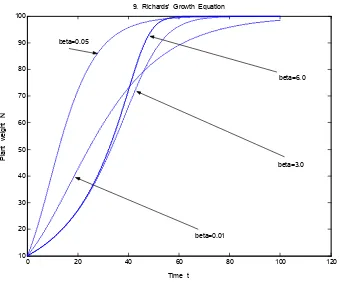
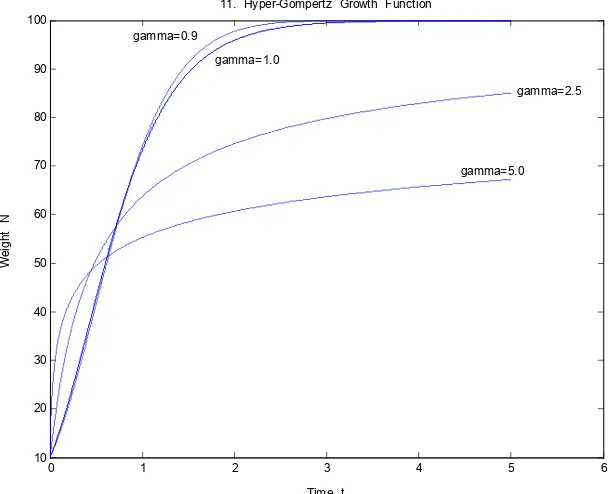
Analysis of logistic growth models
Full text
Figure


Related documents
I am more comfortable implementing pressure injury prevention methods now than I was before the skin-care team project began. I am more knowledgeable about
The non-researcher-teachers are defined as those who have been teaching in Philippine ESL context for at least ten years in a university or basic education school, with experience
emphasize, that because of increasing demands on safety and quality foods, actors of the food and feed chains continuously have to work on innovations of products, processes and
The algorithm generates an infinite road network with multiple tiers, including major highways and minor side roads with infrastructure like traffic signs and utility poles;
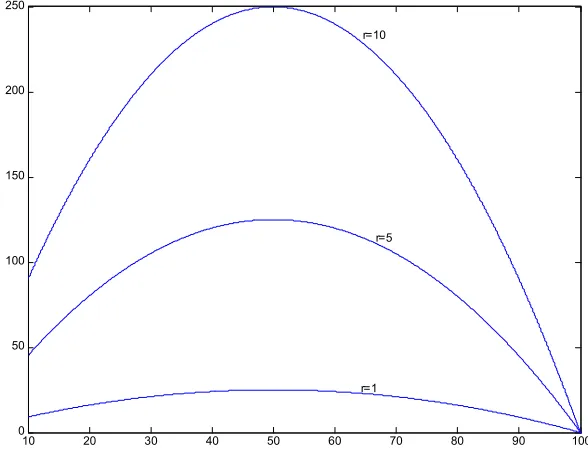
[r]
[r]
(link, compile, tests, analyzes, deploy, …) the software after each change in source code, to ensure its health.. (weather it functions correctly, follows best
Absence of a recurrent indication for cesarean delivery Retrospective cohort of 599 women who were ≥37 wk GA with 1 previous LTCS Overall TOLAC success rate 76% Predicted
