Rochester Institute of Technology
RIT Scholar Works
Theses Thesis/Dissertation Collections
2006
Experimental study of flow boiling heat transfer and
critical heat flux in microchannels
Wai Keat Kuan
Follow this and additional works at:http://scholarworks.rit.edu/theses
This Dissertation is brought to you for free and open access by the Thesis/Dissertation Collections at RIT Scholar Works. It has been accepted for inclusion in Theses by an authorized administrator of RIT Scholar Works. For more information, please contactritscholarworks@rit.edu.
Recommended Citation
ACKNOWLEDGMENTS
I thank the National Science Foundation for providing financial support (CTS
grant 0245642) for this research.
I thank my thesis advisor, Professor Satish G. Kandlikar for giving me the
research opportunity in the field of flow boiling heat transfer and critical heat flux in
microchannels. I also thank him for his patience, encouragement, enthusiasm, and
guidance.
I thank Dave Hathaway and my lab coworkers who gave their time, skills and
dedication to make this project work.
I thank my parents, my extended family, and friends for their excellent support
and encouragement.
I thank my wife, Soon Kuan, and my son, Evan, for standing by me.
TABLE OF CONTENTS
List of Figures ...x
List of Tables ...xxv
List of Symbols ... xxvi
1.0 INTRODUCTION ...1
1.1 Motivation...4
1.2 Objectives ...5
2.0 INTRODUCTION TO FLOW BOILING ...6
2.1 CHF...11
2.1.1 Subcooled CHF...12
2.1.2 Saturated CHF...14
3.0 LITERATURE REVIEW ...17
3.1 Flow Boiling Heat Transfer Studies in Minichannels and Microchannels ...19
3.2 Flow Boiling Critical Heat Flux Studies in Minichannels and Microchannels ...22
3.3 Critical Heat Flux Correlation ...25
3.4 Flow Boiling Correlation ...29
4.0 DISSERTATION STATEMENT ...31
5.0 APPROACH ...32
5.1 Quantitative CHF and Heat Transfer Measurement ...33
5.1.1 Refrigerant-123...33
5.1.2 Water...33
5.3.1 CHF...36
5.3.2 New CHF Correlation...36
5.3.3 Flow Boiling ...37
5.4 Modeling CHF ...38
6.0 EXPERIMENTAL FACILITY DEVELOPMENT ...42
6.1 R-123 Experimental System ...42
6.1.1 Test Section Design ...45
6.1.2 Pump ...55
6.1.3 Flow Visualization ...55
6.1.4 Data Acquisition System and System Calibration...56
6.1.5 Leak-Checking...61
6.1.6 Heat Loss ...62
6.2 Water Experimental System ...65
7.0 EXPERIMENTAL PROCEDURE ...67
7.1 R-123 Experimental System ...67
7.2 Water Experimental System ...68
8.0 DATA REDUCTION ...70
9.0 UNCERTAINTY ...73
9.1 R-123 Experimental System ...73
9.2 Water Experimental System ...74
10.0 RESULTS ...75
10.1 Flow Boiling Heat Transfer – Water ...79
10.3 Flow Boiling Correlation – R-123 ...127
10.4 Critical Heat Flux...146
10.4.1 Water Data ...147
10.4.2 CHF Correlation for Water Data...157
10.4.3 R-123 Data ...170
10.4.4 Partial CHF Transitional Images ...198
10.4.5 CHF Correlation for R-123 Data ...220
10.4.6 New CHF Empirical Correlation ...229
10.4.7 New CHF Model...237
11.0 RESEARCH IMPLICATIONS ...261
12.0 CONCLUSIONS...263
12.1 Flow boiling heat transfer ...265
12.1.1 Water...265
12.1.2 R-123...266
12.2 Flow boiling correlation, R-123...266
12.3 Critical Heat Flux...267
12.3.1 Water and R-123...267
12.4 Critical Heat Flux Correlation ...268
12.4.1 Water...268
12.4.2 R-123...268
12.5 New Critical Heat Flux Correlation...268
12.5.1 R-123 and water...268
13.0 REFERENCES ...270
14.0 APPENDIX...276
14.1 Appendix A...276
14.2 Appendix B ...280
14.3 Appendix C ...281
List of Figures
Figure 2.1 Typical pool boiling curve Figure 2.2 Flow boiling curve
Figure 2.3 Schematic of subcooled flow boiling near CHF conditions
Figure 2.4 Flow structure for annular flow-type CHF in a uniformly heated vertical tube Figure 2.5 Two-phase flow patterns in the heated channel
Figure 5.1 Forces acting on a liquid-vapor interface Figure 6.1 Schematic of experimental facility
Figure 6.2 Schematic of copper block with glass cover Figure 6.3 Schematic of copper block with microchannels Figure 6.4 Test section assembly with glass cover
Figure 6.5 Schematic of side view of copper block with holes for thermocouples Figure 6.6 Cross section views of inlet restriction details
Figure 6.7 Test section assembly with PVC cover Figure 6.8 Thermocouple calibration plot
Figure 6.9 Pressure transducer calibration plot Figure 6.10 Heat loss curve for test section
Figure 6.11 Schematic of experimental facility for water Figure 8.1 Single-phase flow and flow boiling in microchannel
Figure 10.1 Plot of pressure drop across microchannels against time for heat flux of 151.0 kW/m2 and mass flux of 33.4 kg/m2s, water.
Figure 10.3 Microchannel surface temperatures with and without the 6.1% PDEs in manifold. G = 362.9 kg/m2s, q" = 335.9 kW/m2, water.
Figure 10.4 Microchannel surface temperatures with and without the 6.1% PDEs in manifold. G = 362.9 kg/m2s, q" = 352.9 kW/m2, water.
Figure 10.5 Microchannel surface temperatures with and without the 6.1% PDEs in manifold. G = 362.9 kg/m2s, q" = 370.2 kW/m2, water.
Figure 10.6 Microchannel surface temperatures with and without the 6.1% PDEs in manifold. G = 362.9 kg/m2s, q" = 388.2 kW/m2, water.
Figure 10.7 Microchannel surface temperatures with and without the 6.1% PDEs in manifold. G = 144.4 kg/m2s, q" = 151.9 kW/m2, water.
Figure 10.8 Microchannel surface temperatures with and without the 6.1% PDEs in manifold. G = 144.4 kg/m2s, q" = 171.5 kW/m2, water.
Figure 10.9 Microchannel surface temperatures with and without the 6.1% PDEs in manifold. G = 144.4 kg/m2s, q" = 188.0 kW/m2, water.
Figure 10.10 Microchannel surface temperatures with and without the 6.1% PDEs in manifold. G = 144.4 kg/m2s, q" = 206.9 kW/m2, water.
Figure 10.11 Inlet pressures of the inlet manifold with and without the 6.1% PDEs in manifold, water.
Figure 10.12 Comparing microchannel surface temperatures with and without the 7.7% PDEs in manifold. G = 411.7 kg/m2s, q" = 71.2 kW/m2, R-123.
Figure 10.13 Comparing microchannel surface temperatures with and without the 7.7% PDEs in manifold. G = 411.7 kg/m2s, q" = 89.8 kW/m2, R-123.
Figure 10.14 Comparing microchannel surface temperatures with and without the 7.7% PDEs in manifold. G = 411.7 kg/m2s, q" = 108.6 kW/m2, R-123.
Figure 10.15 Comparing microchannel surface temperatures with and without the 7.7% PDEs in manifold. G = 436.4 kg/m2s, q" = 98.9 kW/m2, R-123.
Figure 10.16 Comparing microchannel surface temperatures with and without the 7.7% PDEs in manifold. G = 436.4 kg/m2s, q" = 108.2 kW/m2, R-123.
Figure 10.18 Comparing microchannel surface temperatures with and without the 7.7% PDEs in manifold. G = 436.4 kg/m2s, q" = 126.9 kW/m2, R-123.
Figure 10.19 Inlet pressures of the inlet manifold with and without the 7.7% PDEs in manifold, R-123.
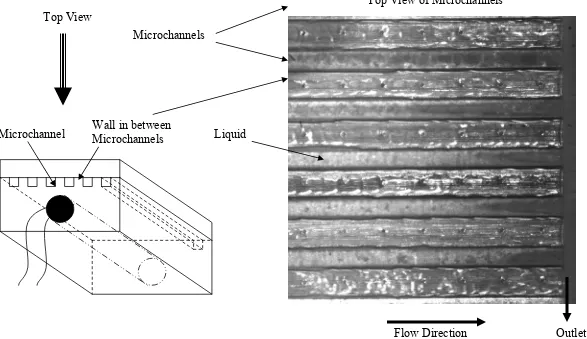
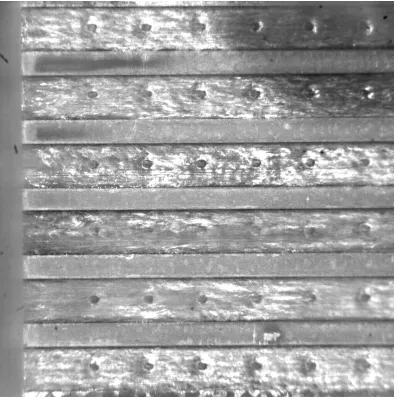
Figure 10.20 Schematic of microchannels and a picture showing the top near inlet view of the microchannels captured by the high-speed camera
Figure 10.21a Flow reversal without PDEs in manifold. Successive frames from Figs. 10.21a to j taken at 2 ms time intervals illustrating unstable flow in a set of six parallel horizontal microchannels. G=411.7 kg/m2s, q"=90.0 kW/m2, Ts= 59.3 °C, R-123.
Figure 10.21b Flow reversal without PDEs in manifold. Successive frames from Figs. 10.21a to j taken at 2 ms time intervals illustrating unstable flow in a set of six parallel horizontal microchannels. G=411.7 kg/m2s, q"=90.0 kW/m2, Ts= 59.3 °C, R-123.
Figure 10.21c Flow reversal without PDEs in manifold. Successive frames from Figs. 10.21a to j taken at 2 ms time intervals illustrating unstable flow in a set of six parallel horizontal microchannels. G=411.7 kg/m2s, q"=90.0 kW/m2, Ts= 59.3 °C, R-123.
Figure 10.21d Flow reversal without PDEs in manifold. Successive frames from Figs. 10.21a to j taken at 2 ms time intervals illustrating unstable flow in a set of six parallel horizontal microchannels. G=411.7 kg/m2s, q"=90.0 kW/m2, Ts= 59.3 °C, R-123.
Figure 10.21e Flow reversal without PDEs in manifold. Successive frames from Figs. 10.21a to j taken at 2 ms time intervals illustrating unstable flow in a set of six parallel horizontal microchannels. G=411.7 kg/m2s, q"=90.0 kW/m2, Ts= 59.3 °C, R-123.
Figure 10.21f Flow reversal without PDEs in manifold. Successive frames from Figs. 10.21a to j taken at 2 ms time intervals illustrating unstable flow in a set of six parallel horizontal microchannels. G=411.7 kg/m2s, q"=90.0 kW/m2, Ts= 59.3 °C, R-123.
Figure 10.21g Flow reversal without PDEs in manifold. Successive frames from Figs. 10.21a to j taken at 2 ms time intervals illustrating unstable flow in a set of six parallel horizontal microchannels. G=411.7 kg/m2s, q"=90.0 kW/m2, Ts= 59.3 °C, R-123.
Figure 10.21h Flow reversal without PDEs in manifold. Successive frames from Figs. 10.21a to j taken at 2 ms time intervals illustrating unstable flow in a set of six parallel horizontal microchannels. G=411.7 kg/m2s, q"=90.0 kW/m2, Ts= 59.3 °C, R-123.
Figure 10.21j Flow reversal without PDEs in manifold. Successive frames from Figs. 10.21a to j taken at 2 ms time intervals illustrating unstable flow in a set of six parallel horizontal microchannels. G=411.7 kg/m2s, q"=90.0 kW/m2, Ts= 59.3 °C, R-123.
Figure 10.22a Without flow reversal, PDEs in manifold. Successive frames from Figs. 10.22a to j taken at 5 ms time intervals illustrating stable flow in a set of six parallel horizontal microchannels. G=411.7 kg/m2s, q"=89.5 kW/m2, Ts= 59.6 °C, R-123.
Figure 10.22b Without flow reversal, PDEs in manifold. Successive frames from Figs. 10.22a to j taken at 5 ms time intervals illustrating stable flow in a set of six parallel horizontal microchannels. G=411.7 kg/m2s, q"=89.5 kW/m2, Ts= 59.6 °C, R-123.
Figure 10.22c Without flow reversal, PDEs in manifold. Successive frames from Figs. 10.22a to j at 5 ms time intervals illustrating stable flow in a set of six parallel horizontal microchannels. G=411.7 kg/m2s, q"=89.5 kW/m2, Ts= 59.6 °C, R-123.
Figure 10.22d Without flow reversal, PDEs in manifold. Successive frames from Figs. 10.22a to j taken at 5 ms time intervals illustrating stable flow in a set of six parallel horizontal microchannels. G=411.7 kg/m2s, q"=89.5 kW/m2, Ts= 59.6 °C, R-123.
Figure 10.22e Without flow reversal, PDEs in manifold. Successive frames from Figs. 10.22a to j taken at 5 ms time intervals illustrating stable flow in a set of six parallel horizontal microchannels. G=411.7 kg/m2s, q"=89.5 kW/m2, Ts= 59.6 °C, R-123.
Figure 10.22f Without flow reversal, PDEs in manifold. Successive frames from Figs. 10.22a to j taken at 5 ms time intervals illustrating stable flow in a set of six parallel horizontal microchannels. G=411.7 kg/m2s, q"=89.5 kW/m2, Ts= 59.6 °C, R-123.
Figure 10.22g Without flow reversal, PDEs in manifold. Successive frames from Figs. 10.22a to j taken at 5 ms time intervals illustrating stable flow in a set of six parallel horizontal microchannels. G=411.7 kg/m2s, q"=89.5 kW/m2, T
s= 59.6 °C, R-123.
Figure 10.22h Without flow reversal, PDEs in manifold. Successive frames from Figs. 10.22a to j taken at 5 ms time intervals illustrating stable flow in a set of six parallel horizontal microchannels. G=411.7 kg/m2s, q"=89.5 kW/m2, Ts= 59.6 °C, R-123.
Figure 10.22i Without flow reversal, PDEs in manifold. Successive frames from Figs. 10.22a to j taken at 5 ms time intervals illustrating stable flow in a set of six parallel horizontal microchannels. G=411.7 kg/m2s, q"=89.5 kW/m2, Ts= 59.6 °C, R-123.
Figure 10.23a Present flow boiling data for R-123 compared to the proposed FFl and the correlation by Kandlikar and Balasubramanian [8] using laminar single-phase equation; ReLO = 295, G = 411.7 kg/m2s, FFl = 0.616, various heat fluxes and 7.7% PDEs in manifold.
Figure 10.23b Present flow boiling data for R-123 compared to the proposed FFl and the correlation by Kandlikar and Balasubramanian [8] using laminar single-phase equation; ReLO = 295, G = 411.7 kg/m2s, FFl = 0.616, various heat fluxes and without PDEs in manifold.
Figure 10.23c Present flow boiling data for R-123 compared to the proposed FFl and the correlation by Kandlikar and Balasubramanian [8] using laminar single-phase equation; ReLO = 315, G = 436.2 kg/m2s, FFl = 0.616, various heat fluxes and 7.7% PDEs in manifold.
Figure 10.23d Present flow boiling data for R-123 compared to the proposed FFl and the correlation by Kandlikar and Balasubramanian [8] using laminar single-phase equation; ReLO = 315, G = 436.2 kg/m2s, FFl = 0.616, various heat fluxes and without PDEs in manifold.
Figure 10.23e Present flow boiling data for R-123 compared to the proposed FFl and the correlation by Kandlikar and Balasubramanian [8] using laminar single-phase equation; ReLO = 335, G = 459.9 kg/m2s, FFl = 0.616, various heat fluxes and without PDEs in manifold.
Figure 10.23f Present flow boiling data for R-123 compared to the proposed FFl and the correlation by Kandlikar and Balasubramanian [8] using laminar single-phase equation; ReLO = 350, G = 485.5 kg/m2s, FFl = 0.616, various heat fluxes and without PDEs in manifold.
Figure 10.23g Present flow boiling data for R-123 compared to the proposed FFl and the correlation by Kandlikar and Balasubramanian [8] using laminar single-phase equation; ReLO = 370, G = 508.8 kg/m2s, FFl = 0.616, various heat fluxes and without PDEs in manifold.
Figure 10.23h Present flow boiling data for R-123 compared to the proposed FFl and the correlation by Kandlikar and Balasubramanian [8] using laminar single-phase equation; ReLO = 390, G = 535.1 kg/m2s, FFl = 0.616, various heat fluxes and without PDEs in manifold.
Figure 10.24b Present flow boiling data for R-123 compared to the proposed FFl and the correlation by Kandlikar and Balasubramanian [8] using Dittus Boelter equation; ReLO = 295, G = 411.7 kg/m2s, FFl = 0.875, various heat fluxes and without PDEs in manifold. Figure 10.24c Present flow boiling data for R-123 compared to the proposed FFl and the correlation by Kandlikar and Balasubramanian [8] using Dittus Boelter equation; ReLO = 315, G = 436.2 kg/m2s, FFl = 0.875, various heat fluxes and 7.7% PDEs in manifold. Figure 10.24d Present flow boiling data for R-123 compared to the proposed FFl and the correlation by Kandlikar and Balasubramanian [8] using Dittus Boelter equation; ReLO = 315, G = 436.2 kg/m2s, FFl = 0.875, various heat fluxes and without PDEs in manifold. Figure 10.24e Present flow boiling data for R-123 compared to the proposed FFl and the correlation by Kandlikar and Balasubramanian [8] using Dittus Boelter equation; ReLO = 335, G = 459.9 kg/m2s, FFl = 0.875, various heat fluxes and without PDEs in manifold. Figure 10.24f Present flow boiling data for R-123 compared to the proposed FFl and the correlation by Kandlikar and Balasubramanian [8] using Dittus Boelter equation; ReLO = 350, G = 485.5 kg/m2s, FFl = 0.875, various heat fluxes and without PDEs in manifold. Figure 10.24g Present flow boiling data for R-123 compared to the proposed FFl and the correlation by Kandlikar and Balasubramanian [8] using Dittus Boelter equation; ReLO = 370, G = 508.8 kg/m2s, FFl = 0.875, various heat fluxes and without PDEs in manifold. Figure 10.24h Present flow boiling data for R-123 compared to the proposed FFl and the correlation by Kandlikar and Balasubramanian [8] using Dittus Boelter equation; ReLO = 390, G = 535.1 kg/m2s, FFl = 0.875, various heat fluxes and without PDEs in manifold. Figure 10.25 Before CHF condition. Successive frames from (a) to (f) taken at 1.0 ms time intervals illustrating nucleation and flow reversal in a single channel from a set of six parallel horizontal microchannels. G=141.0 kg/m2s, q"=385.9 kW/m2, Ts=121.6 °C, water.
Figure 10.26 After CHF condition. Successive frames from (a) to (j) taken at 1.0 ms time intervals illustrating non-contact of liquid with channel wall in a single channel from a set of six parallel horizontal microchannels. G=141.0 kg/m2s, q"=405.1 kW/m2, Ts=165 °C, water.
Figure 10.27 CHF data from Qu and Mudawar [13], and present experiment plotted against Weber number, water.
Figure 10.28 CHF data from Qu and Mudawar, and present experiment plotted against exit quality, water.
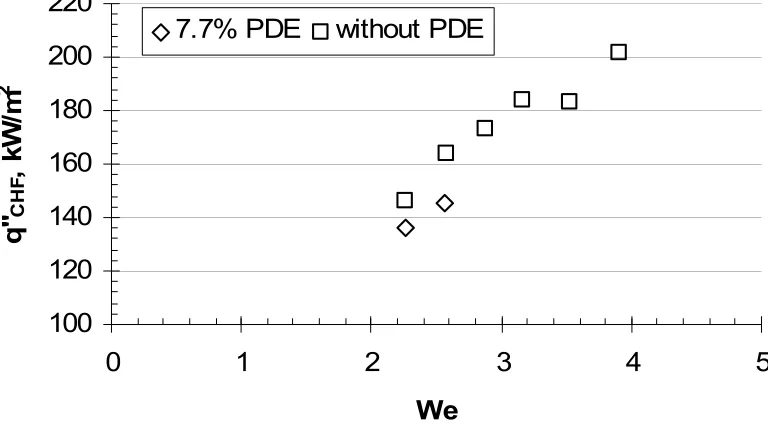
Figure 10.30 CHF data from present experiment with and without the 7.7% PDEs in manifold plotted against Weber number, water.
Figure 10.31 Present CHF data compared to the correlation by Qu and Mudawar [13], with 7.7% PDEs in manifold, water.
Figure 10.32 Present CHF data compared to the correlation by Qu and Mudawar [13], without PDEs in manifold, water.
Figure 10.33 Present CHF data compared to the circular channel correlation by Katto and Ohno [33], with 7.7% PDEs in manifold, water.
Figure 10.34 Present CHF data compared to the circular channel correlation by Katto and Ohno [33], without PDEs in manifold, water.
Figure 10.35 Present CHF data compared to the rectangular channel correlation by Katto [34], with 7.7% PDEs in manifold, water.
Figure 10.36 Present CHF data compared to the rectangular channel correlation by Katto [34], without PDEs in manifold, water.
Figure 10.37 Present CHF data compared to the correlation by Bowring [32], with 7.7% PDEs in manifold, water.
Figure 10.38 Present CHF data compared to the correlation by Bowring [32], without PDEs in manifold, water.
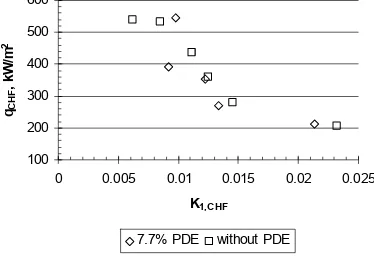
Figure 10.39 CHF data from present experiment with and without the 7.7% PDEs in manifold plotted against K1,CHF, water.
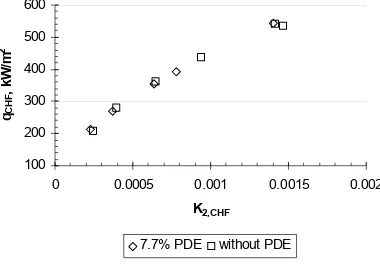
Figure 10.40 CHF data from present experiment with and without the 7.7% PDEs in manifold plotted against K2,CHF, water.
Figure 10.41 CHF data from present experiment with and without the 7.7% PDEs in manifold plotted against Weber number, R-123.
Figure 10.42 Schematic of microchannels and a picture showing the top near outlet view of the microchannels captured by the high-speed camera
Figure 10.43b Before CHF condition. Successive frames from Figs. 10.43a to h taken at 2.0 ms time intervals illustrating contact of liquid with channel wall near the outlet in a set of six parallel horizontal microchannels. G=411.7 kg/m2s, q"=52.9 kW/m2, Ts=51.8 °C, R-123.
Figure 10.43c Before CHF condition. Successive frames from Figs. 10.43a to h taken at 2.0 ms time intervals illustrating contact of liquid with channel wall near the outlet in a set of six parallel horizontal microchannels. G=411.7 kg/m2s, q"=52.9 kW/m2, Ts=51.8 °C, R-123.
Figure 10.43d Before CHF condition. Successive frames from Figs. 10.43a to h taken at 2.0 ms time intervals illustrating contact of liquid with channel wall near the outlet in a set of six parallel horizontal microchannels. G=411.7 kg/m2s, q"=52.9 kW/m2, Ts=51.8 °C, R-123.
Figure 10.43e Before CHF condition. Successive frames from Figs. 10.43a to h taken at 2.0 ms time intervals illustrating contact of liquid with channel wall near the outlet in a set of six parallel horizontal microchannels. G=411.7 kg/m2s, q"=52.9 kW/m2, Ts=51.8 °C, R-123.
Figure 10.43f Before CHF condition. Successive frames from Figs. 10.43a to h taken at 2.0 ms time intervals illustrating contact of liquid with channel wall near the outlet in a set of six parallel horizontal microchannels. G=411.7 kg/m2s, q"=52.9 kW/m2, Ts=51.8 °C, R-123.
Figure 10.43g Before CHF condition. Successive frames from Figs. 10.43a to h taken at 2.0 ms time intervals illustrating contact of liquid with channel wall near the outlet in a set of six parallel horizontal microchannels. G=411.7 kg/m2s, q"=52.9 kW/m2, Ts=51.8 °C, R-123.
Figure 10.43h Before CHF condition. Successive frames from Figs. 10.43a to h taken at 2.0 ms time intervals illustrating contact of liquid with channel wall near the outlet in a set of six parallel horizontal microchannels. G=411.7 kg/m2s, q"=52.9 kW/m2, Ts=51.8 °C, R-123.
Figure 10.44a After CHF condition. Successive frames from Figs. 10.44a to f taken at 10 ms time intervals illustrating non-contact of liquid with channel wall near the outlet in a set of six parallel horizontal microchannels. G=411.7 kg/m2s, q"=173.8 kW/m2, Ts=89.1 °C, R-123.
Figure 10.44c After CHF condition. Successive frames from Figs. 10.44a to f taken at 10 ms time intervals illustrating non-contact of liquid with channel wall near the outlet in a set of six parallel horizontal microchannels. G=411.7 kg/m2s, q"=173.8 kW/m2, Ts=89.1 °C, R-123.
Figure 10.44d After CHF condition. Successive frames from Figs. 10.44a to f taken at 10 ms time intervals illustrating non-contact of liquid with channel wall near the outlet in a set of six parallel horizontal microchannels. G=411.7 kg/m2s, q"=173.8 kW/m2, Ts=89.1 °C, R-123.
Figure 10.44e After CHF condition. Successive frames from Figs. 10.44a to f taken at 10 ms time intervals illustrating non-contact of liquid with channel wall near the outlet in a set of six parallel horizontal microchannels. G=411.7 kg/m2s, q"=173.8 kW/m2, Ts=89.1 °C, R-123.
Figure 10.44f After CHF condition. Successive frames from Figs. 10.44a to f taken at 10 ms time intervals illustrating non-contact of liquid with channel wall near the outlet in a set of six parallel horizontal microchannels. G=411.7 kg/m2s, q"=173.8 kW/m2, Ts=89.1 °C, R-123.
Figure 10.45a After CHF condition. Successive frames from Figs. 10.45a to f taken at 1.5 ms time intervals illustrating contact of liquid with channel wall near the inlet in a set of six parallel horizontal microchannels. G=411.7 kg/m2s, q"=173.8 kW/m2, Ts=89.1 °C, R-123.
Figure 10.45b After CHF condition. Successive frames from Figs. 10.45a to f taken at 1.5 ms time intervals illustrating contact of liquid with channel wall near the inlet in a set of six parallel horizontal microchannels. G=411.7 kg/m2s, q"=173.8 kW/m2, Ts=89.1 °C, R-123.
Figure 10.45c After CHF condition. Successive frames from Figs. 10.45a to f taken at 1.5 ms time intervals illustrating contact of liquid with channel wall near the inlet in a set of six parallel horizontal microchannels. G=411.7 kg/m2s, q"=173.8 kW/m2, Ts=89.1 °C, R-123.
Figure 10.45d After CHF condition. Successive frames from Figs. 10.45a to f taken at 1.5 ms time intervals illustrating contact of liquid with channel wall near the inlet in a set of six parallel horizontal microchannels. G=411.7 kg/m2s, q"=173.8 kW/m2, Ts=89.1 °C, R-123.
Figure 10.45f After CHF condition. Successive frames from Figs. 10.45a to f taken at 1.5 ms time intervals illustrating contact of liquid with channel wall near the inlet in a set of six parallel horizontal microchannels. G=411.7 kg/m2s, q"=173.8 kW/m2, Ts=89.1 °C, R-123.
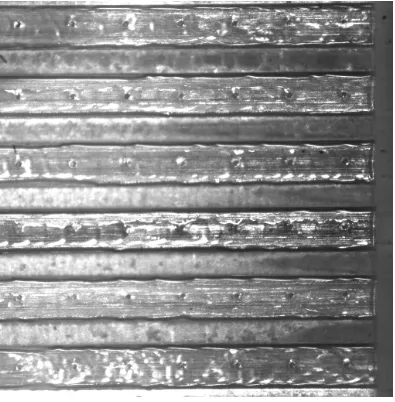
Figure 10.46a Partial CHF transition. Successive frames from Figs. 10.46a to j taken at 5 ms time intervals illustrating contact of liquid with channel wall near the outlet in a set of six parallel horizontal microchannels. G=436.2 kg/m2s, q"=164.0 kW/m2, T
s=73.6 °C, R-123.
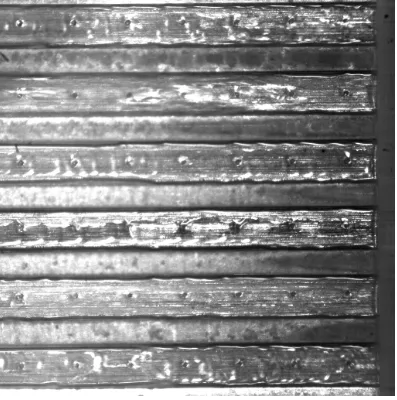
Figure 10.46b Partial CHF transition. Successive frames from Figs. 10.46a to j taken at 5 ms time intervals illustrating contact of liquid with channel wall near the outlet in a set of six parallel horizontal microchannels. G=436.2 kg/m2s, q"=164.0 kW/m2, Ts=73.6 °C, R-123.
Figure 10.46c Partial CHF transition. Successive frames from Figs. 10.46a to j taken at 5 ms time intervals illustrating contact of liquid with channel wall near the outlet in a set of six parallel horizontal microchannels. G=436.2 kg/m2s, q"=164.0 kW/m2, T
s=73.6 °C, R-123.
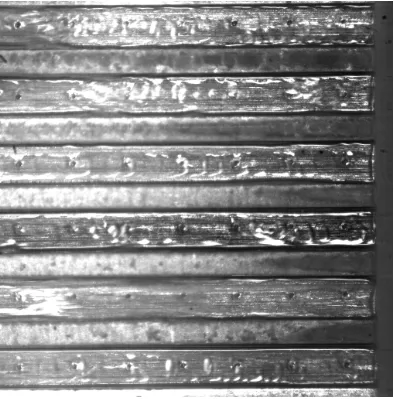
Figure 10.46d Partial CHF transition. Successive frames from Figs. 10.46a to j taken at 5 ms time intervals illustrating contact of liquid with channel wall near the outlet in a set of six parallel horizontal microchannels. G=436.2 kg/m2s, q"=164.0 kW/m2, Ts=73.6 °C, R-123.
Figure 10.46e Partial CHF transition. Successive frames from Figs. 10.46a to j taken at 5 ms time intervals illustrating contact of liquid with channel wall near the outlet in a set of six parallel horizontal microchannels. G=436.2 kg/m2s, q"=164.0 kW/m2, Ts=73.6 °C, R-123.
Figure 10.46f Partial CHF transition. Successive frames from Figs. 10.46a to j taken at 5 ms time intervals illustrating contact of liquid with channel wall near the outlet in a set of six parallel horizontal microchannels. G=436.2 kg/m2s, q"=164.0 kW/m2, Ts=73.6 °C, R-123.
Figure 10.46g Partial CHF transition. Successive frames from Figs. 10.46a to j taken at 5 ms time intervals illustrating contact of liquid with channel wall near the outlet in a set of six parallel horizontal microchannels. G=436.2 kg/m2s, q"=164.0 kW/m2, Ts=73.6 °C, R-123.
Figure 10.46i Partial CHF transition. Successive frames from Figs. 10.46a to j taken at 5 ms time intervals illustrating contact of liquid with channel wall near the outlet in a set of six parallel horizontal microchannels. G=436.2 kg/m2s, q"=164.0 kW/m2, Ts=73.6 °C, R-123.
Figure 10.46j Partial CHF transition. Successive frames from Figs. 10.46a to j taken at 5 ms time intervals illustrating contact of liquid with channel wall near the outlet in a set of six parallel horizontal microchannels. G=436.2 kg/m2s, q"=164.0 kW/m2, T
s=73.6 °C, R-123.
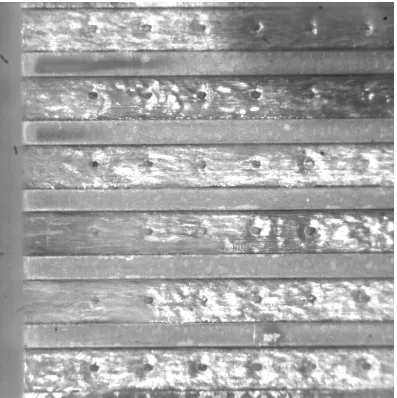
Figure 10.47a Partial CHF transition. Successive frames from Figs. 10.47a to j taken at 0.5 ms time intervals illustrating contact of liquid with channel wall near the inlet in a set of six parallel horizontal microchannels. G=436.2 kg/m2s, q"=164.0 kW/m2, Ts=73.6 °C, R-123.
Figure 10.47b Partial CHF transition. Successive frames from Figs. 10.47a to j taken at 0.5 ms time intervals illustrating contact of liquid with channel wall near the inlet in a set of six parallel horizontal microchannels. G=436.2 kg/m2s, q"=164.0 kW/m2, T
s=73.6 °C, R-123.
Figure 10.47c Partial CHF transition. Successive frames from Figs. 10.47a to j taken at 0.5 ms time intervals illustrating contact of liquid with channel wall near the inlet in a set of six parallel horizontal microchannels. G=436.2 kg/m2s, q"=164.0 kW/m2, Ts=73.6 °C, R-123.
Figure 10.47d Partial CHF transition. Successive frames from Figs. 10.47a to j taken at 0.5 ms time intervals illustrating contact of liquid with channel wall near the inlet in a set of six parallel horizontal microchannels. G=436.2 kg/m2s, q"=164.0 kW/m2, Ts=73.6 °C, R-123.
Figure 10.47e Partial CHF transition. Successive frames from Figs. 10.47a to j taken at 0.5 ms time intervals illustrating contact of liquid with channel wall near the inlet in a set of six parallel horizontal microchannels. G=436.2 kg/m2s, q"=164.0 kW/m2, Ts=73.6 °C, R-123.
Figure 10.47f Partial CHF transition. Successive frames from Figs. 10.47a to j taken at 0.5 ms time intervals illustrating contact of liquid with channel wall near the inlet in a set of six parallel horizontal microchannels. G=436.2 kg/m2s, q"=164.0 kW/m2, Ts=73.6 °C, R-123.
Figure 10.47h Partial CHF transition. Successive frames from Figs. 10.47a to j taken at 0.5 ms time intervals illustrating contact of liquid with channel wall near the inlet in a set of six parallel horizontal microchannels. G=436.2 kg/m2s, q"=164.0 kW/m2, Ts=73.6 °C, R-123.
Figure 10.47i Partial CHF transition. Successive frames from Figs. 10.47a to j taken at 0.5 ms time intervals illustrating contact of liquid with channel wall near the inlet in a set of six parallel horizontal microchannels. G=436.2 kg/m2s, q"=164.0 kW/m2, T
s=73.6 °C, R-123.
Figure 10.47j Partial CHF transition. Successive frames from Figs. 10.47a to j taken at 0.5 ms time intervals illustrating contact of liquid with channel wall near the inlet in a set of six parallel horizontal microchannels. G=436.2 kg/m2s, q"=164.0 kW/m2, Ts=73.6 °C, R-123.
Figure 10.48 Present CHF data and without the 7.7% PDEs in manifold compared to the correlation by Qu and Mudawar [13], R-123.
Figure 10.49 Present CHF data with and without the 7.7% PDEs in manifold compared to the circular channel correlation by Katto and Ohno [33], R-123.
Figure 10.50 Present CHF data with and without the 7.7% PDEs in manifold compared to the rectangular channel correlation by Katto [34], R-123.
Figure 10.51 Present CHF data with and without the 7.7% PDEs in manifold compared to the correlation by Bowring [32], with 7.7% PDEs in manifold, R-123.
Figure 10.52 CHF data from present experiment with and without the 7.7% PDEs in manifold plotted against K1, R-123.
Figure 10.53 CHF data from present experiment with and without the 7.7% PDEs in manifold plotted against K2, R-123.
Figure 10.54 Present water CHF data with 7.7% PDE in manifold compared to the present correlation, Eq.(12), plotted against Weber number.
Figure 10.55 Present water CHF data without PDE in manifold compared to the present correlation, Eq.(12), plotted against Weber number.
Figure 10.56 Present water CHF data with and without 7.7% PDE in manifold compared to the present correlation, Eq.(12)
Figure 10.58 Present R-123 CHF data with and without 7.7% PDE in manifold compared to the present correlation, Eq.(12)
Figure 10.59 Present water CHF data with 7.7% PDE in manifold compared to the present Kandlikar and Kuan CHF model, Eq. (24), plotted against Weber number,
C=0.002679, water.
Figure 10.60 Present water CHF data without PDE in manifold compared to the present Kandlikar and Kuan CHF model, Eq. (24), plotted against Weber number, C=0.002679, water.
Figure 10.61 Present water CHF data with 7.7% PDE in manifold compared to the present Kandlikar and Kuan CHF model, Eq. (24), C=0.002679, water.
Figure 10.62 Present water CHF data without PDE in manifold compared to the present Kandlikar and Kuan CHF model, Eq. (24), C=0.002679, water.
Figure 10.63 Qu and Mudawar [13] CHF data compared to the present Kandlikar and Kuan CHF model, Eq.(24), plotted against Weber number, C=0.002679, water.
Figure 10.64 Qu and Mudawar [13] CHF data compare to the present Kandlikar and Kuan CHF model, Eq.(24), C=0.002679, water.
Figure 10.65 Present R-123 CHF data with and without 7.7% PDE in manifold compared to the present Kandlikar and Kuan CHF model, Eq.(24), plotted against Weber number, C=0.002679.
Figure 10.66 Present R-123 CHF data with and without 7.7% PDE in manifold compared to the present Kandlikar and Kuan CHF model, Eq.(24), C=0.002679.
Figure 10.67 Present water CHF data with 7.7% PDE in manifold compared to the present Kandlikar and Kuan CHF model, Eq.(24), plotted against Weber number, C = 0.002492.
Figure 10.68 Present water CHF data without PDE in manifold compared to the present Kandlikar and Kuan CHF model, Eq.(24), plotted against Weber number, C = 0.002492.
Figure 10.69 Present water CHF data with 7.7% PDE in manifold compared to the present Kandlikar and Kuan CHF model, Eq.(24), C = 0.002492.
Figure 10.70 Present water CHF data without PDE in manifold compared to the present Kandlikar and Kuan CHF model, Eq.(24), C = 0.002492.
Figure 10.72 Qu and Mudawar [13] CHF data compared to the present Kandlikar and Kuan CHF model, Eq.(24), C = 0.002492, water.
Figure 10.73 Present R-123 CHF data with and without 7.7% PDE in manifold compared to the present Kandlikar and Kuan CHF model, Eq. (24), plotted against Weber number, C = 0.003139.
Figure 10.74 Present R-123 CHF data with and without 7.7% PDE in manifold compared to the present Kandlikar and Kuan CHF model, Eq.(24), C = 0.003139.
Figure 11.1 Historical power trend for Intel CPUs Figure 14.1 Top fused silica cover for test section Figure 14.2 Top polycarbonate cover for test section Figure 14.3 Microchannel copper block for test section Figure 14.4 Phenolic plate for test section
Figure 14.5 LabVIEW front panel for the R-123 experimental system
Figure 14.6a After CHF condition. Successive frames from Figs. 14.6a to 14.6h taken at 10 ms time intervals illustrating non-contact of liquid with channel wall near the outlet in a set of six parallel horizontal microchannels. G=231.7 kg/m2s, q"=540.2 kW/m2, Ts=120.4 °C, water.
Figure 14.6b After CHF condition. Successive frames from Figs. 14.6a to 14.6h taken at 10 ms time intervals illustrating non-contact of liquid with channel wall near the outlet in a set of six parallel horizontal microchannels. G=231.7 kg/m2s, q"=540.2 kW/m2, Ts=120.4 °C, water.
Figure 14.6c After CHF condition. Successive frames from Figs. 14.6a to 14.6h taken at 10 ms time intervals illustrating non-contact of liquid with channel wall near the outlet in a set of six parallel horizontal microchannels. G=231.7 kg/m2s, q"=540.2 kW/m2, Ts=120.4 °C, water.
Figure 14.6d After CHF condition. Successive frames from Figs. 14.6a to 14.6h taken at 10 ms time intervals illustrating non-contact of liquid with channel wall near the outlet in a set of six parallel horizontal microchannels. G=231.7 kg/m2s, q"=540.2 kW/m2, Ts=120.4 °C, water.
Figure 14.6f After CHF condition. Successive frames from Figs. 14.6a to 14.6h taken at 10 ms time intervals illustrating non-contact of liquid with channel wall near the outlet in a set of six parallel horizontal microchannels. G=231.7 kg/m2s, q"=540.2 kW/m2, Ts=120.4 °C, water.
Figure 14.6g After CHF condition. Successive frames from Figs. 14.6a to 14.6h taken at 10 ms time intervals illustrating non-contact of liquid with channel wall near the outlet in a set of six parallel horizontal microchannels. G=231.7 kg/m2s, q"=540.2 kW/m2, Ts=120.4 °C, water.
List of Tables
Table 3.1 Summary of studies on flow boiling in small channels Table 3.2 Summary of studies on CHF in small channels
Table 3.3 CHF correlations Table 10.1 Operating conditions
Table 10.2 CHF correlation results for water Table 10.3 CHF correlation results for R-123
Table 10.4 CHF data compared to the predicted results using the new correlation, Eq. (12).
List of Symbols
A – parameter in CHF empirical correlations in Table 3.3
Ach – cross-sectional area, m2
AHT – heat transfer area, m2
b – height of microchannel, m
Bo – boiling number
C – parameter in empirical CHF correlations in Table 3.3; constant in present CHF
model, Eq. (24)
cp – specific heat at constant pressure, J/(kg K)
CHF – critical heat flux, W/m2
Co – convection number
D – minimum dimension of rectangular channel, m; diameter, m; half of the critical
wavelength, m; characteristic dimension, m
d – inner diameter of circular channel, m
dh – hydraulic diameter, m
de – heated equivalent diameter, m
FI – force due to inertia, N
FM – force due to momentum change, N
F1 to F4 – parameters in empirical CHF correlations in Table 3.3
FFl – fluid dependent parameter in Kandlikar [38]
Fr – Froude number, =G2 /ρL2gD
f – friction factor
G – mass flux, kg/m2s
g – gravitational acceleration, m/s2
∆hsub,in – inlet subcooling, J/kg
h – heat transfer coefficient, W/m2K
fg
h – latent heat of vaporization, J/kg
Hch – height of microchannel, m
I – current, Amp
K – inlet subcooling parameter in empirical CHF correlations in Table 3.3
K1 to K3 – inlet subcooling parameters in empirical CHF correlations in Table 3.3
k – thermal conductivity, W/m-°C
K1 – non-dimensional constant, Eq. (2)
K2 – non-dimensional constant, Eq. (3)
L – heated length of microchannel, m
M – number of samples
MAE – mean absolute error
n – parameter in empirical CHF correlations in Table 3.3; number of samples in
Eq. (38)
Nu – Nusselt number
P – pressure, kPa
Pr – Prandtl number, =ηcp /k or =cpµ/k
h
P
– inside heated perimeter of channel, mPR – reduced pressure in empirical CHF correlations in Table 3.3
PDE – pressure drop element
q – power, W
"
q , q& – heat flux , W/m2
0
q′′ – parameters in empirical CHF correlations in Table 3.3, W/m2
01
q′′ to q05′′ – parameters in empirical CHF correlations in Table 3.3, W/m2
CHF
q′′ – critical heat flux , W/m2
R2 – square of the Pearson product moment correlation coefficient
R – result, Eq. (38)
Re – Reynolds number, =Gdh /µ
T – temperature, °C
TC – thermocouple
∆Tamb – differential temperature for use in performing test section heat loss
calibration, °C
∆Tsat – wall superheat, °C
U – uncertainty interval, Eq. (38)
v – variable, Eq. (38)
V – velocity, m/s; voltage, volts
V – average velocity based on average density, ρ, m/s
w – width of microchannel, m
We – Weber number, =G2D/ρσ
x – thermodynamic quality
X – parameter being investigated in Eq. (37)
∆Z – remaining length for flow boiling in microchannel, m
Greek Symbols
α – aspect ratio
µ – dynamic fluid viscosity, Pa·s
ρ – density, kg/m3
ρ – average density, kg/m3
θ – dynamic receding contact angle, degrees
Subscripts
amb – ambient
CBD – convection dominant region
CHF – critical heat flux, W/m2
exp – experiment
G, g – gas or vapor
in – input; inlet
I – inertia
L, f – liquid
LO – all flow as liquid
loss – unrecoverable loss
M – due to momentum change
NBD – nucleate boiling dominant region
out – outlet
pred – predicted
s – microchannel surface
S – surface tension; surface
sat – saturation
sub – subcooled
ts – test section
1.0 INTRODUCTION
Heat sinks are commonly attached to the surfaces of logic chips to enhance the
heat transfer to the ambient air. In order to increase the surface area available for
convective heat transfer, a common approach is to use a heat sink consisting of an array
of fins. As computer chips become smaller in size and more powerful at the same time,
the size of conventional fin-type heat sinks has to increase in order to dissipate the
increase in heat generation. Hence, given a computer case, the performance of a
computer is often limited by the available space in the case to accommodate the larger
heat sinks.
One way to enhance heat transfer from electronics without sacrificing their
performance is the use of a heat sink with many microchannels and liquid water passing
through it. Because of the small size of microchannel heat sink, the performance of a
computer system can also be increased by incorporating additional microprocessors at a
given space without the issue of over-heated or burned-out chips. The present work
involves cooling of electronic devices using two-phase flow in microchannel heat sink.
Two-phase heat transfer has significant advantages over single-phase heat transfer
because flow rates are smaller through the use of the latent heat of vaporization, pressure
drop and pumping power are less, approximately uniform fluid and solid temperatures
can be obtained, and it can also be directly coupled with a refrigerant system to provide a
lower coolant temperature.
In designing a two-phase microchannel heat sink, it is necessary to know its
critical heat flux (CHF). This is because CHF determines the upper thermal limit on the
detrimental to electronics. That is why CHF data and a good understanding of CHF in
microchannels are needed before the application of two-phase microchannel heat sink can
be implemented. Furthermore, very few experimental CHF data have been reported in
microchannels. Hence, one of the objectives of the present work is to experimentally
investigate the CHF of saturated flow boiling in microchannels using water and
Refrigerant-123 (R-123) as the working fluids. The present experiment involves the
collecting of CHF data over the ranges of mass flux and heat flux supplied to the
microchannels.
In flow boiling, there are, however, complexities associated with vaporization in
multiple narrow channel arrays that are not completely understood. The phenomenon
characterized by vapor expansion in both the upstream and downstream directions
causing flow reversal was observed by Kandlikar et al. [1] and also by Kandlikar and
Balasubramanian [2]. Both employed a high-speed digital video camera to observe this
behavior in minichannels and microchannels. Similar flow instabilities were observed by
Li et al. [3] and Peles [4], among other investigators.
Kandlikar [5] reported that flow instabilities in microchannels are due to rapid
bubble expansion and occasional flow reversal, and they cause a major concern in
implementing flow boiling in microchannels. Because of this, research on obtaining
experimental heat transfer and pressure drop data for flow boiling of water in
microchannels is immediately warranted. Focusing on flow instabilities, Kandlikar et al.
[6] found that the heat transfer performance in microchannels can be improved by using
flow restrictors to stabilize the flow in microchannels, and partially stabilized flow was
pressure drop elements as flow restrictors. Hence, one of the objectives of the present
work is to experimentally investigate the effect of pressure drop elements on
1.1 Motivation
Flow boiling in microchannels is being studied worldwide because of its potential
in high heat flux cooling [7]. This is because the heat of vaporization of a liquid is much
higher than its sensible heat. So, for a given liquid mass flow rate, the heat flux in flow
boiling is much higher than single phase liquid flow. Before getting into the design of
microchannel cooling system, a fundamental understanding of flow boiling in
microchannels is necessary. When dealing with flow boiling, critical heat flux (CHF) is
also an important consideration in microchannel cooling design. This is because the
rapid decrease in heat flux after the CHF point can result in burn-out of chip. Thus, CHF
data are needed before chip cooling using a microchannel heat sink can be widely
1.2 Objectives
The present work focuses on the experimental investigation of flow boiling heat
transfer and CHF in microchannels using two fluids, R-123 and water. The chemical
formula for R-123 is CHCl2CF3. CHF data will be collected over the ranges of mass flux and heat flux supplied to the microchannels. Thus, the objectives of the present work are:
• Develop an experimental apparatus to investigate saturated flow boiling critical heat flux of R-123 and water in microchannels.
• Obtain heat transfer data using R-123 and water over ranges of mass flux and heat flux supplied to the microchannels.
• Obtain CHF data using R-123 and water over ranges of mass flux and heat flux supplied to the microchannels.
• Experimentally investigate the effect of Pressure Drop Elements (PDE) on heat transfer performance and CHF in microchannels.
• Study the flow patterns of before the CHF condition and after the CHF condition using a high speed camera.
• Determine the value of the fluid-surface parameter, FFl, for R-123 in the flow boiling correlation by Kandlikar and Balasubramanian [8].
• Find out the applicability of existing CHF correlations to microchannels using the present experimental data.
• Develop a new CHF correlation using the experimental data.
• Develop a new theoretical model to better predict CHF in microchannels, based on fundamental considerations.
2.0 INTRODUCTION TO FLOW BOILING
Boiling is a phase change process in which vapor bubbles can be seen on the
heated surface and/or in a superheated liquid layer adjacent to the heated surface [9].
When boiling, heat is transferred by convection from the heated surface to the liquid.
The convection process is governed by Eq. (1)
(
T
T
sat)
h
q
′′
=
−
(1)where q′′ is the heat flux, with units of W/m2, and h is the heat transfer coefficient, with units of W/m2·K.
The amount of heat flux that can be transferred against the range of wall superheat
The wall superheat, ∆Tsat is defined as the difference between that wall
temperature Tw and the saturation temperature Tsat of the liquid.
Nucleate boiling (region II) commences at point A. The maximum heat flux that
can be obtained with nucleate boiling is called CHF [10], which is point C on the boiling
curve. Increasing the heat flux beyond point C will cause the transition from nucleate
boiling to film boiling. After point C, the wall superheat increases at a constant heat flux.
Continually increasing the wall superheat will damage or melt the heater surface if the
surface temperature reaches the melting temperature of the heater surface material.
In flow boiling inside a heated tube, a boiling curve which is similar to the one in
It can be seen that the heat transfer rate increases with increasing flow velocity.
However, the curves for different flow velocities overlap each other from B′ to C′
suggesting the dominance of heat removal by phase change during fully developed
2.1 Critical Heat Flux (CHF)
The CHF condition is where an abrupt worsening of heat transfer between a
heating wall and a coolant fluid occurs [12]. The CHF condition occurs when a vapor
blanket covers the heated surface separating the surface from the liquid. The vapor layer
strongly reduces the heat transfer rate from the heated wall to the working liquid. In heat
flux controlled systems, the CHF condition is met when the upper limit of heat flux is
reached and followed by a drastic rise in wall temperature. In temperature controlled
systems, the CHF condition leads to considerable degradation in heat flux because of a
reduction in the heat transfer coefficient as defined by Eq. (1). CHF generally
commences at the channel outlet [13], and the two types of CHF are subcooled CHF and
2.1.1 Subcooled CHF
In the case of subcooled CHF, the bulk fluid temperature is subcooled where the
CHF occurs. A liquid is subcooled when its bulk temperature is below the saturation
value flowing over a surface exposed to heat flux [14]. The conditions for subcooled
CHF are large mass velocity, high inlet subcooling, and channels with small
length-to-diameter ratio. At the channel outlet, the bulk fluid remains mostly in the liquid state and
a large number of very small vapor bubbles cover the heated wall. The proposed theories
for subcooled CHF are:
• Intense boiling, bubble-liquid boundary separates from the heater wall, resulting in a stagnant liquid to evaporate.
• Bubble crowding, inhibits replenishment near the surface, causing vapor layer. • Dryout of liquid sublayer beneath large vapor bubbles causes rise in local wall
temperature.
Figure 2.3 shows a schematic of subcooled flow boiling near CHF conditions by
Celata et al. [15]. In the figure, CHF occurs when a vapor blanket reaches the thickness
2.1.2 Saturated CHF
Saturated CHF is also found in microchannels. This type of CHF is caused by
gradual depletion of the liquid film wetting the heating wall [16]. The heated wall turns
dry when the flow rate of the liquid film reaches zero as shown in Figs. 2.4 and 2.5. CHF
may occur when the liquid film flow rate goes to zero. The conditions for saturated CHF
are small mass velocity, low inlet subcooling, and channels with large length-to-diameter
ratio.
At outlet:
• Flow pattern is mostly annular and mostly vapor in the core. • Thin film liquid flows along channel wall.
• Dryout of liquid film near outlet, regarded as causing saturated CHF. The saturated CHF conditions described in the above [13] can be found in Fig. 2.4
In Fig. 2.5, Celata et al. [18] showed a similar saturated flow boiling region.
3.0 LITERATURE REVIEW
There are very few available studies on CHF condition in microchannels
(microchannels are defined as channels with their minimum channel dimension in the
range 10 µm < D ≤ 200 µm [19]). Pressure drop fluctuations were reported in
microchannels [20], but their effect on CHF condition has not been studied. In flow
boiling condition, flow instabilities occur when the pressure drop in the upstream section
is relatively small and it has a significant effect on pressure drop across microchannels
and heat transfer [20]. These two-phase flow instabilities in microchannels are caused by
rapid bubble growth accompanied by the fluctuations in pressure drop. This condition
has adverse effects on heat transfer performance. Presently, the local reversed flow
phenomenon is not well understood and not well studied, and few attempts have been
reported to control it.
The onset of boiling and the subsequent two-phase flow interactions are greatly
dependent on the channel surface temperature, local liquid temperature, local heat
transfer coefficient prior to nucleation, and availability of nucleation cavities. Uneven
flow and pressure fluctuations lead to flow reversal, which may introduce vapor back into
the inlet manifold and exacerbate the instability generated in the channels. When a large
vapor bubble passes through a channel, the transient heat conduction and interface
evaporation enhance heat transfer in the channel and reduce the local channel surface
temperatures.
The basic issues related to the instabilities associated with flow boiling in
microchannels were presented by Kandlikar [20]. One of the major results of the
effect was presented by Bergles and Kandlikar [21]. The available experimental data on
CHF by Jiang et al. [22], Bowers and Mudawar [23], Qu and Mudawar [13] indicate the
3.1 Flow Boiling Heat Transfer Studies in Minichannels and
Microchannels
Kandlikar et al. [1] studied flow boiling of water in parallel minichannels using
high-speed photographic observation. They found vapor bubble growth occurs in the
direction counter to bulk flow, forcing liquid and vapor to flow back into the inlet
manifold. The reverse flow phenomenon in small diameter parallel multichannels
evaporator was clearly documented.
Li et al. [24] experimentally studied the flow boiling instability in two parallel
microchannels using low mass flux and various heat fluxes. The two microchannels were
of triangular cross-section with topside width of 100 microns and hydraulic diameter of
51.7 microns. The spacing between the closest edges of the microchannels was 20
microns. Flow reversal was observed using a high-speed video camera. The flow
instabilities were found to cause significant oscillations to the inlet and outlet
temperatures, inlet pressure and the pressure drop in the two parallel microchannels
configuration. The authors concluded that flow boiling instabilities involving flow
reversal should be of great concern for the design of micro evaporators.
Brutin et al. [25] experimentally investigated two-phase flow instabilities in
rectangular minichannels with hydraulic diameter of 889 microns. The two-phase flow
oscillation phenomenon was visually detected during flow boiling in minichannels. The
phenomenon was caused by the formation of a vapor slug which pushes the liquid phase
back to the entrance of their test section.
Peles [4] mentioned the importance of addressing and studying flow instabilities
in microchannels that will be used in flow boiling applications. Hetsroni et al. [26] found
flux situations. Flow reversal is observed in some microchannels, and they are caused by
expanding bubbles pushing the liquid-vapor interface in both upstream and downstream
directions. Steinke and Kandlikar [27] reported flow reversal in microchannels where the
vapor interface moves in a direction counter to the bulk fluid flow. Balasubramanian and
Kandlikar [28] reported severe flow maldistribution cause by back flow extended into the
inlet manifold.
The summary of the above literature review can be found in Table 3.1. Very few
researchers have reported any work on preventing the flow reversal phenomenon in
Table 3.1 Summary of studies on flow boiling in small channels Author/
year
Fluid Operating conditions G (kg/m2s); q" (kW/m2); Tin (°C); Pin (kN/m2)
Channel geometry (mm) Remarks Kandlikar et al. 2001 [1]
Water G = 28-155; q" = 74.3-133; Tin = 24.2-24.7
Square, 1 × 1, 6 parallel channels, horizontal
Slug growth occurs in the direction counter to bulk flow, forcing liquid and vapor to flow back into inlet manifold. Reverse flow in small
diameter parallel
multichannels evaporator is observed for the first time. Li et al.
2003 [24]
Water G = 92.6-117; q" = 108-208; Tin = 70-100; Pin = 121-180
Triangular, 0.100 × 0.0706, 2 parallel channels, horizontal
Flow instabilities are found to cause significant oscillations in the inlet and outlet
temperatures, inlet pressure and the pressure drop in the microchannels.
Brutin et al. 2003 [25]
n-Pentane
G = 240-28800; q" = 33-700
Rectangular, 0.5 × 4, single channel with two lengths of 50 and 200, vertical upward flow
Two-phase flow oscillation phenomena were visually detected.
Reverse flow extends into entrance.
Peles
2003 [4] Water 1-10 g/min; q" = 100-600 Triangular, hydraulic diameter (mm) = 0.05-0.2,
16 mm long multiple parallel channels, horizontal
Rapid bubble flow regime is the most commonly observed. Important to address and study flow instabilities in
microchannels.
Hetsroni et al.
2003 [26]
Water Re = 8-42;
q" = 100-600 Rectangular, hydraulic diameter (mm) = 0.103-0.161, 19-26 parallel channels, horizontal
Flow reversal caused by expanding bubbles pushing the liquid-vapor interface in both upstream and
downstream directions. Steinke and
Kandlikar 2004 [27]
Water G = 157-1782;
q" = 5-898 Rectangular, hydraulic diameter (mm) = 0.207, 6 parallel channels, horizontal
Reported reverse flow under certain conditions in
microchannels.
Balasubra-manian and Kandlikar 2005 [28]
Water G = 112-120; q" = 208-316;
Rectangular, 0.990 × 0.207,
6 parallel channels, horizontal
3.2 Flow Boiling Critical Heat Flux Studies in Minichannels and
Microchannels
Because of the limited number of investigations on CHF in microchannels,
experimental studies related to both minichannels and microchannels will be reviewed.
Minichannels cover the range from 200 µm to 3 mm channel diameter.
Bowers et al. [23] experimentally studied CHF in circular channels with diameters
of 2.54 mm and 0.510 mm using R-113 as the working liquid. The heated length of the
channels is 10 mm. In their experiment, CHF is found to be independent of the inlet
subcooling at low flow rates due to fluid reaching the saturation temperature in a short
distance into the heated channels.
Roach et al. [29] used uniformly heated channels to experimentally investigate
CHF. The four different channels, all 160 mm in length, are: two circular with 1.17 mm
and 1.45 mm diameter, and two other flow channels in microrod bundle with a triangular
array and 1.131 mm hydraulic diameter. One of the microrod bundles is uniformly
heated over its entire surface and the other is heated only over the surfaces of the
surrounding rods. The authors found that the CHF occurs at high thermodynamic quality
of x = 0.36 and higher, indicating dry-out as the CHF mechanism. In addition, the CHF
increases with increasing mass flux and pressure, and depends on channel diameter.
Jiang et al. [22] investigated the CHF condition in diamond-shaped channels with
hydraulic diameter ranging from 0.04 mm to 0.08 mm using water as the working fluid.
The authors suggest that the evolution of the phase change from liquid to vapor in
microchannels is different from conventional channels. They found that the CHF
such small channels, bubble formation may be suppressed and recommended flow
visualization studies to determine the governing heat transfer mechanism.
Yu et al. [30] found that CHF occurs at high flow quality between 0.5 and 1.0 for
water, and such qualities are higher than those found in larger diameter tubes at higher
pressures and mass fluxes. The CHF quality was found to decrease with decreasing mass
flux, and this trend is opposite to the one found in larger tubes. Their experiments were
performed using a horizontal tube with 2.98 mm inside diameter and 910 mm heated
length.
Qu and Mudawar [13] measured CHF for a water-cooled heat sink containing 21
parallel 0.215 mm x 0.821 mm channels. The authors found that flow reversal caused by
flow instabilities have resulted in a CHF independent of inlet temperature but which
increases with increasing mass velocity. Koşar et al. [31] found that CHF increases with
mass flux and decreases with vapor mass fraction at the exit.
Table 3.2 Summary of studies on CHF in small channels Author/
year Fluid Operating conditions G (kg/m2s); q" (kW/m2); x; Tin (°C); Pin (kPa)
Channel
geometry (mm) Remarks
Bowers and Mudawar 1994 [23]
R-113 G = 10-490; q" = 200-2000; x = 0-1
Circular, multi-channels, d = 2.54 and 0.51, horizontal
Higher CHF can be obtained in microchannels, and presented correlation for CHF. Roach et al. 1998 [29]
Water G = 250-1000; q" = 860-3698; x = 0.36-1.2; Tin = 49 to 72.5; Pin = 407-1204
Circular, d = 1.17 and 1.45;
microrod bundle with a triangular array, Hydraulic diameter = 1.131, vertical
CHF occurs at high flow quality between 0.36 and higher, indicates dry-out; CHF increase with increasing mass flux or pressure, and depends on channel diameter.
Jiang et al. 1999 [22]
Water P = 50-320 V-grooved, Hydraulic diameter = 0.04 and 0.08, horizontal
CHF condition depends on the flow rate and the channel size.
Yu et al. 2002 [30]
Water G = 50-200; q" = 20-320; x = 0.5-1.0;
Tin = ambient to 80; Pin = 200
Circular, d = 2.98,
horizontal
CHF occurs at high thermodynamic quality between 0.5-1.0; CHF quality decrease with decreased mass flux. Qu and
Mudawar 2003 [13]
Water G = 86-368; q" = 264.2-542.0; x = 0-0.562; Tin = 30 and 60; Pin = 121.3-139.8
Rectangular, 0.215 × 0.821, 21 parallel channels, horizontal
Flow instability greatly amplified nearing CHF; CHF increases with mass flux; A new CHF correlation is proposed. Koşar et
al.
2005 [31]
Water G = 41, 83, 166 and 302;
q" = 280-4450; x = 0-0.9;
∆P = 0.4, 0.8, 1.7 and 3.0.
Rectangular, Hydraulic
diameter = 0.223, 5 parallel
channels, horizontal
3.3 Critical Heat Flux Correlation
Because of the limited number of investigations on CHF in microchannels, CHF
correlations related to conventional channels, minichannels and microchannels will be
used in the present study. Table 3.3 shows the few correlations that are commonly used
by previous researchers.
Table 3.3 CHF correlations Reference Recommended
channel
geometry and size
Correlation
Bowring [32] Circular, conventional
channels C L
h G d A
q h subin
CHF +
∆ −
=
′′ 0.25 ,
in f in
sub h h
h = −
∆ ,
(
)
G d F F Gh d A h fg h 5 . 0 2 1 0143 . 0 0 . 1 4 / 317 . 2 + =(
)
nh G F G d F C 1356 / 347 . 0 0 . 1 077 . 0 4 3 + = MPa in P P P P
n=2.0−0.5 R; R =0.145 out; out
(
)
[
]
{
exp20.891.0 0.917}
917 . 1
1 18.942
1 = PR −PR +
F
(
)
[
2.4441.0]
0.309exp 309 . 1 316 . 1 1
2 = − +
R R P P F F
(
)
[
]
{
exp16.6581.0 0.667}
667 . 1
1 17.023
3 = PR −PR +
F
649 . 1 3 4 FPR
Katto and Ohno [33]
Circular, conventional
channels
∆ + ′′ = ′′ fg in sub CHF h h K q q ,
0 1.0
( )
d L We Gh C q fg / 1 043 . 0 01 − = ′′( )
d L We Gh q f g fg / 0031 . 0 1 1 1 .0 1/3
133 . 0 02 + = ′′ − ρ ρ
( )
(
)
d L d L We Gh q f g fg / 0031 . 0 1 / 098 . 0 27 . 0 433 . 0 133 . 0 03 + = ′′ − ρ ρ( )
(
)
d L We We Gh q f g fg / 28 . 0 1 1 0384 .0 0.173 0.233
6 . 0 04 + = ′′ − ρ ρ
( )
(
)
d L d L We Gh q f g fg / 0031 . 0 1 / 234 . 0 27 . 0 433 . 0 513 . 005 +
= ′′ − ρ ρ 50 25 . 0 ; 2 < = = d L for C L G We f σρ 150 50 50 0009 . 0 25 .
0 ≤ ≤
− + = d L for d L C 150 34 . 0 > = d L for C
(
)
(
)
0.133 1/32 043 . 0 1 / / 0124 . 0 833 . 0 ; 261 . 0 − − + = = We L d K CWe K f g ρ ρ
(
)
(
)
0.6 0.173 233 . 0 3 / / 52 . 1 12 . 1 − − + = We L d We K f g ρ ρFor <0.15;
f g ρ ρ
When q01′′ <q02′′,q0′′=q01′′
When q01′′ >q02′′,if q02′′ <q03′′,q0′′=q02′′;if q02′′ >q03′′,q0′′=q03′′
When K1 >K2,K =K1;whenK1<K2,K =K2
For >0.15;
f g ρ ρ
When q01′′ <q05′′,q0′′=q01′′
When q01′′ >q05′′,ifq05′′ >q04′′,q0′′=q05′′;ifq05′′ <q04′′,q0′′=q04′′
Katto [34] Rectangular, conventional
channels
∆ + ′′ = ′′ fg in sub CHF h h K q q ,
0 1.0
( )
( )
d L We Gh C q d L Ghq fg fg
/ 1 ; / 1 25 .
0 0.043
02 01 − = ′′ = ′′
( )
d L We Gh q f g fg / 0077 . 0 1 1 15 .0 1/3
133 . 0 03 + = ′′ − ρ ρ
( )
(
)
d L d L We Gh q f g fg / 0077 . 0 1 / 26 . 0 171 . 0 433 . 0 133 . 0 04 + = ′′ − ρ ρ 50 34 . 0 ; 50 25 .0 < = >
= d L for C d L for C
(
)
(
)
0.133 1/33 043 . 0 2 1 / / 0308 . 0 556 . 0 ; 261 . 0 ;
1 = − = + −
= We L d K CWe K K f g ρ ρ When q01′′ <q02′′,q0′′=q01′′,K=K1
When q01′′ >q02′′,ifq02′′ <q03′′,q0′′=q02′′;K=K2
if q02′′ >q03′′,if q03′′ <q04′′,q0′′=q03′′;K=K3
if q03′′ >q04′′,q0′′=q04′′
Qu and Mudawar [13]
Rectangular,
dh = 0.38-2.54 mm 36 . 0 21 . 0 11 . 1 43 . 33 − − = ′′ e f g fg CHF d L We Gh q ρ ρ
In addition, Kandlikar [35] addressed flow boiling CHF in microchannels using
the forces present on the surface-liquid-vapor interface. The available non-dimensional
groups relevant to two-phase flow studies in microchannels are reviewed, and then two
new non-dimensional groups K1 and K2 are developed. The two new groups are
developed based on momentum force, inertia force, and surface tension force at the
surface-liquid-vapor interface.
A new non-dimensional group K1 is obtained from the ratio of evaporation
G L fg L G fg h G q D G D h q ρ ρ ρ ρ 2 2 2 ′′ = ′′ = 1
K (2)
Another n
![Figure 2.1 Typical pool boiling curve [9]](https://thumb-us.123doks.com/thumbv2/123dok_us/120255.11569/40.612.142.490.227.580/figure-typical-pool-boiling-curve.webp)