Images
Thomas A. Lampert, Simon E. M. O’Keefe and Nick E. Pears⋆
Department of Computer Science, University of York, York, U.K.
{tomal, sok, nep}@cs.york.ac.uk
Summary. Accurate feature detection is key to higher level decisions regarding image content. Within the domain of spectrogram track detection and classification, the detection problem is compounded by low signal to noise ratios and high track appearance variation. Evaluation of standard feature detection methods present in the literature is essential to determine their strengths and weaknesses in this domain. With this knowledge, improved detection strategies can be developed. This paper presents a comparison of line detectors and a novel linear feature detector able to detect tracks of varying gradients. It is shown that the Equal Error Rates of existing methods are high, highlighting the need for research into novel detectors. Preliminary results obtained with a limited implementation of the novel method are presented which demonstrate an improvement over those evaluated.
1 Introduction
Acoustic data received via passive sonar systems is conventionally transformed from the time domain into the frequency domain using the Fast Fourier Trans-form. This allows for the construction of a spectrogram image, in which time and frequency are are variables along orthogonal axes and intensity is repre-sentative of the power received at a particular time and frequency. It follows from this that, if a source which emits narrowband energy is present dur-ing some consecutive time frames a track, or line, will be present within the spectrogram. The problem of detecting these tracks is an ongoing area of research with contributions from a variety of backgrounds ranging from sta-tistical modelling [1], image processing [2, 3, 4] and expert systems [5]. This problem is a critical stage in the detection and classification of sources in pas-sive sonar systems and the analysis of vibration data. Applications are wide
⋆This research has been supported by the Defence Science and Technology
Lab-oratory (DSTL)1 and QinetiQ Ltd.2, with special thanks to Duncan Williams1
for guiding the objectives and Jim Nicholson2 for guiding the objectives and also
and include identifying and tracking marine mammals via their calls [6, 7], identifying ships, torpedoes or submarines via the noise radiated by their me-chanics [8, 9], distinguishing underwater events such as ice cracking [10] and earth quakes [11] from different types of source, meteor detection and speech formant tracking [12].
The key step in all of the applications and systems is the detection of the low level linear features. Traditional detection methods such as the Hough transform and the Laplacian line detector [13] degrade in performance when applied to low SNR images such as those tested in this paper. Therefore, it is valuable to conduct an evaluation of the standard line detection methods to evaluate performance, determine weaknesses and strengths which will give insight into the development of novel detection methods for application to this area. We also evaluate the performance of two novel feature detectors, the “bar” detector and a Principal Component Analysis (PCA) supervised learning detector [2].
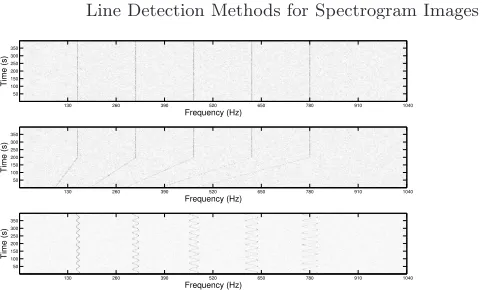
The problem is compounded not only by the low Signal to Noise Ratio (SNR) in spectrogram images but also the variability of the structure of tracks. This can vary greatly, including vertical straight tracks, sloped straight tracks, sinusoidal type tracks and relatively random tracks. A good detection strategy, when applied to this area, should be able to detect all of these.
A variety of standard line detectors have been proposed in image analysis literature, e. g. the Hough transform, Laplacian filter and convolution. There are methods from statistical modelling such as MaximumA Posteriori detec-tion. Nayar et al. [14] describe a more recent, parametric detector, proposing that a feature manifold can be constructed using a model derived training set (in this case a line model) which has been projected into a lower dimensional subspace through PCA. The closest point on this manifold is used to detect a feature’s presence within a windowed test image.
This paper is laid out as follows: in Section 2 we present the detection methods which have been evaluated with respect to spectrogram images and outline a novel bar detector. In Section 3 the results of these feature detectors applied to spectrogram images are presented and discussed. Finally, we present out conclusions in Section 4.
2 Method
Frequency (Hz)
Time (s)
130 260 390 520 650 780 910 1040 50
100 150 200 250 300 350
Frequency (Hz)
Time (s)
130 260 390 520 650 780 910 1040 50
100 150 200 250 300 350
Frequency (Hz)
Time (s)
130 260 390 520 650 780 910 1040 50
[image:3.612.198.443.76.221.2]100 150 200 250 300 350
Fig. 1. Examples of synthetic spectrogram images exhibiting a variety of feature complexities at a SNR of 16 dB.
was found to be too computationally expensive to fully evaluate (on such a large data set), although initial experimental results proved promising. Three examples of synthetic spectrogram images are presented in Fig. 1.
2.1 Bar Detector
Here we describe a simple line detection method which is able to detect linear features at a variety of angles, widths and lengths within an image. It is proposed that this method will also correctly detect linear structure within 2D non uniform grid data, and, can easily be extended to detect structure within 3D point clouds. The method allows for the determination of the detected line’s angle. It can also be easily extended to detect a variety of shapes, curves, or even disjoint regions.
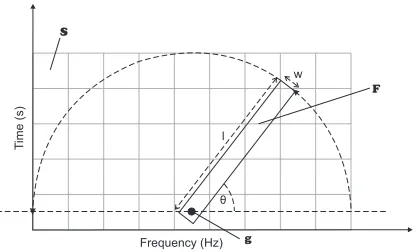
Initially we outline the detection of a line with a fixed length, along with its angle, and subsequently we extend this to the determination of its length. We define a rotating bar which is pivoted at one end to a pixel, g = [xg, yg] whereg ∈ S, in the first row of a time updating spectrogram im-age,Swheres= [xs, ys], and extends in the direction of thelprevious observa-tions, see Fig. 2. The values of the pixels,F ={s∈S:Pl(s, θ, l)∧Pw(s, θ, w)}, Eq. (1), which lie under the bar are summed, Eq. (2).
Pl(s, θ, l) ⇐⇒ 0≤[cos(θ), sin(θ)][s−g]T < l
Pw(s, θ, w) ⇐⇒
[−sin(θ), cos(θ)][s−g]T
<
w
2 (1)
whereθ is the angle of the bar with respect to thexaxis (varied between -π
2
and π
2 radians),wis the width of the bar and l is its length. To reduce the
computational load of determiningPw(s, θ, l) andPl(s, θ, l) for every point in the spectrogram, s can be restricted to xs = xg−(l+ 1), . . . , xg+ (l−1)
and ys = yg, . . . , yg + (l−1) (assuming the origin is in the bottom left of
l
w
θ
T
ime (s)
Frequency (Hz)
F
[image:4.612.200.408.95.221.2]g S
Fig. 2.The bar operator with widthw, lengthland angleθ.
B(θ, l, w) = 1
|F|
X
f∈F
f (2)
The bar is rotated through 180 degrees,θ= [−π
2,
π
2], calculating the
underly-ing summation at each∆θ.
Normalising the output ofB(θ, l, w), Eq. (3), forms a brightness invariant response, ¯B(θ, l, w) [14], which is also normalised with respect to the back-ground noise.
¯
B(θ, l, w) = 1
σ(B)[B(θ, l, w)−µ(B)] (3)
Once the rotation has been completed, statistics regarding the variation
of B(θ, l, w) can be calculated to enable the detection of the angle of any
underlying lines which pass through the pivoted pixel g. For example, the maximum response, Eq. (4).
θl= arg max θ
¯
B(θ, l, w) (4)
Assuming that noise present in a local neighbourhood of a spectrogram image is random the resulting responses will exhibit a low response. Conversely, if there is a line present the responses will exhibit a peak in one configuration, as shown in Fig. 3. Thresholding the response at the detected angle ¯B(θl, l, w) allows the differentiation of these cases.
Repeating this process, pivoting on each pixel,g, in the first row of a spec-trogram image and thresholding allows for the detection of any lines which appear during time updates. Thus, we have outlined a method for the detec-tion of the presence and angle of a fixed length line within a spectrogram.
−1.5 −1
−0.5 0
0.5 1
1.5 5
10 15
20 25
30
−2 0 2 4 6
l
θ
B(
θ
[image:5.612.211.391.108.209.2],l,w)
Fig. 3. The mean response of the bar when it is centred upon a vertical line 21 pixels in length (of varying SNRs) and rotated. The bar is varied in length between 3 and 31 pixels.
θl= arg max θ
X
l∈L ¯
B(θ, l, w) (5)
where L is a set of detection lengths. Once the line’s angle, θl, has been determined we can analyse ¯B(θl, l, w) asl increases to detect a line’s length. The response of ¯B is dependent on the bar’s length, as this increases, and extends past the line, it follows that the peak in the response will decrease, Fig. 3. The length of a line can thus be detected and its response tested against a threshold. This threshold will be chosen such that it represents the response obtained when the bar is not fully aligned with a line.
3 Results
In this section we present a description of the test data and the results ob-tained during the experiments.
3.1 Data
0 0.1 0.2 0.3 0.4 0.5 0.6 0.7 0.8 0.9 1 0
0.1 0.2 0.3 0.4 0.5 0.6 0.7 0.8 0.9 1
False Positive Rate
True Positive Rate Threshold
[image:6.612.185.421.107.252.2]Convolution Laplacian Random Guess Hough & Sobel Hough & Grey PCA Bar
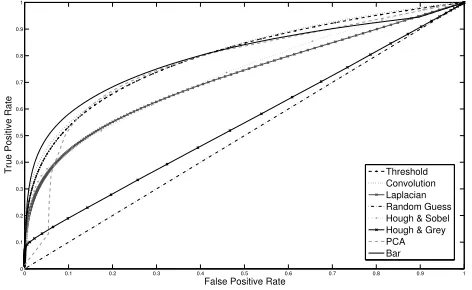
Fig. 4.Receiver Operator Curves of the evaluated detection methods.
The ground truth data was created semi automatically by thresholding (where possible) high SNR versions of the spectrograms. Spurious detections were then eliminated and gaps filled in manually.
3.2 Results
The parameters used for each method are as follows. The Laplacian and convo-lution filter sizes were 3x3 pixels. The threshold parameters for the Laplacian, bar, convolution and pixel thresholding were varied between 0 and 255 in steps of 0.2. Using a window size of 3x21 pixels the PCA threshold ranged from 0 to 1 in increments of 0.001. The Bar method’s parameters were set tow= 1 and
l= 21, and the detections were performed without the normalisation outlined in Eq. (3) and detecting θlby Eq. (4). The class probability distributions for the MAP were estimated using a gamma pdf for the signal class and a expo-nential pdf for the noise class. The PCA method was trained using examples of straight line tracks and noise only.
The Receiver Operator Curves (ROC) were generated by varying a thresh-old parameter which operated on the output of each method - pixel values above the threshold were classified as signal and otherwise noise. The ROC curves for the Hough transforms were calculated by varying the parameter space peak detection threshold. True Positive Rates (TPR) and False Posi-tive Rates (FPR) were calculated using the number of correctly/incorrectly detected signal and noise pixels.
It can be seen in Fig. 4 that the threshold and convolution methods achieve almost identical performance over the test set. With the Laplacian and Hough on Sobel line detection strategies achieving considerably less and the Hough on grey scale image performing the worst. The PCA supervised learning method proved more effective than these, and performed comparably with threshold-ing and line convolution, marginally exceedthreshold-ing both within the FPR range of 0.4 - 0.15. As previously mentioned, the PCA method was trained using ver-tical, straight track examples only, limiting its sinusoidal and gradiant track detection abilities. It is thought that with proper training, this method could improve further. Due to time restrictions, we present preliminary results ob-tained with the bar method, fixing the bar length to 21 and a width of 1. At a FPR of 0.5 it compares with the other evaluated methods, below a FPR of 0.45 this method provides the best detection rates. It is thought that the Hough on edge transform outperformed the Hough on grey scale transform due to the reduction in noise occurring from the application of an edge detec-tion operator. However, both of these performed considerably less well than the other methods due to their limitation of detecting straight lines.
4 Conclusion
In this paper we have presented a performance comparison of line detection methods present in the literature applied to spectrogram detection. We have also presented and evaluated a novel line detector. Preliminary testing shows performance improvements over standard line detection methods when applied to this problem. These results are expected to further improve when the multi scale ability is employed. Thresholding is found to be very effective and it is believed that this so because spectrograms with a SNR of 3 dB or more constitute 70% of the test database, circumstances which are ideal for a simple method such as thresholding. When lower SNRs are encountered however it is believed that thresholding will fall behind more sophisticated methods. Also, thresholding only provides a set of disjoint pixels and therefore a line detection stage is still required. It is noted that the PCA learning method was trained using examples of straight tracks but was evaluated upon a data set containing a large number of tracks with sinusoidal appearance, reducing its effectiveness. The evaluation of standard feature detection methods has highlighted the need to develop improved methods for spectrogram track detection. These should be more resilient to low SNR, invariant to non stationary noise and allow for the detection of varying feature appearances.
References
1. Paris, S., Jauffret, C.: A new tracker for multiple frequency line. In: Proc. of the IEEE Conference for Aerospace. Volume 4., IEEE (March 2001) 1771–1782 2. Lampert, T.A., O’Keefe, S.E.M.: Active contour detection of linear patterns in spectrogram images. In: Proc. of the 19th International Conference on Pattern Recognition (ICPR’08), Tampa, Florida, USA (December 2008) 1-4
3. Abel, J.S., Lee, H.J., Lowell, A.P.: An image processing approach to frequency tracking. In: Proc. of the IEEE Int. Conference on Acoustics, Speech and Signal Processing. Volume 2. (March 1992) 561–564
4. Martino, J.C.D., Tabbone, S.: An approach to detect lofar lines. Pattern
Recognition Letters17(1) (January 1996) 37–46
5. Mingzhi, L., Meng, L., Weining, M.: The detection and tracking of weak fre-quency line based on double-detection algorithm. In: Int. Symposium on Mi-crowave, Antenna, Propagation and EMC Technologies for Wireless Commu-nications. (August 2007) 1195–1198
6. Morrissey, R.P., Ward, J., DiMarzio, N., Jarvis, S., Moretti, D.J.: Passive
acoustic detection and localisation of sperm whales (Physeter Macrocephalus)
in the tongue of the ocean. Applied Acoustics67(November-December 2006)
1091–1105
7. Mellinger, D.K., Nieukirk, S.L., Matsumoto, H., Heimlich, S.L., Dziak, R.P., Haxel, J., Fowler, M., Meinig, C., Miller, H.V.: Seasonal occurrence of north
atlantic right whale (Eubalaena glacialis) vocalizations at two sites on the
sco-tian shelf. Marine Mammal Science23(October 2007) 856–867
8. Yang, S., Li, Z., Wang, X.: Ship recognition via its radiated sound: The fractal
based approaches. J. Acoust. Soc. Am.11(1) (July 2002) 172–177
9. Chen, C.H., Lee, J.D., Lin, M.C.: Classification of underwater signals using
neural networks. Tamkang J. of Science and Engineering3(1) (2000) 31–48
10. Ghosh, J., Turner, K., Beck, S., Deuser, L.: Integration of neural classifiers for passive sonar signals. Control and Dynamic Systems - Advances in Theory and
Applications77(1996) 301–338
11. Howell, B.P., Wood, S., Koksal, S.: Passive sonar recognition and analysis using hybrid neural networks. In: Proc. of OCEANS ’03. Volume 4. (September 2003) 1917–1924
12. Shi, Y., Chang, E.: Spectrogram-based formant tracking via particle filters. In: Proc. of the IEEE Int. Conference on Acoustics, Speech and Signal Processing. Volume 1. (April 2003) I–168–I–171
13. Gonzalez, R.C., Woods, R.E.: Digital Image Processing (3rd Edition). Prentice-Hall, Inc., Upper Saddle River, NJ, USA (2006)
14. Nayar, S., Baker, S., Murase, H.: Parametric feature detection. Int. J. of
Computer Vision27(1998) 471–477