REGIONAL DIFFERENCES IN FERTILITY
IN THAILAND
by
Phandhipaya Dharmasaroja, B.A. (Econ.)
A thesis submitted in partial fulfilment of the requirements for the degree of
Master of Arts (Demography) in the Australian National University.
The author works at the Division of Public Health Statistics, Ministry of Public Health where birth and death registration statistics are prepared. The birth registration data have proved to be valuable for
fertility analysis. Except where otherwise indicated, this thesis is the author's own work.
H i
ACKNOWLEDGEMENTS
Grateful acknowledgements are owed to the Australian Government and the Thai Government for giving the author an opportunity to study in the M.A. Programme in Demography at the Australian National University.
The author wishes to express her gratitude to her supervisor, Dr S.K. Jain, for his invaluable assistance and advice. The author is also grateful to
Dr David Lucas and Dr P.F. McDonald, the other lecturers in the programme.
Many special thanks are due to Mrs Jenny Widdowson for her assistance in the computer processing of the data, to Peter Waddell-Wood for his helpful correction of English and especially to the two respectable friends,
Jawalaksana Rachapaetayakom and Suvathana Vibulsresth for lending their demographic books and giving useful advice.
Thanks are also extended to Pat Gilbert, Tania Sherliamoff and Sylvia Boyle and the staff of the Development Studies Centre and Australian Development
Assistance Bureau who helped the author about her education, and to all at the Division of Public Health Statistics, Ministry of Public Health, Bangkok, for preparing the data used in the thesis.
A very special thanks must go to the parents of the author, who gave moral support and encouragement in the study. It is to them that this thesis is dedicated.
ABSTRACT
This thesis is concerned with an analysis of changes in fertility levels and patterns for Thailand and differences in fertility for the four regions, the North, Northeast, Central and South. The data used are the 1960 and 1970 Censuses and the birth registration data for 1975 to 1978. Some data from the Longitudinal Surveys and the Survey of Fertility in Thailand (SOFT) are used to explain these changes and regional differences in fertility.
During the intercensal period 1960-70, the decline in fertility occurred in all regions except the South. The age shape of the fertility schedules for all four regions was similar during that period. However, the mean age of the fertility schedules was lower in North and South than in Northeast and Central regions.
The adjusted birth registration data suggested that the decline in fertility was accelerating between 1975 and 1978. The decline occurred in all regions, especially the North and South. The regional fertility level during this period indicates that South has the higher fertility followed by Northeast, Central and North in that order.
This study suggests that since the mid 1960s the age pattern of fertility for the whole country has shifted towards a younger pattern. The change in pattern is more obvious between 1975 and 1978, especially in both the North and Central Regions and the rural sectors of Thailand.
TABLE OF CONTENTS
V
Page
ACKNOWLEDGEMENTS iii
LIST OF TABLES viii
LIST OF FIGURES X
CHAPTER
1 GENERAL KNOWLEDGE OF FERTILITY IN THAILAND 1
1.1 Objective of the Study 1
1.2 Review of Relevant Literature 1
1.2.1 Thailand 1
1.2.2 Demographic Data in Thailand 2
1.2.3 Fertility Levels and Patterns in Thailand 4
1. Fertility Levels 4
2. Fertility Patterns in Thailand 7 3. Regional Levels and Patterns of Fertility 10
4. Urban-Rural Fertility 15
1.2.4 Economic and Social-Cultural Differentials
in Fertility 16
1.2.5 Demographic Factors Influencing Fertility 20 1.2.6 Gaps in the Knowledge of Fertility in Thailand 24
1.3 Organisation of the Study 26
2 FERTILITY BASED ON CENSUS DATA 27
2.1 The 1960 and 1970 Census Data 27
2.1.1 Adjustment of the 1960 Census Data 27 2.2 Fertility as Measured by Average Parity from the 1960
and 1970 Censuses 30
2.2.1 Fertility for the Whole Country 30 2.2.2 Regional Differences in Average Parity 34 2.2.3 Urban-Rural Differences in Average Parity in 1970
Chapter Page
2.3 Fertility Level and Pattern as Derived from Average
Parity for the Intercensal Period 1960-1970 38 2.3.1 Fertility for the Whole Country 40 2.3.2 Regional Differences in Total Fertility Rates,
Age Pattern of Fertility and Mean Age of
Fertility Schedule 40
2.4 Summary 45
3 FERTILITY BASED ON REGISTRATION DATA 47
3.1 Background of Vital Registration and Statistics in Thailand 47
3.1.1 General Background 47
3.1.2 Registration of Births 47
3.1.3 Birth Certificates 48
3.1.4 Flow of Birth Certificates and Reports Used for
Compiling Birth Statistics 51
3.2 Evaluation of Completeness of Birth Registration Data 53 3.2.1 Completeness of Birth Registration Data 53
3.2.2 Data Used in the Analysis 58
1. Population Projection 58
2. Birth Registration Data 60
3.3 Fertility Levels and Patterns Based on Registration Data
for 1975-1978 60
3.3.1 Fertility for the Whole Country 62 3.3.2 Regional Differences in Total Fertility Rate,
Age Pattern of Fertility, and Mean Age of
Fertility Schedule 67
3.3.3 Urban-Rural Differences in Fertility 78
3.4 Summary 66
4 SUMMARY OF FINDINGS AND SOME EXPLANATIONS 81 4.1 Fertility Changes During the Periods 1960-1970 and 1975-1978
81 4.1.1 Fertility for the Whole Country 81
4.1.2 Fertility by Region 85
vii
Chapter Page
4.2 Factors Affecting Fertility Changes for the Whole
Country 1960-1978 87
4.2.1 Nuptiality Patterns 87
4.2.2 Contraceptive Knowledge and Use 90 4.3 Reasons for Regional Differences in Fertility 91 4.3.1 Proportion of Female Population Remaining Single 91 4.3.2 Contraceptive Knowledge and Use 92
4.4 Summary 95
REFERENCES 97
APPENDIX Appendix A : Mean Age of Fertility Schedule by Region,
Table Title Page
1.1 Fertility Levels of Thailand for Different Periods and
Various Sources 5
1.2 Age Pattern of Fertility in Thailand by Sources and Periods 8
1.3 Number of Children Ever Born per Woman by Age, Urban,
Rural Areas and Regions, 1970 11
1.4 Number of Own Children 0-4 Years per Ever-Married Woman
by Age, Urban, Rural Areas and Regions, 1970 12
1.5 Age Pattern of Fertility by Regions from the Survey of
Population Change 1964-65 and 1974-75 14
1.6 Mean Number of Children Ever Born to Women Ever Married by
Residence from the Survey of Fertility in Thailand, 1975 15
1.7 Marital Fertility Rates During the Year Prior to the Survey
by Age and Place of Residence for Currently Married Woman, 15-49
17
1.8 Percentage Distribution of Women in Each Childbearing Age
Group, 1960 and 1970 21
2.1 Average Number of Children Ever Born per Woman Aged 15-49
Between 1960 and 1970 29
2.2 Number of Children Ever Born per Woman by Age and the Annual
Per Cent Change in the Number of Children Ever Born, Thailand,
1960 and 1970 31
2.3 Annual Per Cent Change in Fertility as Measured by TFR from
Different Sources 32
2.4 Average Number of Children Ever Born per Woman Aged 15-49
and Annual Per Cent Change in CEB by Region, Thailand, 1960-1970 34
2.5 Number of Children Ever Born per Woman by Age and Region,
1960 and 1970 36
2.6 Children Ever Born per Woman by Age for Urban and Rural Areas,
Thailand, 1970 37
2.7 Average Number of Children Ever Born per Woman Aged 15-49 Years
for Urban-Rural Areas by Region, 1970 38
A Constants for Calculating Factors for Converting Ten Year Average
Parity Change into Age Specific Fertility Rates 39
ix
Table Title Page
2.9 Per Cent Change in Age Pattern of Fertility in Thailand from
Selected Sources for the Periods 1960-1970 and 1964-65 to
1974- 75 44
3.1 Per Cent Completeness of Birth Registration for Thailand by
Sources and Periods 54
3.2 Cumulated Cohort Fertility and Estimates of Registration
Completeness for 1956-1975, Thailand 56
3.3 Parity Increments and Cumulated Registered Fertility Increments
for Cohorts, 1970-1975, Thailand 57
3.4 Age Specific Fertility Rate from Registration Data by Region
(Adjusted and Unadjusted), 1975 51
3.5 Per Cent Distribution of Live-Births by Age of Mother
(Registered Births), Thailand, 1971-1978 52
3.6 Age Pattern of Fertility Based on Registration Data in Thailand
for 1975 to 1978 54
3.7 Age Pattern of Fertility in Thailand from Selected Sources and
Periods 55
3.8 Total Fertility Rates by Region and Period, Thailand 88
3.9 Total Fertility Rate and Annual Per Cent Decline in TFR by
Region, Thailand, 1975-1978 59
3.10(a-d)Age Pattern of Fertility by Region, Thailand, 1975-1978 71-74
3.11 Age Pattern of Fertility by Urban-Rural Areas, Thailand,
1975- 1978 79
4.1 Per Cent Distribution of Women Ever-Married by Current
Exposure Status by Current Age, Thailand, 1975 83
4.2 Per Cent Pregnant by Age Group for Currently Married Women,
Thailand, 1975 84
4.3 Female Per Cent Single by Age, Thailand, 1960, 1970 and 1975 88
4.4 Median Age at Marriage by Age, Thailand, 1975 89
4.5 Female Per Cent Single by Age, and Region, Thailand, 1970 92
4.6 Per Cent of Women Ever-Married Who Had Ever Used a Contraceptive
Figure Title Page
2.1
3.1
3.2
3. 3
3.4
Age Pattern of Fertility by Region for the Intercensal Period 1960-1970
Flow of Birth Certificate
Age Pattern of Fertility, Thailand
Age Pattern of Fertility by Region, 1975
Age Pattern of Fertility by Region,
43
52
66
76
CHAPTER 1
GENERAL KNOWLEDGE OF FERTILITY IN THAILAND
1 '1 o b j e c t i v e OF THE STUDY
The study will be supplementary to the fertility analysis that has been done so far. The objectives of the study are as follows:
1. To establish fertility levels and patterns for Thailand as well as for regions and urban-rural areas during 1975-1978
from registration data;
2. To analyse regional differences in fertility;
3. To compare fertility estimates from birth registration data with those from other sources;
4. To examine the variation of fertility according to changes in demographic and socio-economic variables.
1-2 REVIEW OF RELEVANT LITERATURE 1.2.1 Thailand
Thailand is one of the developing countries in Southeast Asia experienc ing the phenomenon of rapid population growth. The growth rate of popul ation which remained high at a level around 3.4 per cent between 1947 and 1960 started to decline since 1960 and at present stands at 2.3 per cent
(Thailand, 1979). The fertility is still at a high level although a significant declining started in the mid-1960s. The rate of mortality decreased rapidly after World War II due to improvements in public health
facilities and the adoption of modern medical technology.
The kingdom is divided into four regions: North, Northeast, Central and South, with an overall population of about 45 million in 1978
fertility. According to the 1970 census, the Northeast Region, the least developed region, is showing the highest fertility. The fertility of the
South is only slightly lower than the Northeast (Chamratrithirong and Boonpratuang, 1977).
Within a region, urban areas are defined as municipal areas and rural areas as non-municipal areas. Fertility of women in rural areas is
generally higher than that of women in urban areas.
Being the economic and political centre of the country, Bangkok Metropolis is characterized by a higher level of urbanization than any other area in the country and has the lowest fertility.
1.2.2 Demographic Data in Thailand
The sources of data that are available for fertility analyses are the population censuses, registration data and demographic surveys. Currently, there are five major sources:
1. Population Census. A population census in Thailand was first conducted for the whole kingdom in 1911. The 1911 census was followed by censuses in 1919, 1929, 1937, 1947, 1960 and 1970. The question on the number of children ever born was first asked in the 1960 census, and the question on the number of children living was asked for the first time in 1970.
2. Vital Registration Statistics. The registration of live-births and deaths in Thailand began in the Bangkok area in 1909
(Vicharnrathakan and Arnold, 1977). In 1916 the registration of live births and deaths was made compulsory throughout Thailand.
Registration data was considered to be incomplete due to under-registration for several reasons (Thailand, 1969a). The Survey of Population Change in 1964-65 estimated that only about 85 per cent of all births occurring were
3
of Population Change in 1974-75 (Thailand, 1976) . Despite its limitations the registration data provides useful information on number and rates of births and deaths for Thailand from 1937 onwards (Thailand, 1975).
3. Dual Record Type Surveys of Population Change (SPC) 1964-1967 and 1974-1976. The Surveys of Population Change were conducted by the National Statistical Office on a national basis in order to estimate reliable birth and death rates by age and sex and to determine the extent of under-registration of births and deaths in the country. The surveys were based on the Chandra-Demming method of data collection (Thailand, 1976). Bangkok and Thonburi were excluded from the first survey in 1964-67, but were included in the second survey 1974-76.
4. Longitudinal Study of Economic, Social and Demographic Change (LS) in 1969-70 and 1972-73. The survey was conducted by the Institute of Population Studies, Chulalongkorn University in 1969-1970 for the first round and in 1972-1973 for the second round. The urban surveys were one year later than the rural surveys for both rounds. These surveys allowed the analysis of fertility mortality and migrational behaviour in relation to the socio-economic political and demographic factors at national level and for urban-rural differentials.
1.2.3 Fertility Levels and Patterns in Thailand 1. Fertility Levels
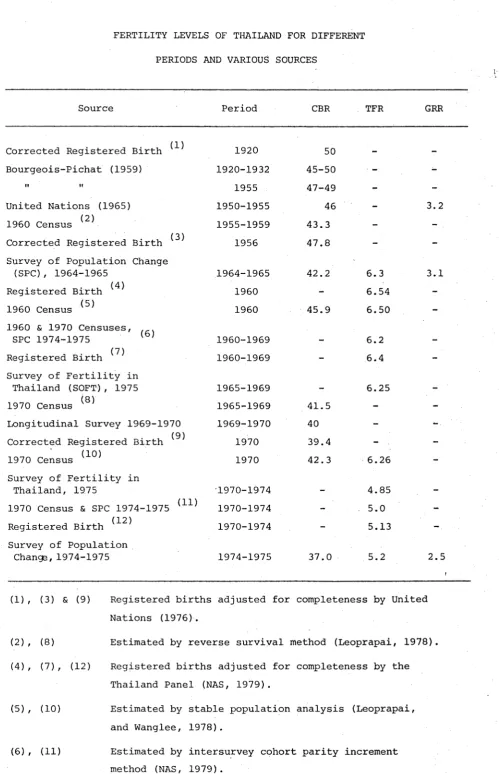
Thailand has had high levels of fertility in the past, similar to other less developed countries. At present, fertility rates remain at a relatively high level although evidence for a declining fertility exists. Fertility levels in Thailand have been estimated for several periods for the purpose of making population projections and other analyses. Table 1.1 shows the fertility levels of Thailand for different periods from various sources.
Crude Birth Rate. The crude birth rate was estimated to be around 45-50 births for thousand population in the early 1920s, which more or less remained at that level up to the early 1950s (Bourgeois-Pichat, 1959; United Nations, 1965).
Crude birth rate based on unadjusted registered births showed a steady increasing trend from the early 1950s to the late 1960s with the rate
ranging from 26.8 to 38.1 live-births per thousand population. Thereafter the crude birth rate shows a slightly declining trend up to the present time
(Thailand, 1975). Crude birth rate based on corrected registered births showed only 18 per cent decrease over 14 years from 47.8 live births per thousand population in 1956 to 39.4 live births per thousand population in 1970 (United Nations, 1976).
Total Fertility Rate. Recently the total fertility rate became an indicator of fertility level. The total fertility rate estimated from the first Survey of Population Change for the period 1964-1965 was 6.3, dropped to 5.2 in the period of the second survey 1974-1975. The rate declined by about 18 per cent during these two periods (Thailand, 1976).
[image:14.557.51.547.38.411.2]TABLE 1.1 5
FERTILITY LEVELS OF THAILAND FOR DIFFERENT
PERIODS AND VARIOUS SOURCES
Source Period CBR TFR GRR
Corrected Registered Birth (1) 1920 50
Bourgeois-Pichat (1959) 1920-1932 45-50 -
-II II
1955 47-49 -
-United Nations (1965) 1950-1955 46 - 3.2
(2)
1960 Census 1955-1959 43.3 -
-Corrected Registered Birth (3) 1956 47.8 -
-Survey of Population Change
(SPC), 1964-1965 1964-1965 42.2 6. 3 3.1
(4)
Registered Birth 1960 - 6.54
-1960 Census ^ 1960 45.9 6.50
-1960 & 1970 Censuses,
SPC 1974-1975 6 1960-1969 — 6.2 —
(7)
Registered Birth 1960-1969 - 6.4
-Survey of Fertility in
Thailand (SOFT), 1975 1965-1969 - 6.25
-(8)
1970 Census 1965-1969 41.5 -
-Longitudinal Survey 1969-1970 1969-1970 40 -
-Corrected Registered Birth (9) 1970 39.4 -
-1970 Census 1970 42.3 6.26
-Survey of Fertility in Thailand, 1975
(ID
1970-1974 - 4.85
-1970 Census & SPC 1974-1975 1970-1974 - 5.0
-Registered Birth 1970-1974 - 5.13
-Survey of Population
Change, 1974-1975 1974-1975 37.0 5.2 2.5
)
(1), (3) & (9) Registered births adjusted for completeness by United
Nations (1976).
(2), (8) Estimated by reverse survival method (Leoprapai, 1978).
(4), (7), (12) Registered births adjusted for completeness by the
Thailand Panel (NAS, 1979).
(5), (10) Estimated by stable population analysis (Leoprapai,
and Wanglee, 1978).
[image:15.557.45.545.37.812.2]between 1965-1969 and 1970-1974 (Thailand, 1977a). The above rates were later adjusted to be 6.46 and 5.09 by the application of a new method of calculating the fertility rate for five year age group from incomplete data and applying the 1970 census proportions ever-married to the marital
fertility rates (NAS, 1979).
Gross Reproduction Rate. Another measurement of fertility levels that was calculated in earlier analyses was the gross reproduction rate. These rates were estimated for the period 1950 to 1960 by using the 1960 census data, the Survey of Population Change 1964-65 and also registration data.
The gross reproduction rate was estimated by the United Nations (1965) for the period 1950-55 to be about 3.2 and remained unchanged at a level of 3.1 in 1964-65 estimated from the Survey of Population Change (Arnold, et al, 1977). The rate declined substantially to a 2.5 according to the 1974-75 Survey of Population Change (Thailand, 1976).
Estimates of Fertility by the Thailand Panel. Recently the Thailand Panel, sponsored by the National Academy of Science, U.S.A., studied
fertility and mortality change in Thailand during 1950-1975 (NAS, 1979). The cohort parity increment method was applied to the 1960-1970 censuses and to the Survey of Population Change 1974-75 to estimate the age specific fertility rates for the periods 1960 to 1969 and 1970 to 1974. The total fertility rate derived from the method was 6.2 for the period 1960 to 1969 and 5.0 for the period 1970 to 1974.
The registration data for the period 1960-1969 and the period 1970-74 was adjusted by the Thailand Panel (NAS, 1979). The adjusted registration data yielded total fertility rates for 6.44 and 5.13 for the periods
7
The summary of the findings of the Thailand Panel was that the level of 'total fertility rate' in the early 1960s was in the range 6.3 to 6.6 and began to decline fairly sharply in the mid 1960s. The decline continued through the early 1970s with the level in 1975 being somewhere in the range 4.5 to 4.9 (NAS, 1979).
Thus, in the past, the fertility level had been fairly constant at a high level throughout most of the twentieth century, with the exception of a slight decline caused by World War II. The decline in fertility was evident only from the mid 1960s as illustrated by the various sources of the recent estimation of fertility. Although the statistical figures on fertility estimation might be different, they all showed a declining trend. The fertility still continues to decline in response to the family planning activities and increasing urbanization, the aspects that will be described later.
2. Fertility Patterns in Thailand
The national information currently available for fertility patterns was collected from the 1960 and 1970 censuses, the Survey Population Change, the Longitudinal Study of Social, Economic and Demographic Survey, and the Survey of Fertility in Thailand.
Source
| 1 Period
i TFR
Percent Age Distribution of Age group
Fertility
Mean Age 15-19 20-24 25-29 30-34 3 5-39 40-44 45 -49
1960 C e n s u s ^ I960 6.57 5.7 19.0 24. 7 22.4 17.2 9.1 2.0 30.58
1960 C e n s u s ^ 1960 6.63 5.2 16.6 23.6 22.9 18.3 9.9 3.5 31.31
1960 C e n s u s ^ 1960 6.53 5.2 16.6 23.6 22.9 18.3 9.9 3.5 31.31
(4)
Registered births 1960 6. 42 4.1 20.3 24.6 21.6 18.1 9.0 2.2 30. 76
19 70 5.94 5.2 22.7 24. 2 20.5 16.7 8.5 2.2 30.26
SPC 1964-65,1974-75 1964-1965 6.30 5.3 20.6 24.0 21. 7 17.7 8.9 1.9 30.51
1974-1975 5.17 8.1 23.9 24.6 19.7 14.9 7.4 1.4 29.35
(5)
1970 Census 1960-1964 6.48 6.6 21.1 24.2 21.7 16.6 8.2 1. 5 30.04
1960 & 1970 Censu!6)
1965-1969 6.19 7.2 21.6 24.2 21.0 16.6 8.1 1.5 29.98
1960-1970 6.17 6.5 20.5 24.4 22.0 16.9 8.2 1. 5 30. 15 and SPC 1974-75 1970-1975 5.04 7.5 21.1 23.3 20.0 14. 8 10.8 2.5 30. 31 Longitudinal ^
Survey 1968-1969 6.11 5.9 20.9 23.4 18. 7 16.2 12.4 2.4 30. 76
1971-1972 5.34 6.6 21.4 26.9 16. 7 15. 5 11.5 1. 3 30. 14 Survey of Fertility 1965-1969 6.25 5.6 20.0 23.2 20. 8 16. 8 12.0 1.6 30.78 in Thailand (SOFT)1975 1970-1974 4.85
|
7.2 22.7 22.7 18.6 17.5 8.2 3.1 30. 18
NOTE: The percentage distribution of fertility was calculated from age specific fertility rates from the various sources.
(1) Adjusted number of children ever born from the 1960 Census by Thip Chalothorn (1967). (2) Dasgupta estimated ASFR based on census data on children ever born (1965).
[image:18.557.36.539.75.411.2]9
and per cent age distribution of fertility which was calculated from age specific fertility rates from various sources.
Age Specific Fertility Rates From Corrected Registration Data.
Estimates of age specific fertility rates for the census years 1960 and 1970, made by correcting the registration data on births by age of mother, indicated a decline in fertility for most age groups except the two youngest age groups (15-19 and 20-24). The increase in fertility rates for women in the ages 15-24 between 1960-1970 can largely be explained in terms of the increase in proportion of ever-married women in that age group during that period (United Nations, 1976). The proportions of ever-married women increased from 13.8 per cent in 1960 to 19.0 per cent in 1970 for the age group 15-19 and from 61.2 per cent in 1960 to 62.0 per cent in 1970 for the age group 20-24 (United Nations, 1976).
Age Specific Fertility Rates From the Survey of Population Change, The results of the surveys for the periods 1964-1965 and 1974-1975 illustrated a decline in age specific fertility rates for all age groups except ages 15-19 during those periods. The decline in ASFR was more' sharply evidenced in the older age groups, but this interpretation must take into account the excluding of Bangkok-Thonbury from the 1964-1967 survey (Thailand, 1976).
Age Specific Fertility Rates from the Survey of Fertility in Thailand. Age specific fertility rates estimated from the Survey of Fertility in Thailand for the periods 1965 to 1969 and 1970 to 1974 showed that the fertility of women aged 30 years and over declined significantly, while
fertility for women aged 20 to 24 years changed very little (Thailand, 1977&).
Age Specific Fertility Rates from Own Children Technique.
for all age groups except the youngest for the periods 1960 to 1964 and 1965 to 1969. In both periods the fertility increased sharply from age 15-19 to its peak at age 25-29 and then decreased gradually until the end of
reproductive period (Retherford and Cho, 1978).
Age Specific Fertility Rates From Cohort Parity Increment Method. The age specific fertility rates for the periods of 1960 to 1969 and 1970 to 1974 had been estimated from the parity increment of successive
cohorts using the 1960 and 1970 censuses and the 1974-75 Survey of Population Change. Similar to other estimates, age specific fertility rates reached a peak at age 25-29 and declined as age increased. The age specific fertility rates declined in all age groups except age groups 40-44 and 45-49 between the periods 1960-1970 and 1970-1974 (NAS, 1979).
Age Specific Marital Fertility Rate From the Longitudinal Survey. The data from the first round of the LS showed that marital fertility by age group was highest among currently married women aged 20-24 and declining with age until the end of the reproductive age (Knodel and Prachuabmoh, 1975) .
Mean Age of Fertility Schedule.
During 1960 and 1970, mean age of fertility schedule remained around 30 years and dropped to 29 years in the early 1970s.
3. Regional Levels and Patterns of Fertility
11
The 1970 Census.
According to the 1970 Census, the average number of children ever born per woman aged 15-49 years in the Central Region was 2.47, the lowest of all regions. The corresponding number for the Northeast Region was 3.02. The fertility of women in the North and South Regions, as shown by the
average number of children ever born per woman aged 15-49 years, displayed an intermediate level (Chamratrithirong and Boonpratuang, 1977). See Table 1.3.
TABLE 1.3
NUMBER OF CHILDREN EVER BORN PER WOMAN BY AGE URBAN, RURAL AREAS AND REGIONS, 1970
Area
15-49 15-19 20-24 25-29 30-34 35-39 40-44 45-49
Whole Kingdom 2.79 0.13 1.00 2.45 3.88 5.16 5.94 6.12
Urban areas 1.92 0.08 0.58 1.59 2.83 3.94 4.59 4.86
Rural areas 2.94 0.14 1.09 2.60 4.06 5.35 6.15 6.30
Northern Region 2.87 0.12 1.05 2.49 3.93 5.13 5.81 5.99
Urban areas 2.13 0.09 0.66 1.63 2.94 4.09 4.76 4.77
Rural areas 2.92 0.13 1.08 2.56 3.99 5.19 5.88 6.08
Northeastern Region 3.02 0.13 1.16 2.66 4.23 5.68 6.58 6.75
Urban areas 2.09 0.08 0.75 1.92 3.18 4.42 5.19 5.36
Rural areas 3.05 0.13 1.18 2.69 4.28 5.73 6.63 6.79
Central Region 2.47 0.10 0.76 2.13 3.48 4.62 5.49 5.63
Urban areas 1.83 0.07 0.53 1.50 2.73 3.81 4.46 4.77
Rural Areas 2.79 0.13 0.90 2.46 3.84 4.99 5.93 5.97
Southern Region 2.85 0.22 1.12 2.57 3.92 5.11 5.65 5.85
Urban areas 2.24 0.12 0.78 1.93 3.19 4.25 4.90 5.14
Rural areas 2.94 0.24 1.16 2.66 4.01 5.22 5.74 5.93
[image:21.557.33.536.183.816.2]NUMBER OF OWN CHILDREN 0-4 YEARS PER EVER-MARRIED WOMAN BY AGE, URBAN, RURAL AREAS AND REGIONS, 1970
Area Age
15-49 15-19 20-24 25-29 30-34 35-39 40-44 45-49
Whole Kingdom 1.02 0.59 1.25 1.44 1.27 1.05 0.69 0.23
Urban areas 0.78 0.59 1.08 1.20 0.95 0.66 0.39 0.16
Rural areas 1.06 0.59 1.27 1.48 1.32 1.11 0.73 0.24
Northern Region 0.91 0.55 1.19 1.31 1.13 0.95 0.58 0.18
Urban areas 0.72 0.58 1.08 1.19 0.87 0.62 0.39 0.11
Rural areas 0.92 0.55 1.19 1.32 1.15 0.98 0.59 0.18
Northeastern Region 1.16 0.56 1.31 1.58 1.45 1.23 0.83 0.28
Urban areas 0.92 0.47 1.11 1.32 1.13 0.83 0.55 0.23
Rural areas 1.17 0.56 1.32 1.58 1.46 1.24 0.84 0.28
Central Region 0.96 0.62 1.20 1.39 1.16 0.93 0.63 0.21
Urban areas 0.76 0.61 1.06 1.17 0.92 0.63 0.37 0.16
Rural areas 1.04 0.63 1.27 1.49 1.27 1.06 0.74 0.23
Southern Region 1.02 0.65 1.24 1.37 1.31 1.06 0.68 0.23
Urban areas 0.87 0.69 1.16 1.32 1.08 0.76 0.43 0.14
Rural areas 1.03 0.65 1.25 1.37 1.34 1.09 0.70 0.24
Source: From Table 2 in 1970 Population and Housing Census, Fertility, Subject Report No. 3 (Chamratrithirong and Boonpratuang, 1977).
13
Considering the own children ratio by age, fertility was highest for females aged 25-29 for all regions. The own children ratio by age in the North was the lowest for women under 35 years old. See Table 1.4.
The Survey of Population Change 1974-75.
The results from the Survey of Population Change for the period 1974-75 showed that the Northeast and the South had the highest total fertiltiy rates, while the rate in Bangkok Metropolis was lowest. Compared with the figure for the period 1964-1965, the total fertility rate in 1974-75 showed a considerable decline in the North and a slight increase in fertility in the South. See Table 1.5
The age pattern of fertility varied considerably by region. From the 1974-75 SPC, the fertility of the women in the Northeast and the South was the highest among women aged 20-24, which was changed from the pattern shown by the 1964-65 SPC.
The Survey of Fertility in Thailand 1975.
The Survey of Fertility in Thailand clearly illustrated regional
differences in cumulative fertility. The cumulative fertility was highest in the Northeast and the South with respectively 4.3 and 4.1 children ever born to ever married woman. The North and the Central Region (excluding Bangkok Metropolis) had an average of 3.8 children ever born. The data from the Survey of Fertility are shown in Table 1.6
The Thailand Panel.
[image:23.557.44.533.51.511.2]A G E P A T T E R N O F F E R T IL IT Y B Y R E G IO N S F R O M T H E S U R V E Y O F P O P U L A T IO N C H A N G E 1 9 6 4 -6 5 A N D 1 9 7 4 -7 5
QJ <C
<U O a) o
^ CQ
TABLE 1.6 15
MEAN NUMBER OF CHILDREN EVER BORN TO WOMEN EVER MARRIED BY RESIDENCE FROM THE SURVEY OF FERTILITY IN THAILAND, 1975
Place Mean Number of Children
Ever Born
Whole Kingdom 3.9
Residence
Urban 3.3
Rural 4.0
Region of Residence
North 3.8
Northeast 4.3
South 4.1
Central 3.6
Bangkok Metropolis 3.2
Source: Table 18 in The Survey of Fertility in Thailand;Country Report, No. 1, Volum 1, p. 50 (Thailand, 1977a).
the Northeast and the South, with rates of 7.25 and 6.09 respectively. The North had a TFR of 5.92 which was similar to that experienced by the Central Region (5.44). For 1970-1974, the TFR for the whole kingdom was 5.13. These rates were also high in the Northeast and the South with 6.32 and 6.17 respectively. The North had a TFR of 4.39 while the Central Region still had the lowest TFR of 3.63 (NAS, 1979).
4. Urban-Rural Fertility
The evidence from various sources showed that fertility in urban areas was lower than that in rural areas.
The 1970 Census.
places. Considering these data by age, both ever-married women and all women in urban areas had lower fertility than those in rural areas for all age groups with the exception of the fertility of ever-married women aged 15-19 years (Chamratrithirong and Boonpratuang, 1977).
Data on own children in the 1970 census showed substantial urban-rural differences. The number of own children per ever-married woman was
substantially lower in the urban areas. Considering the own children ratio by age of mother, the fertility was lower for urban women in all age groups, except for age group 15-19. Rural and urban women had the same pattern of fertility that reached its peak at age 25-29 and declined thereafter, but in rural areas, the fertility for age groups 30-34 and 35-39 declined at a slower rate than in urban areas (Chamratrithirong and Boonpratuang, 1977).
Marital Fertility from Longitudinal Survey.
The study of overall marital fertility from the first round of the Long itudinal Survey showed a substantial difference in marital fertility, which was highest among women aged 20-24 and declined with age. For most ages, marital fertility was highest for rural women and lowest for women residing in Bangkok-Thonburi (Bangkok Metropolis). The study of the Longitudinal Survey found that the marital fertility rates had not changed in rural areas over the last 30 years, but there was a substantial decline in marital
fertility among urban women (Knodel and Prachuabmoh, 1973a). See Table 1.7 below.
TABLE 1.7 17
MARITAL FERTILITY RATES DURING THE YEAR PRIOR TO THE SURVEY BY AGE AND PLACE OF RESIDENCE FOR
CURRENTLY MARRIED WOMAN, 15-49
Age Rural Provincial Bangkok Combined
Urban Thonburi Rural and
Urban Samples
1968/69 1969/70 1969/70 (Weighted)
15-19 .421 .281 . 320 .405
20-24 .463 .352 . 342 .442
25-29 . 353 .325 .267 .341
30-34 .297 .166 .169 .270
35-39 .237 .124 .089 .215
40-44 .210 .140 .029 .190
45-49 .042 .000 .043 .039
15-49 .272 .193 .165 .256
Source: Knodel and Prachuabmoh, 1973a.
have played an important role in the recent fertility decline in Thailand.
1. Fertility Differential According to Place of Residence. As shown in the regional level and pattern section, fertility seems to be much
associated with place of residence. Evidence from various sources examined earlier showed that fertility levels in rural areas were much higher than those in provincial urban areas. Bangkok Metropolis which was the most urban area had the lowest fertility.
of women engaged in crafts, professional and administrative work and in
service and transportation varied within a relatively narrow range of 3.5-3.6 per woman (Goldstein, 1972).
It is not possible to compare the fertility for each occupational group for different periods because the classification and the presentation of data is different. The findings from the 1970 census were that the fertility of economically active women did not differ much from that of all women, but in the municipal areas, the fertility of economically active women was lower than that of all women. In rural areas, the fertility difference was almost negligible. The children ever born data showed the highest fertility amongst the agricultural workers. The lowest fertility was among the professional, administrative and clerical groups (Chamratrithirong and Boonpratuang, 1977).
From the Longitudinal Survey data it was found that fertility differentials by husband's occupation among rural women were not substantial, compared to those among urban women. In urban areas, the number of children ever born
for wives of professional managers and clerks and wives of government
officials were less than the average for all women in all age groups (Knodel and Prachuabmoh, 1973a). A similar result was obtained from the Survey of Fertility in Thailand (Thailand, 1977a).
3. Fertility Differential According to Labour Force Participation. As indicated by the 1960 census, Goldstein (1972) found that in Bangkok the
fertility level of economically active women (including unpaid family workers) was considerably below that of housewives. It was concluded that labour force participation operated quite differently on fertility differentials for both highly urban and highly rural environments.
The Longitudinal Survey found that in both rural and urban samples, women who worked for pay experienced lower cumulative fertility than women who did not work for pay. Women who worked for pay outside agricultural
19
sector. The effect of labour force participation on fertility was more pronounced among urban women than among their rural counterparts (Knodel and Prachuabmoh, 1973a).
For Rural Thai women, after controlling for age and marriage duration, non-farm workers had lower fertility than other women both in terms of cumulative (children ever born) and current fertility (Cook and Leoprapai, 1977).
4. Fertility Differential According to Education. The inverse association of fertility level and educational attainment was confirmed by several studies. The study of Goldstein (1972), using the 1960 census, found that the fertility level of illiterate Thai women was higher than that of literate persons in every urban and rural category, especially in Bangkok. The differentials tended to increase with age.
The Longitudinal Study found a strong inverse relationship between years of schooling and the number of children ever born among both rural and urban
women. In the rural sample, women who had received education beyond fourth grade had the lowest fertility. Women with 0-4 years of schooling had above average fertility. For the urban sample, the wider range of educational attainment could be investigated, women with ten or more years of education had fewest children and women with either no schooling or with only 1-3 years schooling had the most (Knodel and Prachuabmoh, 1973a). Fertility difference by husband's education showed a similar association to that illustrated by wife's education (Chamrathrithirong and Boonpratuang, 1977).
fertility than ethnicity (Goldstein, 1970; Knodel and Prachuabmoh, 1973a).
6. Fertility Differential According to Religion. Using the 1% sample of the 1960 census data to analyse the religious fertility differential in Thailand, Goldstein (1970) found that, although age and urban-rural status were controlled, the fertility of Moslems clearly remained below that of Buddhists and Confucians. The latter two closely resembled each other.
Considering urban-rural status with religion, for both Buddhist and Confucian women, higher fertility was associated with rural status, but Moslems living in Bangkok had the highest fertility.
The 1970 census data also showed that Moslems had the highest fertility in all municipal areas. Considering fertility differentials by religion for women with educational attainment, fertility declined sharply beyond primary education for all religions. Moslem fertility dropped markedly for those attaining university education.
The data from the Longitudinal Study permitted the analysis of fertility differentials among wives according to the religious observance and super stitious beliefs of their husbands. It was concluded that there was little evidence of rural fertility differentials according to religious observance and superstitious belief, although the assumption was made that those people who were attached to such beliefs were less interested in modern views
regarding family size and family control (Knodel and Prachuabmoh, 1973a).
1.2.5 Demographic Factors Influencing Fertility
As noted earlier, the evidence of fertility decline began in the mid 1960s. The decline might have been due to several factors such as changes in the age distribution of the population, changes in the nuptiality pattern, changes in knowledge, attitude and practice of family planning and also
21
Age Distribution of Female Population
A comparison of the age distribution of women of childbearing ages in 1960 and 1970 is given in the following Table.
TABLE 1.8
PERCENTAGE DISTRIBUTION OF WOMEN IN EACH CHILDBEARING AGE GROUP, 1960 and 1970
Age Group Percentage
1960
of Women 1970
15-19 20.2 24.3
20-24 19.8 17.5
25-29 17.2 14.8
30-34 14.2 13.9
35-39 11.2 12.4
40-44 9.2 9.9
45-49 8.0 7.7
Total 100.0 100.0
Source: ESCAP Country Monograph Series 3, Population of Thailand, U.N., 1976.
The proportion of female population in age group 25-29 which had the highest fertility dropped from 17.2 per cent in 1960 to 14.8 per cent in 1970. The changes in the age distribution of female population since 1960 certainly contributed to the fertility decline between 1960 and 1970.
Data from the Longitudinal Survey
The factors included were age and residence, marriage duration, nuptiality, breast feeding, infant mortality and contraceptive practice (Knodel and Prachuabmoh, 1973a, 1973b and 1975).
1. Fertility in Relation to Age. The measure of fertility in relation to age were age specific marital fertility rate, family size, pregnancy and sterility status and intervals following last birth or pregnancy loss.
1.1. Age Specific Marital Fertility Rate. The data on age specific marital fertility rate showed that in rural categories, marital fertility was highest among women aged 20-24 and generally declined with age until the end of the childbearing period. The provincial urban rate was 29 per cent below the rural rate and the rate for Bangkok-Thonburi was 39 per cent below. The relative differences in the rates were noticeably greater for the age groups 30-44 than for the younger age groups.
1.2. Comparing Family Size. The ever-married women in provincial urban areas averaged a number of children ever born 17 per cent below the number
for rural ever-married women, while women in Bangkok-Thonburi averaged 22 per cent below rural ever-married women. The difference in number of children ever born for ever-married women aged 40-44 and 45-49 among urban-rural
categories strongly suggested a greater use of contraception in the cities than in the countryside.
The study also found that infant mortality had the greatest impact on reducing family size in rural areas.
23
1.4. The Interval Following the Last Birth. Rural women had the shortest mean and median intervals at every age. It was found that mean and median intervals increased steadily with age in all areas.
2. Marriage Duration. Marriage duration was expected to affect fertility more than age. The finding was that there was a clear relationship between duration of marriage and fertility during the year prior to the survey.
Fertility was highest for marriage duration of two to four years and declined with duration thereafter. The fertility of both rural and urban women after
20 years of marriage was slightly higher than those married for 15-19 years. The difference in duration specific marital fertility rates for rural women and women in Bangkok-Thonburi increased with duration of marriage. The explanation for this was the more widespread use of contraceptives in the capital than in the countryside.
A comparison of the number of children a woman would have had if she experienced the current duration specific marital fertility rate and the number of children ever born, showed that the marital fertility in rural areas had been stable over the recent past. In contrast the fertility decline was operating in urban areas, particularly in the capital.
3. Nuptiality Patterns. Nuptiality patterns can affect fertility thorugh age at first marriage and marital status. It was found that there was a strong inverse association between age at first marriage and cumulative
fertility in all samples and in all categories of age. The association was more pronounced among urban ever-married women than rural women. The
differences in age at first marriage for women in all rural-urban categories were not large enough to account for the differences in rural-urban fertility. When age was controlled, currently married women were found to have the
4. Infant Mortality. Infant mortality also had a clear association with fertility. In rural areas, infant mortality was twice as high for women with nine or more live births as for those with only one or two. The association was more conspicuous for urban women.
5. Contraceptive Practice. Contraceptive practice is the most important factor to help explain fertility decline in Thailand. There is evidence that the increase in proportions practising family planning contributed to the decline in fertility and a substantial part of the fertility decline could be attributed to the increased use of family planning methods (Knodel and Pitaktepsombati, 1975).
From the Longitudinal Study the current fertility of women practising contraception was substantially lower than that of women not practising. The cumulative fertility of women currently practising contraception was higher than that of non-practising women. This might be explained by the so-called self-reflection process that the more fecund women practised
contraceptive control at higher rate than less fecund women (Knodel and Pitaktepsombati, 1975). Generally, rural women had higher fertility than urban women in comparable age and contraceptive usage categories. Family planning in Thailand was practised in the later period of childbearing ages after women had completed the number of children they wanted to have (Knodel and Prachuabmoh, 1973a; Thailand, 1977a).
1.2.6. Gaps in the Knowledge in Fertility in Thailand.
There has been a lot of evidence of fertility decline in Thailand as reviewed in the preceding sections. The crude birth rate and total
25
area.
Fertility decline has been mainly explained by the widespread use of contraceptive practice. Although it is evident that the age structure of women in childbearing ages declined (United Nations, 1976), age at marriage
increased slightly (Chamrathrithirong, 1978) and other demographic and socio economic factors changed in favour of fertility decline (Knodel and Prachuabmoh, 1973aand Thailand, 1977a), the family planning programme contributed most to the recent fertility decline (Knodel and Pitaktepsombati, 1975).
Very few fertility analyses have emphasized variations in the levels and age patterns of fertility among regions in Thailand. Regional
differences in fertility have been analysed from the 1970 census using the data on children ever born and own children by age of mother as indicators for fertility levels and patterns. However not much investigation has been carried out on the demographic and socio-economic characteristics which accounted for differences in fertility for the four regions of Thailand.
The present study on regional variation in the age pattern of fertility using age specific fertility rate will be supplementary to the previous analyses. Furthermore, the fertility analysis based on birth registration data is of prime interest. Despite the incompleteness of registration data due to under registration, it is believed to be a valuable source of
fertility analysis.
This thesis will try to supplement the above gap in the fertility knowledge by using the 1960 and 1970 censuses and birth registration data
1.3 THE ORGANIZATION OF THE STUDY
The general review of fertility levels and patterns of Thailand and by region is given in the present chapter. Chapter II will be an analysis of fertility levels and patterns of Thailand and by region based on census data for the period 1960-1970. Chapter III will be the analysis of
CHAPTER 2 27
FERTILITY BASED ON CENSUS DATA
This Chapter will focus on changes in fertility based on number of children ever born by age of women from the 1960 and 1970 censuses for Thailand and the four regions. Fertility rates derived from the number of children ever born for the intercensal period will also be examined.
2.1 THE 1960 AND 1970 CENSUS DATA
In the 1960 census, a table on number of ever-married women 15 years of age and over by number of children ever born alive was available for each changwad (province) (Thailand, 1962).
From these distributions, average parity of women in each five year age group 15-19 to 45-49 was obtained for the four regions for the present study. The average parity by age group of women was then adjusted to account for the age reporting bias (see below) in order to compare the parity
distribution in 1960 with that in 1970.
The 1970 parity distributions were derived directly from the tabulation on average number of children ever born alive per 1000 women from the 1970 census (Thailand, 1973). The 1970 census data needed no adjustment because the number of children ever born was not affected very much by the under-emmeration (Hill, 1980). The age reporting for the 1970 census has been
regarded as highly accurate (Fulton, 1979).
2.1.1. Adjustment of the 1960 Census Data
To make the number of children ever born data from the 1960 and 1970 censuses comparable, the 1960 census data had to be adjusted to allow for age discrepancies of women.
et al., 1978).
The study of Chamrathrithirong et al., (1978) examined the single year age data from the 1960 and 1970 censuses and found that age reported in
the 1960 census was rounded up by one year. They also presented the evidence from the Longitudinal Survey that 63 per cent of rural ever-married women rounded ages to their next birthday. The tendency to report age at next birthday considerably affected the number of children ever born particularly at the young ages of females (Chamratrithirong et al., 1978).
However, there was also some evidence that respondents tended to round their age to that at the nearest birthday. That is, at the census time, if they just passed their last birthday, they would give age at last birthday or if they were nearer to the next birthday, they would give age at next birthday. This resulted in half-a-year older age on average than if age had been computed from birth dates (Chamratrithirong et al., 1978).
The following formulae were applied to the number of children ever born per woman by five-year age group from the 1960 census in order to adjust for age half a year and one year younger than reported for the whole country and at regional levels:
(1) S' = S - — (S - S ■ ) for half year adjustment x x l 0 x x + 5
(2) S' — S — ~ (S — S ,_) for full year adjustment x x 5 x x + 5
where: S' = adjusted average number of children ever born at age group x to x + 4
S = average number of children ever born at age group x to x + 4
S + = average number of children ever born in the next 5-year age group
29
or by one-fifth (one year of the five year interval) of the difference between average children ever born at that age group and the next (Chamratrithirong et al., 1978).
Table 2.1 shows the unadjusted and adjusted average number of children ever born per woman aged 15-49 according to half year and full year adjust ment for age for 1960 and the data from the 1970 census.
TABLE 2.1
AVERAGE NUMBER OF CHILDREN EVER BORN PER WOMAN AGED 15-49 BETWEEN 1960 AND 1970
Area
CEB per Woman Aged 1960
15-491
1970 Unadjusted Half-year2
Adjusted
„ 2
One-year Adjusted
Whole Kingdom Regions
-2.66 2.74 2.84 2.76
North 2.71 2.80 2.89 2.81
Northeast 2.88 2.98 3.08 3.07
Central 2.43 2.38 2.59 2.44
South 2.48 2.57 2.65 2.71
(1) Age standardized using female population of the whole from the 1970 census as standard.
(2) Adjusted for half-a-year and one-full-year of age.
kingdom
[image:39.557.28.539.31.606.2]From Table 2.1 the unadjusted and half-year adjusted average number of children ever born in 1960 were lower than the 1970 data for all areas. This resulted from the tendency of respondents to report age at next
birthday in the 1960 census as mentioned previously.
Therefore, the following analysis on fertility will be based on the one-year adjusted data not only because they show fertility decline but also because fertility rates for the intercensal period 1960-1970 based on these data correspond well with the fertility rates from the Survey of Population Change for 1964-1965.
2.2. FERTILITY AS MEASURED BY AVERAGE PARITY FROM THE 1960 AND 1970 CENSUSES 2.2.1 Fertility for the Whole Country
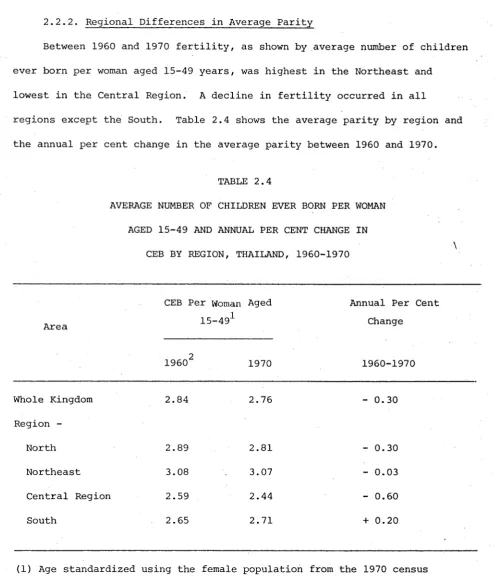
The average number of children ever born in 1960 and 1970 reflected high fertility levels for Thai women in the past. However, it also showed a decline in fertility.
Table 2.2 shows the number of children ever born per woman by age group for 1960 and 1970 and the percentage of average annual change in number of children ever born.
From Table 2.2, the average cumulative fertility of Thai women in the reproductive span (15-49 years) in 1970 was about 2.8 per cent lower than it was in 1960. By 1960 Thai women aged 15-49 years had 2.84 children. The number of children declined to 2.76 in 1970. The cumulative fertility
decreased by an average 0.3 per cent per annum between 1960 and 1970, which showed a slower decline in fertility compared with the decline shown by current fertility from the mid-1960s to the early 1970s (Table 2.3).
For most age groups, cumulative fertility was lower than it was ten
[image:40.557.53.541.44.754.2]TABLE 2.2 31
NUMBER OF CHILDREN EVER BORN PER WOMAN BY AGE
AND THE ANNUAL PER CENT CHANGE IN THE NUMBER OF CHILDREN EVER BORN, THAILAND, 1960 AND 1970
Age I9601
CEB
1970
ANNUAL (PER CENT) CHANGE 1960-1970
15-19 0.23 0.13 - 6.0
20-24 1.15 0.99 - 1.5
25-29 2.59 2.41 - 0.7
30-34 4.02 3.82 - 0.5
35-39 5.13 5.08 - 0.1
40-44 5.74 5.92 + 0.3
45-49 5.91 6.12 + 0.4
15-492 2.84 2.76 - 0.3
(1) Adjusted for age to one year younger than reported. (2) Age standardized using
from the 1970 census as
female population of the whole kingdom standard.
Females aged 25-29 in 1970, who were aged 15-19 in 1960, also had fewer children ever born to them compared with women of the same age in 1960. The annual percentage change in number of children ever born was only 0.7 for women aged 25-29 years (See Table 2.2).
ANNUAL PER CENT CHANGE IN FERTILITY AS MEASURED BY TFR FROM DIFFERENT SOURCES
Source Period TFR Annual Per
Cent Change
P/F registered birth 1960 6.54 - 0.7
SPC 1964-65 6.30
P/F registered birth 1960 6.54 - 0.6
Own children 1965-69 6.19
Own children 1960-64 6.48 - 0.5
1965-69 6.19
Adjusted registered birth 1960-69 6.44 - 1.6
1970-74 5.13
Cohort parity 1960-70 6.17 - 1.4
1970-75 5.04
SPC 1964-65 6.30 - 2.3
1974-75 4.90
Source; From Table 1.2 in Chapter 1.
40-44 and 45-49 ten years later their cumulative fertility in 1970 exceeded 5 and 6 children. At the same time, women in the younger generation were more likely to adapt some degree of modernization. Therefore, their fertility was lower in 1970 than fertility of women at the same age ten years before.
Some studies concluded that Thailand's fertility transition on a national level was just beginning by the end of the 1960s (Debavalya and Knodel, 1978). However, fertility as shown by average number of children ever born indicates that fertility started to decline slowly between 1960 and 1970 and other