Pain Catastrophising Affects Cortical
Responses to Viewing Pain in Others
Nicholas Fallon*, Xiaoyun Li☯, Andrej Stancak☯
Department of Psychological Sciences, Institute of Psychology, Health and Society, University of Liverpool, Liverpool, United Kingdom
☯These authors contributed equally to this work. *nickfal@liverpool.ac.uk
Abstract
Pain catastrophising is an exaggerated cognitive attitude implemented during pain or when thinking about pain. Catastrophising was previously associated with increased pain sever-ity, emotional distress and disability in chronic pain patients, and is also a contributing factor in the development of neuropathic pain. To investigate the neural basis of how pain cata-strophising affects pain observed in others, we acquired EEG data in groups of participants with high (High-Cat) or low (Low-Cat) pain catastrophising scores during viewing of pain scenes and graphically matched pictures not depicting imminent pain. The High-Cat group attributed greater pain to both pain and non-pain pictures. Source dipole analysis of event-related potentials during picture viewing revealed activations in the left (PHGL) and right (PHGR) paraphippocampal gyri, rostral anterior (rACC) and posterior cingulate (PCC) corti-ces. The late source activity (600–1100 ms) in PHGL and PCC was augmented in High-Cat, relative to Low-Cat, participants. Conversely, greater source activity was observed in the Low-Cat group during the mid-latency window (280–450 ms) in the rACC and PCC. Low-Cat subjects demonstrated a significantly stronger correlation between source activity in PCC and pain and arousal ratings in the long latency window, relative to high pain catastro-phisers. Results suggest augmented activation of limbic cortex and higher order pain pro-cessing cortical regions during the late propro-cessing period in high pain catastrophisers viewing both types of pictures. This pattern of cortical activations is consistent with the dis-torted and magnified cognitive appraisal of pain threats in high pain catastrophisers. In con-trast, high pain catastrophising individuals exhibit a diminished response during the mid-latency period when attentional and top-down resources are ascribed to observed pain.
Introduction
Pain catastrophising has been defined as an exaggerated negative mental set brought to bear during the actual or anticipated pain experience [1,2] (reviewed in Quartana et al. [3]). In healthy people, high levels of pain catastrophising contribute to perceived pain intensity during experimental pain [1,4,5]. Pain catastrophising is also associated with increased pain severity,
OPEN ACCESS
Citation:Fallon N, Li X, Stancak A (2015) Pain Catastrophising Affects Cortical Responses to Viewing Pain in Others. PLoS ONE 10(7): e0133504. doi:10.1371/journal.pone.0133504
Editor:Maurice Ptito, University of Montreal, CANADA
Received:January 27, 2015
Accepted:June 29, 2015
Published:July 17, 2015
Copyright:© 2015 Fallon et al. This is an open access article distributed under the terms of the Creative Commons Attribution License, which permits unrestricted use, distribution, and reproduction in any medium, provided the original author and source are credited.
pain behaviour, emotional distress and disability in patients with chronic pain such as osteoar-thritis [6,7], rheumatoid arthritis [8], spinal cord injury [9], fibromyalgia [10], low back pain [11,12], and musculoskeletal injury [13,14]. High pain catastrophising predicts stronger post-operative pain [15] and greater consumption of analgesics [16]. Thus, pain catastrophising contributes to both the perception of pain and to the clinical outcomes of pain [17].
The communal coping model [2,9,18,19] has been suggested as an explanatory framework for pain catastrophising. According to this model, people with higher levels of pain catastro-phising communicate their pain to others to solicit social support in an attempt to mitigate their pain and pain-related emotional distress [17,20]. In support of the communal coping model, high pain catastrophisers attribute stronger pain to people exposed to a cold pressor test [21,22], and display more facial communicative pain behaviours in the presence of an observer [23]. Furthermore, high pain catastrophisers also benefit from reductions to pain intensity by disclosure of pain-related emotions [24].The attentional bias model describes pain catastrophising in terms of underlying mechanisms, as opposed to outcomes, and proposes that pain catastrophising results from an exaggerated attention to sensory and affective envi-ronmental pain cues [25]. These models are not mutually exclusive and may actually comple-ment one another, e.g. attentional bias relates to immediate cognitive processes engaged when responding to pain-related stimuli which could necessitate social coping strategies. The present study utilises EEG to examine alterations to cortical activations which could underlie atten-tional bias for pain cues in high pain catastrophisers.
The neural basis of the attribution of greater pain observed in others by high pain catastro-phisers is poorly understood. Functional magnetic resonance imaging (fMRI) during noxious stimulation of fibromyalgia syndrome patients revealed that patients with high pain catastro-phising scores showed increased activation in the anterior cingulate cortex during pressure stimulation [26]. In healthy people, a more widespread network of regions, including parahip-pocampal gyrus and posterior cingulate cortex, has been shown to display greater activation during mildly painful galvanic stimulation in high–relative to low–pain catastrophisers [27]. Recently, Vase et al. [28] reported associations between pain catastrophising scores and the amplitude of mid-latency somatosensory evoked potential components originating in the sec-ondary somatosensory cortex. Lin and colleagues [29] found a positive correlation between pain catastrophising scores and hippocampus activation during electrical stimulation of tooth pulp.
The present study expands on the previous literature by analysing the cortical activation processes underlying viewing pain in others in groups of high and low pain catastrophisers. Passive viewing of pictures depicting imminent or highly probable pain and graphically matched pictures with no imminent or probable pain were analysed using event-related poten-tial (ERP) and source dipole analysis to evaluate spatio-temporal differences in cortical activa-tion patterns. ERPs have been shown to differentiate pictures depicting scenes with a high risk of pain from those involving a comparatively low risk of pain [30–33]. Further, specific ERP components may be particularly relevant for pain catastrophising. The late positive potential (LPP) was previously associated with late cognitive evaluation of painful stimuli [34–36], and LPP was also proposed as a potential marker for affective regulation during aversive stimuli [37,38]. The advantages of a source analysis approach can evaluate differences in cortical acti-vations in high and low pain catastrophisers in specific regions associated with viewing pain. Previously, these types of pictures have been shown to activate relevant brain regions including bilateral insula and anterior cingulate cortex and precuneus using fMRI [39–46].
In the present ERP study, we hypothesised that high−compared to low−pain catastrophi-sers would attribute stronger pain to pain scenes and manifest increased amplitudes in source activations during ERP components thought to be associated with emotional regulation or
uk. Pending this approval we will send the data to interested researchers.
Funding:The authors received no specific funding for this work.
cognitive evaluation of stimuli, such as the late positive potential. By utilising source analysis we anticipate that high pain catastrophisers will demonstrate stronger activations in relevant cortical regions mediating emotional processing of observed pain.
Materials and Methods
Participants
Ninety-nine adult female students (aged 18−30 years) from the University of Liverpool were initially screened using the Pain Catastrophizing Scale (PCS, [1]) approximately 2 weeks prior to the experiment. All students were informed that this questionnaire concerned their thoughts and feelings when they were experiencing pain. Students were excluded if they reported a med-ical condition associated with pain, any neurologmed-ical or psychiatric disease, or had abnormal visual ability. The average PCS score for all 99 respondents was 19.1 ± 9.8 (mean ± SD), sub-jects with PCS scores greater than 24 or lower than 15 were classified as high (High-Cat) and low (Low-Cat) pain catastrophisers respectively. These cut-off points represented the 66.7% and the 33.3% percentiles of all respondents. Thirty females (15 High-Cat vs. 15 Low-Cat) aged 20.3 ± 2.7 years (mean ± SD, High-Cat: 19.4 ± 1.1, Low-Cat: 21.1 ± 3.5) participated in the EEG experiment for course credits. All participants gave their informed written consent according with the Declaration of Helsinki and no minors or children were included. The study and ethics procedure was approved by the Research Ethics Committee of the University of Liverpool. All but three subjects had right-hand dominance according to self-report.
Procedure
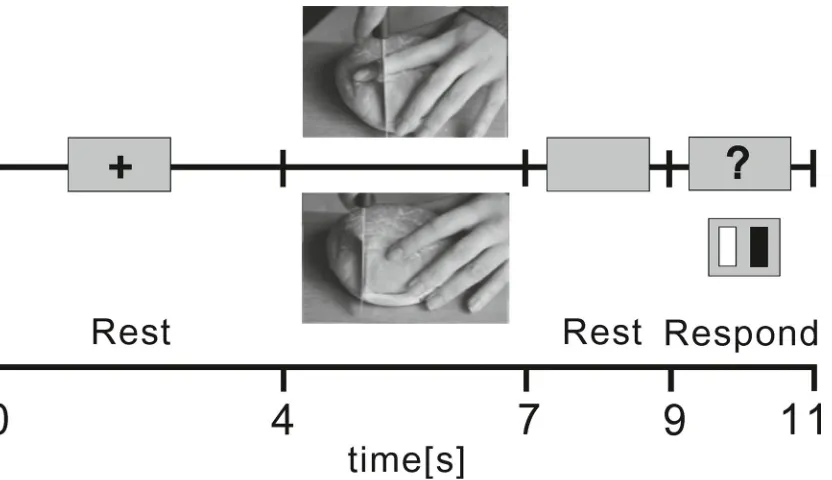
Subjects sat in a sound and light attenuated room and viewed a 19 inch LCD computer screen placed 0.7 m in front of them whilst holding a response keypad in both hands. The experiment was organised into 4 blocks each lasting 7.3 min. Each trial (Fig 1) began with a 4 s resting interval during which subjects viewed a black fixation cross on a grey background. A colour photographic image sized 425 × 319 pixels was presented on a grey background for 3 s followed by a resting interval of 2 s before a 2 s response epoch. During the response epoch, a black ques-tion mark was displayed prompting the participant to press one of two buttons to attribute whether the picture implied pain or not. The lateralisation of the button associated with pain was balanced across subjects. For synchronisation of data, the onset of pictures in the stimulus program simultaneously sent a trigger via a parallel-BNC cable interface which was recognised by EEG processing software.
The IRI measures four scales of empathic behaviour such as empathic concern and perspective taking.
EEG recordings
EEG data was recorded continuously using a 128-channel Geodesics EGI System (Electrical Geodesics, Inc., Eugene, Oregon, USA) with a sponge-based Geodesic Sensor Net. The sensor net was aligned with respect to three anatomical landmarks including two pre-auricular points and the nasion. The electrode-to-skin impedances were kept below 50 kΩand at equal levels across electrodes. The recording bandpass filter was 0.1−100 Hz and the sampling rate was 250 Hz. These recording parameters were suitable for quantification of the mid-long latency ERP components which were of specific interest for the present study.
Data pre-processing
[image:4.612.42.458.75.315.2]EEG data was processed using BESA (Brain Electric Source Analysis) v. 6.0 software (MEGIS GmbH, Munich, Germany). Data were spatially transformed into reference-free data using common average reference method [49]. Oculographic and, when necessary, electrocar-diographic artifacts were removed using principal component analysis [50]. Data was visually inspected for the presence of any movement or muscle artifacts, and epochs contaminated with artifacts were excluded. Event related potentials were computed separately for high and low pain catastrophisers responses to pain and non-pain trials by averaging the respective epochs in the interval ranging from 200 ms before stimulus onset to 1400 ms after stimulus onset. The baseline period ranged from -200 ms to 0 ms relative to the onset of the visual stimulus. ERP signals were bandpass-filtered from 0.5 to 40 Hz and event-related potentials from four blocks were averaged for each condition. The mean number of epochs used was 58.4 ± 10.7 for pain scenes and 59.1 ± 11.2 for non-pain scenes.
Fig 1. Flowchart of the experiment.The figure illustrates one trial of the experiment, beginning with a rest period (4 s) and continuing with a visual presentation of a pain or non-pain picture for 3 s, followed by another rest period of 2 s, and a response period of 2 s during which subjects pressed left or right button on a response pad to indicate whether the photograph depicted a pain or non-pain scene.
Source dipole analysis
To evaluate differences in event-related potentials between High-cat and Low-Cat groups or picture types, and to localise the cortical regions potentially showing significant differences related to pain catastrophising, source localisations were first estimated using CLARA method (Classical LORETA Analysis Recursively Applied, [51]), as implemented in BESA v. 6.0. CLARA is a novel iterative source analysis method which operates by performing a weighted LORETA (Low Resolution Electromagnetic Tomography Analysis, [52]) on each iteration, followed by source space reduction. Compared to the standard LORETA method, CLARA reduces the blurring of the estimated sources while maintaining the advantages of a predefined distributed source model, thus making it easier to obtain a relatively focal distribution of source activation [53–55]. It combines the advantages of discrete and distributed source analysis by employing distributed source analysis with a shrinking of the source space. The default mini-mum regularisation cut-off parameter was used and the source image was expressed as current density within a standard MRI image (nAm/cm3). The ellipsoid head model was used, and the conductivities were set as follows: skin = 0.33 S/m, skull = 0.0042 S/m, cerebrospinal fluid = 1.0 S/m, and brain parenchyma = 0.33 S/m.
The source dipole model was built by applying CLARA to grand average EEG waveforms comprising all subjects and both conditions. We employed the iterative application of the LOR-ETA algorithm to explain the potential changes occurring in the time epoch of -200 ms to 1400 ms. Four clusters were identified which exhibited activity during this interval. An equivalent source dipole was placed in the spatial maximum of each CLARA cluster and the orientation was fitted at the fixed dipole location. This four dipole solution accounted for 96% of variance in ERP data, and proved to be stable across conditions and subjects. Source locations were transformed to approximate Talairach coordinates using BESA v. 6.0.
To evaluate the effects of pain catastrophising on ERPs statistically, the grand average source dipole model was used to compute individual source waveforms during viewing of pain and non-pain pictures in High-Cat and Low-Cat groups. The source waveforms were exported by fixating the source dipole locations and refitting the orientations of all four dipoles in each sub-ject and condition, similar to previous studies [56–59].
Data was exported to MATLAB v.7.13 (The MathWorks, Inc., USA) to analyse the average source waveforms in each of four source dipoles for pain and non-pain pictures in High-Cat and Low-Cat groups. For each source, a mixed two-way ANOVA (group × picture type) was performed across all time points to identify periods showing significant main effects or interac-tions. This method has the advantage of exploring the entire epoch for potential differences between conditions or groups in each source waveform, whilst controlling for the risk of type-1 error [60,61]. A 95% confidence level was employed and permutation analysis technique [62] with 2000 permutations was utilised to correct for the performance of multiple tests. Results where thresholded to only include those which covered a time window of at least 30 ms. Mean source activations were extracted from time-periods of interest for each participant in both conditions for each source for further statistical analysis using a mixed two-way ANOVA in SPSS v.20 (SPSS Inc, Chicago, USA).
Picture ratings
one error, Bonferrorni-Šidák’s adjustments of P values was applied. Correlation coefficients were compared between groups using Fisher’s transformation. Statistical analyses were per-formed using SPSS 20.0 statistical analysis package.
[image:6.612.34.581.541.656.2]Results
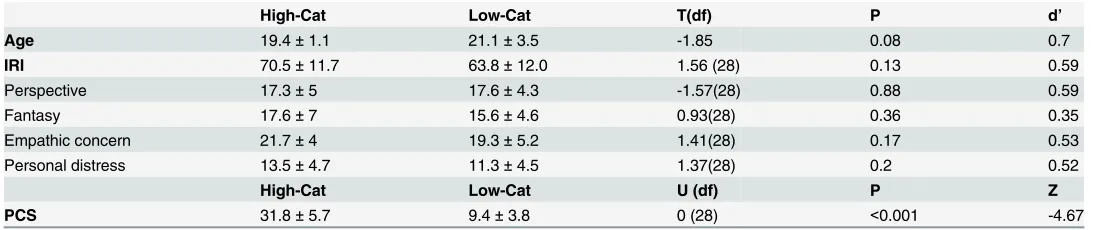
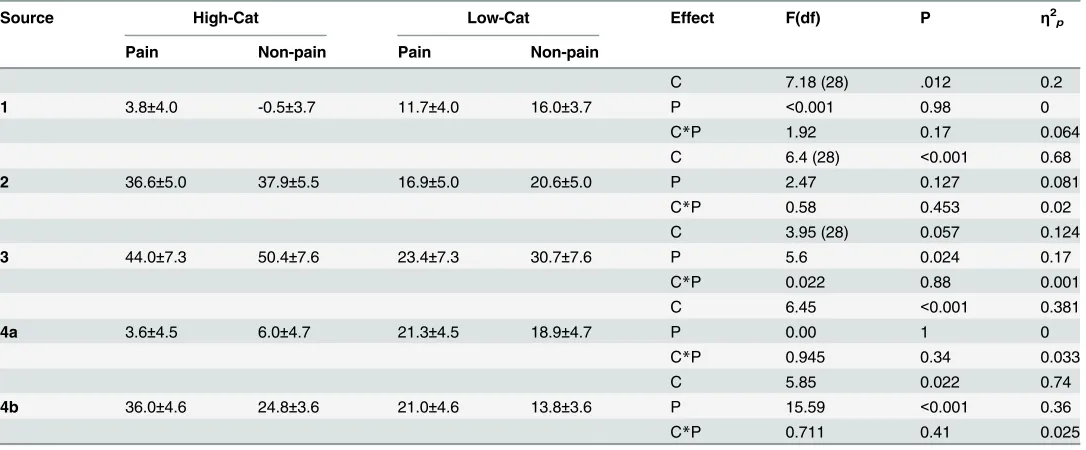
Table 1shows mean PCS and IRI scores (including subscales) and output of statistical compar-isons. Pain catastrophising scores were comparable to those reported in previous studies involving grouping of subjects into high and low pain catastrophising groups based on PCS scores [1,5,14,23,24,63]. High-Cat and Low-Cat groups did not differ significantly in mean IRI scores or on any of the four IRI subscales.
Picture ratings
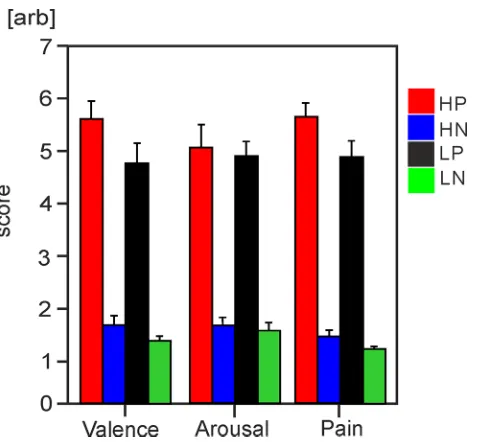
Table 2andFig 2show the mean self-report values for affective valence, arousal and pain for both types of pictures in High-Cat and Low-Cat groups. For valence ratings, a two-way ANOVA for repeated measures revealed a statistically significant main effect of pain catastro-phising (F(1,28) = 4.8,P= 0.038) with greater unpleasantness attributed to both pain and non-pain pictures by High-Cat, compared to Low-Cat, group. The main effect of picture type was also significant (F(1,28) = 196.6,P<0.0001), with greater unpleasantness attributed to viewing of pain, compared to non-pain, pictures by both groups. The interaction between group and picture type was not statistically significant (F(1,28) = 0.7,P>0.05). Arousal ratings associated with viewing pictures were stronger for pain, than non-pain, scenes (F(1,28) = 206.5,P<0.001), but similar in High-Cat and Low-Cat groups (P>0.05) and the interaction effect was again not statistically significant. Participants attributed stronger pain to pain pic-tures compared to non-pain scenes (F(1,28) = 378.6,P<0.001). High-Cat group rated both the pain and non-pain scenes as containing greater pain relative to the Low-Cat group (F(1,28) = 4.9,P= 0.036), and the interaction of group and picture type was not statistically significant.
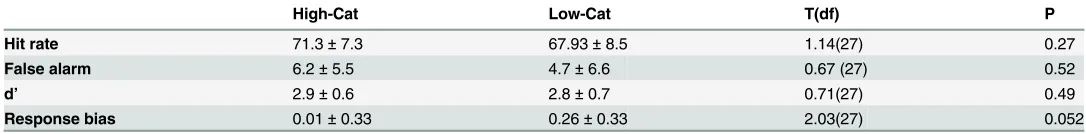
To evaluate the degree of discrimination between pain and non-pain pictures in High-Cat and Low-Cat groups, the sensitivity index (d’) and response bias were computed. These mea-sures are derived from signal detection theory [64], and allow for evaluation of whether pain and non-pain visual scenes were discriminated correctly and equally in both catastrophising groups.Table 3shows the output from signal detection analysis. One Low-Cat subject was excluded from signal detection analysis due to a missing output file. There were no statistically significant differences in hit rate, false alarm rate, sensitivity index or response bias between
Table 1. Participant Age, Pain Catastrophizing Scale and Interpersonal Reactivity Scale scores.
High-Cat Low-Cat T(df) P d’
Age 19.4±1.1 21.1±3.5 -1.85 0.08 0.7
IRI 70.5±11.7 63.8±12.0 1.56 (28) 0.13 0.59
Perspective 17.3±5 17.6±4.3 -1.57(28) 0.88 0.59
Fantasy 17.6±7 15.6±4.6 0.93(28) 0.36 0.35
Empathic concern 21.7±4 19.3±5.2 1.41(28) 0.17 0.53
Personal distress 13.5±4.7 11.3±4.5 1.37(28) 0.2 0.52
High-Cat Low-Cat U (df) P Z
PCS 31.8±5.7 9.4±3.8 0 (28) <0.001 -4.67
Age, Pain Catastrophizing Scale (PCS) and Interpersonal Reactivity (IRI) Scale scores (mean±SD) are shown for high and low pain catastrophising groups. T values (with degrees of freedom), P values and effect sizes (Cohen’s d’) for statistical comparisons are also shown. For pain catastrophising, the output of the Mann-Whitney U test is shown.
the two groups although response bias approached significance. Thus, High-Cat and Low-Cat groups performed similarly in discrimination of pain and non-pain scenes.
Source dipole model
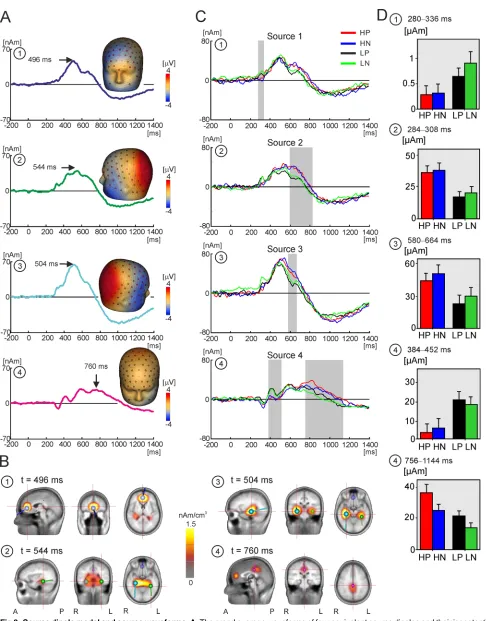
Fig 3Ashows the source dipole waveforms and isopotential scalp maps of the four source dipoles across subjects and conditions.Fig 3Bshows the cluster maxima and CLARA maps for each of four source dipoles. Source dipoles are numbered from 1 to 4 inFig 3A and 3B.
[image:7.612.34.578.88.237.2]Source 1 showed a maximum at 496 ms following the onset of visual stimuli. The isopoten-tial lines, mapped at the peak of 496 ms inFig 3A, suggested a positive maximum at the lower
Table 2. Valence, arousal and pain ratings attributed to pictures.
High-Cat Low-Cat Effect F(df) P η2p
Pain Non-pain Pain Non-pain
C 4.8 0.038 0.145
Valence 5.6±1.3 1.6±0.7 4.7±1.5 1.2±0.3 P 196.6 <0.001 0.880
C*P 0.7 0.41 0.025
C 0.28 0.604 0.010
Arousal 5.0±1.5 1.5±0.6 4.8±1.1 1.4±0.6 P 206.5 <0.001 0.881
C*P 0.03 0.868 0.010
C 4.9 0.036 0.148
Pain 5.7±1.1 1.3±0.5 4.9±1.2 1.1±0.1 P 378.6 <0.001 0.931
C*P 1.83 0.187 0.061
Average ratings (mean±SD) for valence arousal and pain attributed to pain and non-pain pictures in high, and low, pain catastrophising groups. F values (with degrees of freedom), P values and effect sizes (η2p) for ANOVA comparisons are also shown. C = main effect of catastrophising, P = main effect of picture type, C*I = interaction effect.
[image:7.612.201.444.446.667.2]doi:10.1371/journal.pone.0133504.t002
Fig 2. Self-report picture ratings.Bar charts with standard error bars illustrate mean values for ratings of affective valence, arousal and pain in High-Cat and Low-Cat groups for both types of pictures. HP = High-Cat pain pictures, HN = High-Cat non-pain, LP = Low-Cat pain pictures, LN = Low-Cat non-pain.
forehead and a negative maximum in the medial frontal region. CLARA indicated the presence of a source in the rostral anterior cingulate cortex (rACC; Brodmann area 24/32; approximate Talairach coordinates: x = 2 mm, y = 43 mm, z = 2 mm,Fig 3B). Source dipole 2 peaked at 544 ms, and accounted for the negative potential maximum seen over the left lower face and a posi-tive potential maximum in the left posterior parietal region. This source was fitted in the left medial temporal cortex in the parahippocampal gyrus (PHGL; Brodmann area 36; approximate
Talairach coordinates: x = -34 mm, y = -37 mm, z = -13 mm). Source 3 peaked at 504 ms, and accounted for a maximal negativity in the lower right face and a positive potential maximum in the right posterior parietal region suggesting a dipole operating in the right medial temporal cortex. Source 3 was denoted as the right parahippocampal gyrus (PHGR; Brodmann area 35;
approximate Talairach coordinates: x = 30 mm, y = -26 mm, z = -13 mm). Finally, source dipole 4 explained the positive potential maximum at the vertex between 580 ms and 760 ms. This source showed a negativity around the chin and the neck, and the isopotential lines pointed to the presence of a dipole located deep in the medial parietal cortex. The approximate Talairach coordinates of source 4 (x = 0 mm, y = -27 mm, z = 34 mm) were consistent with a source dipole located in the posterior cingulate cortex (PCC; Brodmann area 23/31).
Effects of pain catastrophising on source dipole waveforms
Fig 3Cshows the average source waveforms in each of the four source dipoles for pain and non-pain pictures in High-Cat and Low-Cat groups. Intervals manifesting statistically significant effects of catastrophising group, picture type or interaction effects, resolved using permutation analysis across all time points, are indicated by grey rectangles.Table 4gives the intervals used in the statistical analysis, and the mean and standard error of source dipole components for pain and non-pain pictures in each group of subjects.Fig 3Dshows the mean source activations in each group and picture condition for time windows identified by permu-tation analysis
In source 1, located in the rACC, source activity was stronger in Low-Cat, relative to High-Cat, group for both types of pictures in the time epoch 280–336 ms after stimulus onset (Fig 3CandTable 4). Between 596–828 ms, Source 2, located in PHGL, demonstrated a statistically
significant main effect of group. The effect was due to stronger source activity in the High-Cat, compared to Low-Cat, participants. In the time interval 580–664 ms, amplitude of source 3, located in PHGR, was stronger during viewing of non-pain than pain pictures.
[image:8.612.34.577.90.157.2]In source 4, fitted in the PCC, a statistically significant effect of pain catastrophising was shown in the latency epoch of 384 ms to 452 ms, hereafter referred to as source 4a, which was caused by a larger source amplitude in Low-Cat than High-Cat group. In contrast, source acti-vation in the late interval (756–1144 ms, hereafter referred to as source 4b the long latency (756 ms) was stronger in the High-Cat, relative to Low-Cat, group. The main effect of picture
Table 3. Signal detection analysis.
High-Cat Low-Cat T(df) P
Hit rate 71.3±7.3 67.93±8.5 1.14(27) 0.27
False alarm 6.2±5.5 4.7±6.6 0.67 (27) 0.52
d’ 2.9±0.6 2.8±0.7 0.71(27) 0.49
Response bias 0.01±0.33 0.26±0.33 2.03(27) 0.052
Output from signal detection analysis including average scores (mean±SD) for hit rate, false alarms, sensitivity index (d’) and response bias. T values and P values from statistical comparisons of each group are also shown.
type was also significant in this time interval with pain pictures eliciting stronger source activity relative to non-pain pictures.
Correlations between source components and picture ratings
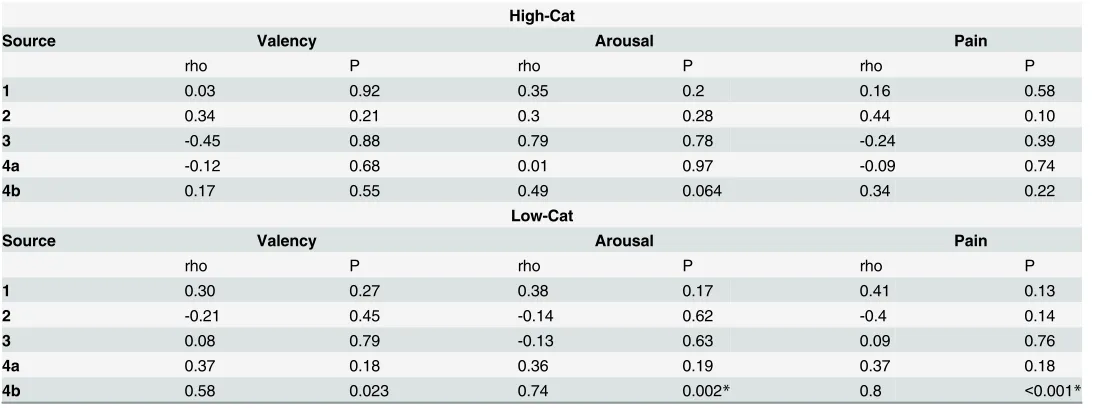
Spearman’s correlation coefficients were calculated between the source activation differences [pain–non-pain pictures] in sources and intervals manifesting statistically significant effects of group (Table 4) and the [pain–non-pain] differences in subjective ratings of valence, arousal and pain.Table 5shows Spearman’s Rho correlation coefficients and statistical values for
bivariate correlations between each source activation and subjective ratings of valence, arousal and pain. We found two statistically significant correlation coefficients surpassing
Bonferroni-Šidák corrected P values between the amplitude of the long latency (756–1144 ms) PCC source (source 4b) and arousal and pain ratings in the Low-Cat group only.Fig 4illustrates the scatter plots and linear regression lines for the valence, arousal and pain rating scales and the source amplitude differences of the late PCC activation in High-Cat and Low-Cat groups. Results sug-gest that the activation of the PCC during the late latency epoch in the Low-Cat group demon-strates a significantly stronger relationship with subjective arousal and observed pain elicited
from 1 to 4.B.CLARA source activation maps and source dipole locations of four cortical sources. The peak latency of each source corresponds to that in panel A. A = anterior, P = posterior, L = left, R = right. The numbering of dipoles corresponds to that in A. 1 = blue dipole, 2 = green dipole, 3 = ice blue dipole, 4 = magenta dipole.C.The grand average waveforms of four equivalent source dipoles, numbered from 1 to 4, in high and low pain catastrophising groups during viewing pain and non-pain scenes. Red line = pain photographs in High-Cat group, blue line = non-pain photographs in High-Cat group, black line = pain photographs in Low-Cat group, green line = non-pain photographs in Low-Cat group. The grey-filled rectangles indicate epochs used in statistical analyses.D. Bar chart of mean source activations and standard error bars for each condition during time windows of interest identified by permutation analysis (grey rectangles).
[image:10.612.36.579.417.642.2]doi:10.1371/journal.pone.0133504.g003
Table 4. Effects of pain catastrophising on source dipole waveforms.
Source High-Cat Low-Cat Effect F(df) P η2
p
Pain Non-pain Pain Non-pain
C 7.18 (28) .012 0.2
1 3.8±4.0 -0.5±3.7 11.7±4.0 16.0±3.7 P <0.001 0.98 0
C*P 1.92 0.17 0.064
C 6.4 (28) <0.001 0.68
2 36.6±5.0 37.9±5.5 16.9±5.0 20.6±5.0 P 2.47 0.127 0.081
C*P 0.58 0.453 0.02
C 3.95 (28) 0.057 0.124
3 44.0±7.3 50.4±7.6 23.4±7.3 30.7±7.6 P 5.6 0.024 0.17
C*P 0.022 0.88 0.001
C 6.45 <0.001 0.381
4a 3.6±4.5 6.0±4.7 21.3±4.5 18.9±4.7 P 0.00 1 0
C*P 0.945 0.34 0.033
C 5.85 0.022 0.74
4b 36.0±4.6 24.8±3.6 21.0±4.6 13.8±3.6 P 15.59 <0.001 0.36
C*P 0.711 0.41 0.025
Source dipole moments (mean±SD, nAm) in select time epochs in high and low pain catastrophisers during viewing pain or non-pain pictures. F values (with degrees of freedom), P values and effect sizes (η2p) for ANOVA comparisons are also shown. C = main effect of catastrophising, P = main effect of picture type, C*I = interaction effect. Source 1 = rostral anterior cingulate cortex 280–336 ms; Source 2 = left paraphippocampal gyrus 596–828 ms; Source 3 = right parahippocampal gyrus 580–664 ms; Source 4a-4b = posterior cingulate cortex 384–452 ms and 756–1144 ms respectively.
by visual stimuli than in the High-Cat group. Correlations between source activations and between the respective picture ratings can be found in supplementary materialsS1A and S1B Table.
Discussion
High pain catastrophising individuals attributed more pain to pictures depicting high, and even low, risk of pain being inflicted. The comparison of cortical activations during passive viewing of pictures revealed several differences between Cat and Low-Cat groups. High-Cat participants exhibited a blunting of the cortical response in the rACC and PCC between 280 to 450 ms after stimulus onset, which was followed by a pattern of augmented cortical responses in PHGLand PCC during the late latency window (>600 ms). Furthermore, only
the Low-Cat group demonstrated a correspondence between source strength of the PCC activa-tion and pain and arousal ratings during the late latency period. This correlaactiva-tion was weaker in the High-Cat group, suggesting an undifferentiated and amplified response during the late period of processing pain and non-pain pictures in High-Cat participants.
Picture ratings
[image:11.612.35.582.89.293.2]Participants with high pain catastrophising scores attributed greater pain and unpleasantness to visual scenes depicting somatic pain in others than participants with low pain catastrophis-ing scores, which accords with previous research [17,20]. Further, the High-Cat group also attributed more pain to pictures depicting a low risk of pain, which supports the stipulation that high pain catastrophising individuals are more likely to interpret stimuli as painful even if there is only a remote, indirect or small possibility of pain being inflicted [25,65]. This general-ised sensitivity to somatic visual stimuli was evident despite the fact that discrimination between pain and non-pain pictures was appropriate and similar for both High-Cat and Low-Cat groups. Our findings support the attentional bias theory of pain catastrophising which argues that pain experience is amplified via exaggerated attention to sensory and affective cues
Table 5. Correlations between sources activations and subjective ratings.
High-Cat
Source Valency Arousal Pain
rho P rho P rho P
1 0.03 0.92 0.35 0.2 0.16 0.58
2 0.34 0.21 0.3 0.28 0.44 0.10
3 -0.45 0.88 0.79 0.78 -0.24 0.39
4a -0.12 0.68 0.01 0.97 -0.09 0.74
4b 0.17 0.55 0.49 0.064 0.34 0.22
Low-Cat
Source Valency Arousal Pain
rho P rho P rho P
1 0.30 0.27 0.38 0.17 0.41 0.13
2 -0.21 0.45 -0.14 0.62 -0.4 0.14
3 0.08 0.79 -0.13 0.63 0.09 0.76
4a 0.37 0.18 0.36 0.19 0.37 0.18
4b 0.58 0.023 0.74 0.002* 0.8 <0.001*
Spearman’s correlations (Rho and P values) for the difference between pain and non-pain pictures in source activations and subjective ratings of valence, arousal and pain. Correlation is significant at the P<0.05 level (two-tailed) following Bonferroni-Šidák correction for multiple tests.
[25], and accord with empirical evidence pointing towards attention bias as a cognitive mecha-nism for pain catastrophising behaviour (reviewed in Quartana et al. [3]).
Mid-latency ERPs
In accordance with previous neuroimaging studies of observed pain [41–46], we found evi-dence for rACC, bilateral PHG and PCC involvement in processing of pain and non-pain pic-tures in both high and low pain catastrophising participants, with a significantly stronger activation during pain pictures evident in the PCC. The mid-latency window (280‒450 ms) demonstrated a positive potential with a spatial maxima over central-parietal electrodes, corre-sponding with the latency and topographic location of the P300 component. The amplitudes of source activations in the rACC and PCC were reduced during this period in High-Cat, com-pared to Low-Cat, participants for both types of stimuli. P300 amplitude is known to reflect the influence of top-down processes such as attentional factors, task relevance, stimuli salience and motivational significance during passive viewing of emotional stimuli [37,38,66,67] as well as subjective arousal [38]. Previous studies have found that phobic participants exhibit an enhanced P300 to fear related pictures due to the extreme motivational salience of stimuli [68– 70]. Similarly, our research group has recently shown that chronic pain patients with fibromy-algia syndrome manifest augmented P300 responses to both pain and non-pain pictures, sug-gesting increased salience and attention for somatic stimuli with even a low risk of pain [71]. By contrast, experienced physicians viewing pain pictures demonstrate reduced P300 ampli-tudes and subjective pain ratings for observed pain, due to desensitisation to pain-related sti-muli [30]. Likewise, the present study shows that High-Cat, compared to Low-Cat, participants manifest attenuated P300 amplitudes for both types of stimuli in the rACC and PCC. This would suggest that the appraisal of attentional allocation, stimuli salience and motivational sig-nificance for both pain, and non-pain, pictures is altered in the High-Cat group. Alternatively, mid-latency ERP components have also been associated with emotional regulation [37], and activations for both types of stimuli may reflect self-regulatory processes to control affective responses to the pictures. One can speculate that such preventative regulation may be lacking in High-Cat participants, leading them to eventually over-react to any somatic stimuli, which could explain the augmented late activation profile.
A previously meta-analyses of fMRI studies of passive viewing of pain identified ACC as a core region for empathic processing [46]. Furthermore, both anterior and posterior cingulate cortices have been proposed as neural generators contributing to P300 salience-related responses (reviewed in Linden, [72]). Our findings of reduced cortical activations in these regions suggest that high pain catastrophising individuals exhibit blunted processing of visual scenes with somatic content during the mid-latency window which is important for appropri-ate allocation of motivational significance, attention to stimuli and other top-down influences on processing of observed pain.
Fig 4. Correlations between source components and picture ratings.Scatter plots and the linear regression lines illustrating relationships between subjective ratings of valence, arousal and pain attributed to visual stimuli and the source amplitude differences between two conditions in the posterior cingulate source dipole in the interval of from 756 to 1144 ms.A.Valence.B.Arousal.C.Pain. High-Cat = high pain catastrophisers, dark circles, solid line. Low-Cat = low pain catastrophisers, white circles, dashed line.
Long-latency ERPs
In contrast to the mid-latency findings, the long latency window (600‒1100 ms) demonstrated stronger cortical activations in High-Cat, relative to Low-Cat, group in the PHGLand PCC.
This long-latency window corresponds to the late positive potential (LPP), which is evoked by passive viewing of emotional stimuli [73–76], and characterised by a positive potential located over central-parietal regions of the scalp [66]. The LPP was previously associated with cognitive evaluation of painful stimuli [34–36]. Increased LPP amplitudes may also indicate emotional regulation during viewing of affective pictures, particularly during aversive stimuli [74–77]. In accordance with previous findings [31,78], our study reveals that LPP responses, generated in the PCC, were enhanced in both groups for pain, relative to non-pain, pictures. Furthermore, the stronger LPP activations in PCC and PHGLin High-Cat participants accord with previous
findings of augmented LPP amplitudes elicited by threatening/ feared stimuli in a high anxiety [79], and phobic participants [69].
Consistent with a recent source localisation study of phobic patients undergoing exposure to fear stimuli [80], the present study revealed that the LPP response to pain and non-pain pic-tures was generated in the PCC and medial-temporal cortices. In humans, the PCC is engaged during emotion regulation [81] and episodic memory retrieval [82], amongst various other functions (reviewed by Vogt and Laureys, [83]). The enhanced LPP amplitude in these regions raises the possibility that High-Cat participants require greater resources for emotional regula-tion when observing somatic scenes, or are more likely to relate pain (and even non-pain) cues to prior pain experience. This finding may relate to observed difficulties in disengaging from pain cues in High-Cat individuals [63,84]. Furthermore, the results show that the magnitude of PCC activation in this time period demonstrated a significantly stronger positive correlation with arousal and subjective pain ratings of stimuli in Low-Cat, relative to High-Cat, partici-pants. In high pain catastrophising participants, the late latency activation in the PCC was aug-mented for both types of stimuli, but did not correspond to levels of observed pain or arousal. We can speculate that the augmented activations relate to a generalised state of arousal for somatic cues in High-Cat participants, although further research is needed to corroborate this. LPP amplitude was previously, proposed to reflect subjective arousal associated with process-ing of affective stimuli [38,66,85].
The late latency activations in the present study were seen in bilateral medial temporal corti-ces encompassing hippocampus, parahippocampal gyri and entorhinal cortex. Previously, functional lateralisation of the medial temporal cortices was proposed, with the right side usu-ally activated first by emotional stimuli, and mediating a global emotional reaction, with the left hemisphere being more engaged in cognitive-emotional processing of stimuli [86,87]. In support of this explanation, a previous ERP study for observed pain reported predominantly left hemisphere activation differences when differentiating painful and neutral pictures [31]. The present study similarly identified independent activation profiles for each of the medial temporal cortices. The activation in the PHGRpeaked 40 ms prior to PHGL, and was stronger
for non-pain pictures across both groups, whereas the PHGLdisplayed stronger activations in
High-Cat, relative to Low-Cat, participants and covered a significantly larger time window. These findings suggest that the left medial-temporal cortex was more likely to contribute to altered evaluation of pictures in High-Cat participants.
the tertile cut-offs used to define groups based on PCS scores means that few group members may be included as high or low catastrophisers despite scoring relatively normal scores. This limitation of the group descriptors and the method should be considered when interpreting the findings. On the other hand, the same factor has the added benefit of improving the relevance of findings for respondents with less extreme PCS scores. It is also possible that the responses to non-pain pictures could be in some way influenced by the pain context of the experiment, and the presence of pain cues in 50% of trials. This could also explain the finding of enhanced mid-latency activations to both types of stimuli in Low-Cat participants, with augmented acti-vation profiles seen later in High-Cat group. This limitation should be considered in future research, e.g. it may be useful to include a further comparison with no somatic content.
To sum up, the findings indicate that individuals with a high pain catastrophising trait ini-tially demonstrate a pattern of blunting of the cortical response during early appraisal of pain and non-pain pictures, before an augmented pattern of cortical activation is established during the late period of cognitive evaluation of stimuli. The cortical activation differences may reflect alterations to the initial appraisal of stimuli salience and motivational significance, followed by a greater allocation of resources for emotional regulation, or an enhanced engagement with painful (and even non-painful, somatic) cues in high pain catastrophising individuals. The findings may be indicative of generalised sensitivity to somatic pictures in High-Cat individu-als, although the contrasting directions of mid and long latency source activation differences points towards a complex mechanism underlying the augmented subjective ratings for pain and non-pain pictures. Pain catastrophising contributes to perceived pain intensity during experimental pain [1,4,5], and it is also associated with increased pain severity, emotional dis-tress and disability in chronic pain patients with osteoarthritis [6,7], rheumatoid arthritis [8], fibromyalgia [10] and low back pain [11,12]. Thus, pain catastrophising can be considered as a predictor for a variety of pain-related outcomes, both in healthy and chronic pain populations [3]. By improving our understanding of the mechanisms by which catastrophising influences the pain experience, we can begin to unlock the potential clinical benefits of addressing pain catastrophising itself.
Supporting Information
S1 Table. Correlations between source activations and picture ratings.A. Spearman’s
corre-lations (Rho and P values) for the activation difference between pain and non-pain pictures in each of the five source activations.Correlation is significant at the P<0.05 level (two-tailed) following Bonferroni-Šidák correction for multiple tests. B. Spearman’s correlations for the activation difference between pain and non-pain pictures for pain, valence and arousal rating scales.
(DOCX)
Author Contributions
Conceived and designed the experiments: AS. Performed the experiments: NF XL. Analyzed the data: NF XL AS. Wrote the paper: NF XL AS. Author of analysis scripts utilised in the study: AS.
References
2. Sullivan MJL, Thorn B, Haythornthwaite JA, Keefe F, Martin M, Bradley LA, et al. (2001) Theoretical perspectives on the relation between catastrophizing and pain. Clin J Pain 17: 52–64. PMID: 11289089
3. Quartana PJ, Campbell CM, Edwards RR (2009) Pain catastrophizing: a critical review. Expert Rev Neurother 9: 745–758. doi:10.1586/ern.09.34PMID:19402782
4. Edwards RR, Haythornthwaite JA, Sullivan MJ, Fillingim RB (2004) Catastrophizing as a mediator of sex differences in pain: differential effects for daily pain versus laboratory-induced pain. Pain 111: 335–341. PMID:15363877
5. Sullivan MJL, Rodgers WM, Wilson PM, Bell GJ, Murray TC, Fraser SN (2002) An experimental investi-gation of the relation between catastrophizing and activity intolerance. Pain 100: 47–53. PMID: 12435458
6. Keefe FJ, Lefebvre JC, Egert JR, Affleck G, Sullivan MJ, Caldwell DS (2000) The relationship of gender to pain, pain behavior, and disability in osteoarthritis patients: the role of catastrophizing. Pain 87: 325– 334. PMID:10963912
7. Sullivan MJL, Tanzer M, Stanish W, Fallaha M, Keefe FJ, Simmonds M, et al. (2009) Psychological determinants of problematic outcomes following Total Knee Arthroplasty. Pain 143: 123–129. doi:10. 1016/j.pain.2009.02.011PMID:19304392
8. Lefebvre JC, Keefe FJ (2002) Memory for Pain: The Relationship of Pain Catastrophizing to the Recall of Daily Rheumatoid Arthritis Pain. Clin J Pain 18: 56–63. PMID:11803304
9. Turner JA, Jensen MP, Warms CA, Cardenas DD (2002) Catastrophizing is associated with pain inten-sity, psychological distress, and pain-related disability among individuals with chronic pain after spinal cord injury. Pain 98: 127–134. PMID:12098624
10. Geisser ME, Casey KL, Brucksch CB, Ribbens CM, Appleton BB, Crofford LJ (2003) Perception of nox-ious and innocuous heat stimulation among healthy women and women with fibromyalgia: association with mood, somatic focus, and catastrophizing. Pain 102: 243–250. PMID:12670665
11. Peters ML, Vlaeyen JWS, Weber WEJ (2005) The joint contribution of physical pathology, pain-related fear and catastrophizing to chronic back pain disability. Pain 113: 45–50. PMID:15621363
12. Swinkels-Meewisse IEJ, Roelofs J, Oostendorp RAB, Verbeek ALM, Vlaeyen JWS (2006) Acute low back pain: pain-related fear and pain catastrophizing influence physical performance and perceived disability. Pain 120: 36–43. PMID:16359797
13. Thibault P, Loisel P, Durand M-J, Catchlove R, Sullivan MJL (2008) Psychological predictors of pain expression and activity intolerance in chronic pain patients. Pain 139: 47–54. doi:10.1016/j.pain.2008. 02.029PMID:18430518
14. Wideman TH, Adams H, Sullivan MJL (2009) A prospective sequential analysis of the fear-avoidance model of pain. Pain 145: 45–51. doi:10.1016/j.pain.2009.04.022PMID:19477072
15. Pavlin DJ, Sullivan MJL, Freund PR, Roesen K (2005) Catastrophizing: A Risk Factor For Postsurgical Pain. Clin J Pain 21: 83–90. PMID:15599135
16. Jacobsen PB, Butler RW (1996) Relation of cognitive coping and catastrophizing to acute pain and analgesic use following breast cancer surgery. J Behav Med 19: 17–29. PMID:8932659
17. Sullivan MJL, Rodgers WM, Kirsch I (2001) Catastrophizing, depression and expectancies for pain and emotional distress. Pain 91: 147–154. PMID:11240087
18. Keefe FJ, Brown GK, Wallston KA, Caldwell DS (1989) Coping with rheumatoid arthritis pain: catastro-phizing as a maladaptive strategy. Pain 37: 51–56. PMID:2726278
19. Turner JA, Aaron LA (2001) Pain-related catastrophizing: What is it? Clin J Pain 17: 65–71. PMID: 11289090
20. Sullivan MJL, Martel MO, Tripp D, Savard A, Crombez G (2006) The relation between catastrophizing and the communication of pain experience. Pain 122: 282–288. PMID:16545907
21. Martel MO, Thibault P, Roy C, Catchlove R, Sullivan MJL (2008) Contextual determinants of pain judg-ments. Pain 139: 562–568. doi:10.1016/j.pain.2008.06.010PMID:18701219
22. Sullivan MJL, Martel MO, Tripp DA, Savard A, Crombez G (2006) Catastrophic thinking and heightened perception of pain in others. Pain 123: 37–44. PMID:16563630
23. Sullivan MJL, Adams H, Sullivan ME (2004) Communicative dimensions of pain catastrophizing: social cueing effects on pain behaviour and coping. Pain 107: 220–226. PMID:14736584
24. Sullivan MJL, Neish N (1999) The effects of disclosure on pain during dental hygiene treatment: the moderating role of catastrophizing. Pain 79: 155–163. PMID:10068161
26. Gracely RH, Geisser ME, Giesecke T, Grant MAB, Petzke F, Williams DA, et al. (2004) Pain catastro-phizing and neural responses to pain among persons with fibromyalgia. Brain 127: 835–843. PMID: 14960499
27. Seminowicz DA, Davis KD (2006) Cortical responses to pain in healthy individuals depends on pain catastrophizing. Pain 120: 297–306. PMID:16427738
28. Vase L, Egsgaard L, Nikolajsen L, Svensson P, Jensen T, Arendt-Nielsen L (2012) Pain catastrophiz-ing and cortical responses in amputees with varycatastrophiz-ing levels of phantom limb pain: a high-density EEG brain-mapping study. Exp Brain Res 218: 407–417. doi:10.1007/s00221-012-3027-6PMID: 22349560
29. Lin CS, Niddam DM, Hsu ML, Hsieh JC (2013) Pain Catastrophizing is Associated with Dental Pain in a Stressful Context. J Dent Res 92: 130–135. doi:10.1177/0022034512467804PMID:23232145 30. Decety J, Yang C-Y, Cheng Y (2010) Physicians down-regulate their pain empathy response: An
event-related brain potential study. NeuroImage 50: 1676–1682. doi:10.1016/j.neuroimage.2010.01. 025PMID:20080194
31. Fan Y, Han S (2008) Temporal dynamic of neural mechanisms involved in empathy for pain: An event-related brain potential study. Neuropsychologia 46: 160–173. PMID:17825852
32. Li W, Han S (2010) Perspective taking modulates event-related potentials to perceived pain. Neurosci Lett 469: 328–332. doi:10.1016/j.neulet.2009.12.021PMID:20026179
33. Ibáñez A, Hurtado E, Lobos A, Escobar J, Trujillo N, Baez S, et al. (2011) Subliminal presentation of other faces (but not own face) primes behavioral and evoked cortical processing of empathy for pain. Brain Res 1398: 72–85. doi:10.1016/j.brainres.2011.05.014PMID:21624566
34. Fan YT, Chen C, Chen SC, Decety J, Cheng Y (2014) Empathic arousal and social understanding in individuals with autism: evidence from fMRI and ERP measurements. Soc Cogn Affect Neurosci 9: 1203–1213. doi:10.1093/scan/nst101PMID:23929944
35. Mella N, Studer J, Gilet AL, Labouvie-Vief G (2012) Empathy for Pain from Adolescence through Adult-hood: An Event-Related Brain Potential Study. Front Psychol 3: 501. doi:10.3389/fpsyg.2012.00501 PMID:23189065
36. Chen C, Yang CY, Cheng Y (2012) Sensorimotor resonance is an outcome but not a platform to antici-pating harm to others. Soc Neurosci 7: 578–590. doi:10.1080/17470919.2012.686924PMID: 22642373
37. Hajcak G, MacNamara A, Olvet DM (2010) Event-related potentials, emotion, and emotion regulation: an integrative review. Dev Neuropsychol 35: 129–155. doi:10.1080/87565640903526504PMID: 20390599
38. Olofsson JK, Nordin S, Sequeira H, Polich J (2008) Affective picture processing: an integrative review of ERP findings. Biol Psychol 77: 247–265. doi:10.1016/j.biopsycho.2007.11.006PMID:18164800 39. Akitsuki Y, Decety J (2009) Social context and perceived agency affects empathy for pain: An event-related fMRI investigation. NeuroImage 47: 722–734. doi:10.1016/j.neuroimage.2009.04.091PMID: 19439183
40. Cheng Y, Lin C-P, Liu H-L, Hsu Y-Y, Lim K-E, Hung D, et al. (2007) Expertise Modulates the Perception of Pain in Others. Curr Biol 17: 1708–1713. PMID:17900903
41. Gu X, Han S (2007) Attention and reality constraints on the neural processes of empathy for pain. Neu-roImage 36: 256–267. PMID:17400480
42. Jackson PL, Brunet E, Meltzoff AN, Decety J (2006) Empathy examined through the neural mecha-nisms involved in imagining how I feel versus how you feel pain. Neuropsychologia 44: 752–761. PMID:16140345
43. Jackson PL, Meltzoff AN, Decety J (2005) How do we perceive the pain of others? A window into the neural processes involved in empathy. NeuroImage 24: 771–779. PMID:15652312
44. Singer T, Seymour B, O'Doherty J, Kaube H, Dolan RJ, Frith CD (2004) Empathy for Pain Involves the Affective but not Sensory Components of Pain. Science 303: 1157–1162. PMID:14976305
45. Singer T, Seymour B, O'Doherty JP, Stephan KE, Dolan RJ, Frith CD (2006) Empathic neural responses are modulated by the perceived fairness of others. Nature 439: 466–469. PMID:16421576 46. Lamm C, Decety J, Singer T (2011) Meta-analytic evidence for common and distinct neural networks
associated with directly experienced pain and empathy for pain. NeuroImage 54: 2492–2502. doi:10. 1016/j.neuroimage.2010.10.014PMID:20946964
47. Bradley MM, Lang PJ (1994) Measuring emotion: The self-assessment manikin and the semantic differ-ential. J Behav Ther Exp Psychiatry 25: 49–59. PMID:7962581
49. Lehmann D (1987) Principles of spatial analysis. In: Gevins AS, Remond A, editors. Handbook of Electroencephalography and Clinical Neurophysiology: Methods of Analysis of Brain Electrical and Magnetic Signals Amsterdam: Elsevier. pp. 309–354.
50. Berg P, Scherg M (1994) A multiple source approach to the correction of eye artifacts. Electroencepha-logr Clin Neurophysiol 90: 229–241. PMID:7511504
51. Hoechstetter K, Berg P, Scherg M (2010) BESA Research Tutorial 4: Distributed Source Imaging. 52. Pascual-Marqui RD, Michel CM, Lehmann D (1994) Low resolution electromagnetic tomography: a
new method for localizing electrical activity in the brain. Int J Psychophysiol 18: 49–65. PMID:7876038 53. Hämäläinen JA, Ortiz-Mantilla S, Benasich AA (2011) Source localization of event-related potentials to
pitch change mapped onto age-appropriate MRIs at 6 months of age. NeuroImage 54: 1910–1918. doi: 10.1016/j.neuroimage.2010.10.016PMID:20951812
54. Valentini E, Hu L, Chakrabarti B, Hu Y, Aglioti SM, Iannetti GD (2012) The primary somatosensory cor-tex largely contributes to the early part of the cortical response elicited by nociceptive stimuli. Neuro-Image 59: 1571–1581. doi:10.1016/j.neuroimage.2011.08.069PMID:21906686
55. Valentini E, Liang M, Aglioti SM, Iannetti GD (2012) Seeing touch and pain in a stranger modulates the cortical responses elicited by somatosensory but not auditory stimulation. Hum Brain Mapp 33: 2873– 2884. doi:10.1002/hbm.21408PMID:22234936
56. Gutschalk A, Micheyl C, Melcher JR, Rupp A, Scherg M, Oxenham AJ (2005) Neuromagnetic Corre-lates of Streaming in Human Auditory Cortex. J Neurosci 25: 5382–5388. PMID:15930387 57. Schlereth T, Baumgärtner U, Magerl W, Stoeter P, Treede R-D (2003) Left-hemisphere dominance in
early nociceptive processing in the human parasylvian cortex. NeuroImage 20: 441–454. PMID: 14527605
58. Stancák A, Alghamdi J, Nurmikko TJ (2011) Cortical activation changes during repeated laser stimula-tion: a magnetoencephaloghraphic study. PLOS1 6: e19744.
59. Tarkka IM, Treede R-D (1993) Equivalent electrical source analysis of pain-related somatosensory evoked potentials elicited by a CO2 laser. J Clin Neurophysiol 10: 513–519. PMID:8308146 60. Holmes AP, Blair RC, Watson JD, Ford I (1996) Nonparametric analysis of statistic images from
func-tional mapping experiments. J Cereb Blood Flow Metab 16: 7–22. PMID:8530558
61. Nichols TE, Holmes AP (2002) Nonparametric permutation tests for functional neuroimaging: a primer with examples. Hum Brain Mapp 15: 1–25. PMID:11747097
62. Maris E, Oostenveld R (2007) Nonparametric statistical testing of EEG- and MEG-data. J Neurosci Methods 164: 177–190. PMID:17517438
63. Van Damme S, Crombez G, Eccleston C (2004) Disengagement from pain: the role of catastrophic thinking about pain. Pain 107: 70–76. PMID:14715391
64. DeCarlo LT (1998) Signal detection theory and generalized linear models. Psychol Methods 3: 186– 205.
65. Crombez GP, Eccleston CP, Van den Broeck AM, Goubert LM, Van Houdenhove BMD (2004) Hyper-vigilance to Pain in Fibromyalgia: The Mediating Role of Pain Intensity and Catastrophic Thinking About Pain. Clin J Pain 20: 98–102. PMID:14770049
66. Hajcak G, Weinberg A, MacNamara A, Foti D (2011) ERPs and the Study of Emotion. In: Luck SJ, Kap-penman ES, editors. The Oxford Handbook of Event-Related Potential Components. New York, U.S. A.: Oxford Univerisity Press. pp. 441–472.
67. McCarthy G, Donchin E (1981) A metric for thought: a comparison of P300 latency and reaction time. Science 211: 77–80. PMID:7444452
68. Leutgeb V, Schäfer A, Köchel A, Schienle A (2012) Exposure therapy leads to enhanced late frontal positivity in 8- to 13-year-old spider phobic girls. Biol Psychol 90: 97–104. doi:10.1016/j.biopsycho. 2012.02.008PMID:22388043
69. Leutgeb V, Schäfer A, Schienle A (2009) An event-related potential study on exposure therapy for patients suffering from spider phobia. Biol Psychol 82: 293–300. doi:10.1016/j.biopsycho.2009.09.003 PMID:19751797
70. Mühlberger A, Wiedemann G, Herrmann MJ, Pauli P (2006) Phylo- and ontogenetic fears and the expectation of danger: Differences between spider- and flight-phobic subjects in cognitive and physio-logical responses to disorder-specific stimuli. J Abnorm Psychol. pp. 580–589. PMID:16866598 71. Fallon N, Li X, Chiu Y, Nurmikko T, Stancak A (2015) Altered cortical processing of observed pain in
fibromyalgia syndrome patients. J Pain.
73. Foti D, Hajcak G, Dien J (2009) Differentiating neural responses to emotional pictures: Evidence from temporal-spatial PCA. Psychophysiology 46: 521–530. PMID:19496228
74. Hajcak G, Dunning JP, Foti D (2007) Neural response to emotional pictures is unaffected by concurrent task difficulty: An event-related potential study. Behav Neurosci 121: 1156–1162. PMID:18085868 75. Hajcak G, Moser JS, Simons RF (2006) Attending to affect: Appraisal strategies modulate the
electro-cortical response to arousing pictures. Emotion 6: 517–522. PMID:16938092
76. Hajcak G, Olvet DM (2008) The persistence of attention to emotion: Brain potentials during and after picture presentation. Emotion 8: 250–255. doi:10.1037/1528-3542.8.2.250PMID:18410198 77. Foti D, Hajcak G (2008) Deconstructing Reappraisal: Descriptions Preceding Arousing Pictures
Modu-late the Subsequent Neural Response. J Cognit Neurosci 20: 977–988.
78. Ikezawa S, Corbera S, Wexler BE (2014) Emotion self-regulation and empathy depend upon longer stimulus exposure. Soc Cogn Affect Neurosci 9: 1561–1568. doi:10.1093/scan/nst148PMID: 24064924
79. MacNamara A, Hajcak G (2009) Anxiety and spatial attention moderate the electrocortical response to aversive pictures. Neuropsychologia 47: 2975–2980. doi:10.1016/j.neuropsychologia.2009.06.026 PMID:19576234
80. Scharmüller W, Leutgeb V, Schäfer A, Köchel A, Schienle A (2011) Source localization of late electro-cortical positivity during symptom provocation in spider phobia: An sLORETA study. Brain Res 1397: 10–18. doi:10.1016/j.brainres.2011.04.018PMID:21600565
81. Vogt BA (2005) Pain and emotion interactions in subregions of the cingulate gyrus. Nat Rev Neurosci 6: 533–544. PMID:15995724
82. Cavanna AE, Trimble MR (2006) The precuneus: a review of its functional anatomy and behavioural correlates. Brain 129: 564–583. PMID:16399806
83. Vogt BA, Laureys S (2005) Posterior cingulate, precuneal and retrosplenial cortices: cytology and com-ponents of the neural network correlates of consciousness. Prog Brain Res 150: 205–217. PMID: 16186025
84. Van Damme S, Crombez G, Eccleston C (2002) Retarded disengagement from pain cues: the effects of pain catastrophizing and pain expectancy. Pain 100: 111–118. PMID:12435464
85. Weinberg A, Hajcak G (2010) Beyond good and evil: The time-course of neural activity elicited by spe-cific picture content. Emotion 10: 767–782. doi:10.1037/a0020242PMID:21058848
86. Glascher J, Tuscher O, Weiller C, Buchel C (2004) Elevated responses to constant facial emotions in different faces in the human amygdala: an fMRI study of facial identity and expression. BMC Neurosci 5: 45. PMID:15548329