ΓΑ ι
DEB EUROPAISCHEN GEMEINS PESE GEMEENSCHAPPEN DE' NAUTES EUROPEENNES STAI AFTEN ISTITUTO STATISTICO ATISTISKE DEPARTEMENT FOR CAL OFFICE OF THE EUROPEAN
,E COMUNITÀ EUROPEE BURI JROPÆISKE FÆ LLESSKABER ■ ¿MUNITIES STATISTISCHES A /OOR DE STATISTIEK DER EURC pFFICE STATISTIQUE DES COMI\ PER EUROPÄISCHEN GEMEINSC ESE GEMEENSCHAPPEN DET \IAUTES EUROPEENNES STAI ¡AFTEN ISTITUTO STATISTICO 'ATISTISKE DEPARTEMENT FOR Dl ¡CAL OFFICE OF THE EUROPEAN d .E COMUNITÀ EUROPEE BUREA UROPÆ ISKE FÆ LLESSKABER β /lUNITIES STATISTISCHES Al\
)OR DE STATISTIEK DER EURC
eurostat
'NAUTES EURC FTEN ISTITL TISTISKE DEP AL OFFICE OF ICE STATISTIQUE DES COMMUNAL
I EUROPÄISCHEN GEMEINSCHAFT ÜEMEENSCHAPPEN DET STATISI
EUROPEENNES STATISTICAL OFF
STITUTO STATISTICO DELLE COMUNITÀ EUROPEE BUREAU VOOR DE STATISTIEK DER EUROPESE GEME DEPARTEMENT FOR DE EUROPÆISKE FÆLLESSKABER OFFICE STATISTIQUE DES COMMUNAUTES EUR< !>F THE EUROPEAN COMMUNITIES STATISTISCHES AMT DER EUROPÄISCHEN GEMEINSCHAFTEN ISTIT EUROPEE BUREAU VOOR DE STATISTIEK DER EUROPESE GEMEENSCHAPPEN1 DET STATISTISKE DEF
ÌENNES STAI OFFICE DMUNI1 ΡÆ ISKI STATISTICAL OFFICE OF THE EUROPEAN COM
FÆLLESSKABER OFFICE STATISTIQUE DES COMMUNAUTES EUROPEENNES
STATISTISCHES AMT DER EUROPAISCHEN GEMEINSCHAFTEN ISTITUTO STATISTICO DELLE COMUNITÀ EUROPE
riSTIEK DER EUROPESE GEMEENSCHAPPEN DET STATISTISKE DEPARTEMENT ROR DE EUROPÆISKE FÆLLESSKABER OFFIC QUE DES COMMUNAUTES EUROPEENNES STATISTICAL OFFICE OF THE EUROPEAN COMMUNITIES STATISTISCHES AMT DER E
¡HEN GEMEINSCHAFTEN ISTITUTO STATISTICO DELLE COMUNITÀ EUROPEE BUREAU VOOR DE STATISTIEK DER EUROPESE GEMEENSC lAPPEN DET STATISTISKE DEPARTEMENT FOR DE EUROPÆ ISKE FÆ LLESSKABER OFFICE STATISTIQUE DES COMMUNAUTES EUROPE
ENERGISTATISTIK
ENERGIESTATISTIK
ENERGY STATISTICS
STATISTIQUES DE L'ENERGIE
STATISTICHE DELL'ENERGIA
ENERGIESTATISTIEK
A COMPARISON
OF FUEL PRICES:
OIL · COAL · GAS
COMPARAISON DES PRIX
DES COMBUSTIBLES:
PETROLE · CHARBON · GAZ
EUR6: 19551970
eurostat
DE EUROPÆISKE FÆLLESSKABERS STATISTISKE KONTOR
STATISTISCHES AMT DER EUROPÄISCHEN GEMEINSCHAFTEN STATISTICAL OFFICE OF THE EUROPEAN COMMUNITIES OFFICE STATISTIQUE DES COMMUNAUTÉS EUROPÉENNES ISTITUTO STATISTICO DELLE COMUNITÀ EUROPEE
BUREAU VOOR DE STATISTIEK DER EUROPESE GEMEENSCHAPPEN
Luxembourg, Centre Européen, Boîte postale 1907 —Tél. 47941 Télex : Comeur 423
1040 Bruxelles, Bâtiment Berlaymont, 200, rue de la Loi (Bureau de liaison) — Tél. 35 80 40
Denne publikation kan fås gennem de salgssteder, som er nævnt på bagsiden af dette hæfte.
Diese Veröffentlichung ¡st bei den auf der Rückseite des Einbands aufgeführten Vertriebsstellen erhältlich.
This publication is obtainable from the sales agents mentioned on the back of the cover.
Pour obtenir cette publication, prière de s'adresser aux bureaux de vente dont les adresses sont indiquées au dos de la couverture.
Per ottenere questa pubblicazione, si prega di rivolgersi agli uffici di vendita i cui indirizzi sono indicati sul dorso della copertina.
ENERGISTATISTIK
ENERGIESTATISTIK
ENERGY STATISTICS
STATISTIQUES DE L'ÉNERGIE
STATISTICHE DELL'ENERGIA
ENERGIESTATISTIEK
A COMPARISON
OF FUEL PRICES :
OIL COAL GASCOMPARAISON DES PRIX
DES COMBUSTIBLES :
PÉTROLE CHARBON GAZ
EUR 6 : 19551970
SPECIALHÆFTE SONDERHEFT SPECIAL NUMBER ■ NUMÉRO SPÉCIAL NUMERO SPECIALE SPECIAAL NUMMER
Typescript completed in November 1973 Manuscrit terminé en novembre 1973
ORIGINAL: FRENCH ORIGINAL: FRANÇAIS
Indholdsgengivelse kun tilladt med angi-velse af kilde
Inhaltswiedergabe nur mit Quellennach-weis gestattet
Reproduction of the contents of this publi-cation is subject to acknowledgement of the source
La reproduction des données est subor-donnée à l'indication de la source La riproduzione del contenuto è subordi-nata alla citazione della fonte
I N D E X
I - Foreword
Table Graph Page
5
2.
II - Scheme of the paper and procedure adopted 1. Sources and definitions of prices
2. Scope
3. Equivalent standards of comparison 4. The quantitative factor
III - Germany (Federal Republic) 1. Comparison of oil and coal prices
a) Industrial usage b) Domestic usage
2. Comparison of oil, natural gas and coal prices a) Industrial usage
b) Domestic usage
IV - France
1. Comparison of oil and coal prices a) Industrial usage
b) Domestic usage
Comparison of oil, natural gas and coal prices a) Industrial usage
b) Domestic usage
V - Italy
1. Comparison of oil and coal prices a) Industrial and domestic sectors 2. Comparison of oil and natural gas prices
a) Industrial usage b) Domestic usage
VI - Netherlands
1. Comparison of oil and coal prices a) Industrial usage
b) Domestic usage
2. Comparison of oil and natural gas prices a) Industrial usage
b) Domestic usage
VII - Belgium
1. Comparison of oil and coal prices a) Industrial usage
b) Domestic usage
2. Comparison of oil and natural gas prices a) Industrial usage
b) Domestic usage
VIII - Grand Duchy of Luxembourg
1. Comparison of oil, coal and gas prices a) Industrial usage
b) Domestic usage
IX - General conclusions
1. Divergencies in the movements of prices for oil and coal 2. Principal stages in the competition between oil and coal 3. Aspects of the competitive position of natural gas
29-30
31-36 37-39
29-30
31-32 1-2
3-4 5 6-7
1-3 4-6 7 8
10 20 29 34
8-9 10-11 12-15 16-19
9-11 12-14 15 16-17
39 47 57 61
73 20
20
—
18 18
—
74 81
—
1-22
23 24
—
19-21
22 23
83 83
94 98
5-26 27 28
24-26
27 28
102 102 111 115
119 119
S O M M A I R E
I - Avant-propos
Il - Plan et méthode de l'étude 1. Sources et définitions des prix 2. Champ d'application
3. Egalisation des conditions de comparaison 4. Effets quantitatifs
III - Allemagne (RF)
1. Comparaison des prix pétrole/charbon a) industrie
b) foyers domestiques
2. Comparaison des prix pétrole/gaz naturel/charbon a) industrie
b) foyers domestiques
IV - France
1. Comparaison des prix pétrole/charbon a) industrie
b) foyers domestiques
2. Comparaison des prix pétrole/gaz naturel/charbon a) industrie
b) foyers domestiques
V - Italie
1. Comparaison des prix pétrole/charbon a) industrie et foyers domestiques 2. Comparaison des prix pétrole/gaz naturel
a) industrie
b) foyers domestiques
VI - Pays-Bas
1. Comparaison des prix pétrole/charbon a) industrie
b) foyers domestiques
2. Comparaison des prix pétrole/gaz naturel a) industrie
b) foyers domestiques
VII - Belgique
1. Comparaison des prix pétrole/charbon a) industrie
b) foyers domestiques
2. Comparaison des prix pétrole/gaz naturel a) industrie
b) foyers domestiques
VIII - Grand-Duché de Luxembourg
1. Comparaison des prix pétrole/charbon/gaz a) industrie
b) foyers domestiques
IX - Conclusions générales
1. Divergences des tendances de prix pétrole/charbon 2. Phases essentielles de la concurrence pétrole/charbon 3. Aspects de la position concurrentielle du gaz naturel
Tableaux Graphiques Pages — — 5
5 7 8 9
1-2 3-4
5 6-7
1-3 4-6
7 8
10 20
29 34
8-9 10-11
12-15 16-19
9-11 12-14
15 16-17
39 47
57 61
20 18
73
74 81
— 1-22
23 24
— 19-21
22 23
83 83
94 98
5-26
27 28
24-26
27 28
102 102
111 115
— 29-30
31-36 37-39 —
— 29-30
31-32 — —
119 119
I — FOREWORD AVANT-PROPOS
The Statistical Office of the European Communities is continuing its endeavours to bring about a better understanding of the energy scene. Atter the pub-lication of detailed quantitative statistics, mostly in the form of balance sheets of energy consump-tion, it was time to tackle the question of price sta-tistics, a field which had hitherto received scant attention. This was a long and exacting task, since the true prices of energy products were in the major-ity of cases not known. The first task therefore was to undertake systematic listings of a sufficiently uni-form nature to enable utilizable series of price sta-tistics to be drawn up. Three main energy sources have been surveyed in turn over the last few years: fuel oils, gas and coal. The Statistical Office is now entering on the second stage, of attempting to pro-duce a synthesis of these price statistics. The pre-sent paper is in the context of this plan, its aim being to present a comparative study of the real prices to the consumer of the principal solid, liquid and gas-eous fuels in the six Member States of the Commu-nity over a long period, from 1955 to 1970. It is not surprising that in a survey of this kind it has sometimes proved difficult to arrive at a uniform standard of comparison, both in statistical and
tech-nical applications. However, in order to make the paper as readily understandable to as many readers as possible, we have from the outset adopted a sim-plified formula. We have set ourselves certain terms of reference — described in the next chapter — which in our view bring out those situations which are the most representative and which have the most general application. The reader is at liberty to mod-ify these terms, or to introduce his own gradations, or to take additional factors into account. The basic data are there to enable him to do so. But we do not believe that any such modifications will
lead to any different conclusions.
L'Office statistique des Communautés européennes poursuit ses efforts en vue d'une meilleure connais-sance du monde de l'énergie. Après avoir réalisé des statistiques quantitatives détaillées, notamment sous forme de bilans d'énergie, il devenait néces-saire d'aborder les statistiques en valeur, domaine jusque-là peu exploré. C'était une œuvre de longue haleine, car les prix réels des produits énergétiques demeuraient le plus souvent inconnus. La première tâche a donc consisté à pratiquer des relevés sys-tématiques et suffisamment homogènes pour ob-tenir des séries statistiques de prix utilisables. Trois sources d'énergie furent successivement relevées au cours des années passées : les fuel-oils, le gaz et le charbon. L'Office statistique aborde main-tenant la deuxième phase en tentant une synthèse de ces statistiques en valeur. C'est dans cette perspective que s'inscrit la présente étude qui a pour but la comparaison des prix réels à la consom-mation des principaux combustibles solides, li-quides et gazeux dans les six pays membres de la Communauté, sur une longue période s'étendant de 1955 à 1970. Nul ne s'étonnera d'apprendre qu'une telle étude a soulevé de nombreux problèmes de comparabilité d'ordre statistique ou technique. Mais, afin de rendre cette étude accessible au plus grand nombre de lecteurs, nous avons adopté délibérément un parti pris de simplicité. Nous nous sommes placés dans certaines conditions — dé-crites dans le chapitre suivant — que nous pensons représenter les situations à la fois les plus typiques et les plus générales. Libre au lecteur de modifier ces conditions, d'introduire des nuances, de con-sidérer des facteurs supplémentaires. Il dispose pour ce faire des données de base. Cependant, nous ne croyons pas que de telles modifications puissent conduire à des conclusions différentes.
Il — SCHEME OF THE PAPER
AND PROCEDURE ADOPTED Il — PLAN ET MÉTHODE DE L'ÉTUDE
1. Sources and definitions of prices
The present paper sets out to compare prices of the principal solid, liquid and gaseous fuels in use in the Member States of the Community of the Six, based on surveys carried out by the Statistical Office of the European Communities for the period 1955-1970, whose results have been published in the following compilations :
1. Sources et définitions des prix
— " Movements of coal prices in the countries of the Community from 1955 to 1970 — Bulletin of Energy Statistics, Supplement N° 1-2, 1973. — " Movements of gas prices in the countries of the Community from 1955 to 1970 " — Statis-tical Studies and Surveys N° 3, 1971.
— " Movements of fuel oil prices in EEC countries from 1955 to 1965 " — Statistical Studies and Surveys N° 4, 1969.
— " Movements of fuel oil prices in the countries of the European Community from 1966 to 1970 "— Bulletin of Energy Statistics, Supplement 1-2, 1971.
These surveys show the actual prices paid by the consumer, which can differ widely from list or posted prices because of the effect of consumer discounts. This point is central to a true comparison of the prices of energy products. It has been shown by these surveys that the actual prices paid by consumers, particularly for petroleum products, were in some cases as much as 30 % lower than list or tariff prices, and that variations in price over the period were not always in parallel.
The basic statistical series in this paper have been taken as they stand from the figures in the above surveys, apart from a few changes in accordance with details received after the surveys were pub-lished. These changes relate to heavy fuel oil N° 2 in France, heavy fuel oil (O.C. denso) in Italy, and some prices for gas in the Netherlands and Italy, arising from a number of adjustments to the basic data.
It follows from the above that these chronological series of reports are expressed in terms of current prices, without adjustment for currency revaluations or devaluations over the period. But this does not affect the analysis, which is concerned with price differences and deals with individual countries only, so that foreign exchange rates are not an issue. The surveys have established the actual prices in-voiced to consumers, inclusive of tax, in the parti-cular places and at the specific times indicated in the body of the report. With coal and petroleum pro-ducts the most common price factor has been taken (the statistical method), whereas with gas the price is taken from the tariff rates or, where these do not apply (as is sometimes the case in industry), an indicative price is given.
The norm adopted in regard to sales, supplies and consumption is also that of the most common factor. This is indicated, together with the location and the pe-riod concerned, in the relevant sections of the report. With coal, and in certain instances gas, but espec-ially with petroleum products, the listings on
occa-— « L'évolution des prix du charbon dans les pays de la Communauté de 1955 à 1970» — Bul-letin: Statistique de l'Énergie, supplément n° 1 -2/ 1973,
— « L'évolution des prix du gaz dans les pays de la Communauté de 1955 à 1970 » — Études et enquêtes statistiques n° 3/1971,
— « L'évolution des prix du fuel-oil dans les pays de la CEE de 1955 à 1965» — Études et en-quêtes statistiques n° 4/1969,
— « L'évolution des prix du fuel-oil dans les pays de la Communauté européenne de 1966 à 1970» — Bulletin: Statistique de l'Énergie, supplément n° 1-2/1971.
Ces enquêtes révèlent les prix réellement payés par les consommateurs, prix qui peuvent différer sen-siblement des barèmes ou des prix affichés, sous l'effet des remises accordées aux acheteurs. Là réside le point essentiel d'une véritable comparaison des prix des produits énergétiques. L'expérience a prouvé, lors de ces enquêtes, que les prix réels payés par les consommateurs, surtout pour les produits pétroliers, pouvaient se révéler jusqu'à 30 % inférieurs aux barèmes ou aux prix de tarif et que leur évolution dans le temps n'était pas toujours parallèle.
Les séries de base ont été prises telles quelles dans les statistiques précitées, avec toutefois quelques rectifications pour tenir compte de précisions ap-portées depuis la parution des résultats des en-quêtes. Ces rectifications portent sur le fuel-oil lourd n° 2 en France, sur le fuel-oil lourd (O.C. denso) en Italie et sur quelques prix du gaz aux Pays-Bas et en Italie. Il s'agit là en fait de quelques améliorations des données de base.
Il résulte de ce qui précède que les séries chrono-logiques sont exprimées en prix courants, donc sans aucune rectification pour variation ou dépré-ciation des unités monétaires dans le temps. Mais ceci n'affecte pas l'analyse, qui vise surtout les écarts de prix et qui reste dans les cadres nationaux, sans aucun problème de taux de change.
Les relevés ont saisi les prix réels facturés aux con-sommateurs, toutes taxes comprises, valables sur la place mentionnée à la période indiquée. Pour le charbon et les produits pétroliers, il s'agit du prix le plus fréquent (mode statistique), pour le gaz du prix résultant de l'application des tarifs ou, lorsque les tarifs faisaient défaut (pour certains usages industriels), de prix considérés comme indicatifs.
sion go outside the normal scale, though the extent of scatter is difficult to define, as it varies at different times and according to the places and products con-cerned.
Except where, as in the case of gas, fixed tariff rates are applicable, the prices given are indicative, with a small plus or minus percentage error. Conse-quently the comparative figures in the report should not be taken as absolute values, but as representative values based on the most common price factor. In the majority of cases, however, sufficient difference has been established between prices of competing energy sources to enable definite conclusions to be drawn.
certaine dispersion des relevés autour du mode, dans une fourchette, d'ailleurs difficile à délimiter car elle varie dans le temps et suivant les lieux et les produits.
Sauf pour le gaz en cas d'application d'un tarif, les prix résultant des enquêtes sont donc indicatifs et leur précision est de l'ordre de quelques pour cent en plus ou en moins. Il en découle que les résultats de la comparaison doivent être pris, non comme des valeurs strictes et absolues, mais comme des ordres de grandeur basés sur des exemples con-sidérés comme les plus fréquents. Dans la plupart des cas cependant, les écarts de prix observés entre sources d'énergie concurrentes atteignent des va-leurs significatives qui permettent de tirer des conclusions non équivoques.
2. Scope
The paper deals only with those sources of energy for which there are substitutes, in other words those affected by the factor of price competition. For this reason it does not examine the position with motor fuels, or coking or foundry coal, since there are no substitutes for their particular applications at the present stage of technology. By the same token, in the case of gaseous fuels, we have restricted our analysis almost exclusively to natural gas, the only kind which has been really competitive both be-cause of its price and of the large quantities avail-able on the market.
The report is also limited to a study of the end-usage of energy sources, and is accordingly not concerned with non-energy usages, such as petrochemistry, or with conversions of energy (gasworks and thermo-electric power stations), although substitutions can be made in these fields too; for instance, petrochem-ical technology can be used in place of coal by-products technology, (multi-purpose) power sta-tions can be run on coal, oil or gas, and gasworks, instead of using the coal distillation process, can turn to the cracking of liquified petroleum gases or naphta.
It would require a separate study to go into the question of the competitiveness of the different fuels used in power stations, and this we have not attemp-ted here, since for one thing prices are fixed on the basis of contracts the terms of which remain obscure, and for another market forces are affected by gov-ernmental agreements and actions aimed specifi-cally at the protection of coal.
Two main sectors are considered separately in the report:
(a) industrial usage (not including the iron and steel industry or power stations;
(b) domestic usage (including commerce, cottage industries, central and local government, offices, hospitals, schools and so on.)
2. Champ d'application
Le champ d'application de cette étude se limite aux sources d'énergie substituable, c'est-à-dire à celles pour lesquelles la concurrence de prix a joué. En conséquence, n'ont été considérés ni les carburants, ni le charbon à coke ou le coke sidérurgique, car il s'agit d'emplois spécifiques non substituables dans l'état actuel de la technique. De même, pour les combustibles gazeux, nous n'avons analysé en général que le gaz naturel, seul type de gaz ayant exercé une véritable concurrence, de par son prix et du fait des grandes quantités offertes sur le marché.
Par ailleurs, cette étude se limite aux consommations finales d'énergie, ce qui exclut les usages non éner-gétiques (chimie) et les transformations (usines à gaz et centrales électriques thermiques), bien que des substitutions existent aussi dans ces secteurs, par exemple carbochimie supplantée par la pétro-léochimie ou compétition entre charbon, fuel-oil et gaz dans les centrales électriques polyvalentes, ou encore distillation du charbon remplacée par le craquage du GPL ou du naphta dans les usines à gaz.
La concurrence des combustibles, dans les centrales électriques notamment, exigerait une étude spéciale que nous n'avons pas abordée ici, car d'une part les prix résultent de contrats particuliers dont les termes demeurent mal connus, d'autre part le jeu du marché y est modifié par des accords et des interventions des pouvoirs publics, surtout dans le but de protéger le charbon.
Deux secteurs ont été distingués dans cette étude : (a) l'industrie (sans la sidérurgie ni les centrales
électriques);
3. Equivalent standards of comparison 3. Égalisation des conditions de comparaison To achieve a valid comparison, at least the calorific
values of the different fuels and the output of the installations in which they are used must be taken into account. The calorific values present no diffi culty, since they are sufficiently well known not only for each type of fuel but for different grades of the same type. We have adopted the lower calorific value, since this is closer to the energy used by the consumer (than the higher calorific value).
The thermal capacity of different installations is a much less precise concept, and is difficult to mea sure, since it varies according to the type of instal lation and also according to its length of service, as newer installations are more technically advanced. It is nevertheless possible to adduce, though with all necessary reservations, a scale of values for the effective capacity of the different fuels used in installations in service during the period of the survey:
C = coal : F = fuel oils : G = natural gas
59 to 65 % 62 to 67 % 71 to 73 %
(these percentages do not tally with the theoretical capacities resulting from bench tests).
Pour effectuer une comparaison valable, il faut au moins tenir compte des pouvoirs calorifiques et des rendements des appareils pour les différents combustibles. Les pouvoirs calorifiques ne sou lèvent pas de difficulté ; ils sont connus avec suffi samment de précision pour chaque combustible et même pour chaque qualité de produit. Nous avons utilisé le pouvoir calorifique inférieur (PCI), parce qu'il est plus proche de l'énergie utilisable par le consommateur que le pouvoir calorifique supérieur (PCS).
Le rendement thermique des appareils est une notion beaucoup moins précise, difficile à mesurer et variable selon le type d'installation et selon son âge (effet du progrès technique dans le temps). On peut toutefois avancer, sous toutes réserves, des ordres de grandeur sur le rendement pratique des combustibles dans les appareils en service au cours de la période étudiée :
C = charbon : 59 à 65 % F = fueloils: 62 à 67 % G = gaz naturel : 71 à 73 %
(ces pourcentages diffèrent du rendement théorique obtenu au banc d'essai).
C| I I I
Fi
l i l i
ι
I I I
G I — . — | I I l I I I
55 60 65 70 75
These values show a wide spread for fuel oils and even more for solid fuels, which is due to the lack of uniformity in the installations in use, but it is dif ferent with natural gas, since the installations in which it is used are all more uptodate. With installations of the same length of service it makes little difference to output whether fuel oil or coal is used — a matter of 2 %. We have therefore not taken this factor into account when comparing prices, and such doubts as we may have had were largely dispelled by the fact that there is a similar percentage of error in statistical price listings. If however a more accurate picture is required, with more precise information about capacities in certain cases, it would be possible to make corresponding modifications to the price structure, but this would make little or no difference to the main findings on price relationships, or to the conclusions to be drawn from them.
The position with natural gas is different, since it has a capacity of 7.5 to 10 points, or some 10 to 15 %, higher than that of solid and liquid fuels. This has to be taken into account. But the prices of natural gas listed in the surveys are expressed in terms of higher calorific values, which have to be transposed
Ces valeurs montrent que la dispersion est grande pour les fueloils et encore plus pour les combusti bles solides, en raison du manque d'homogénéité du parc des appareils, ce qui n'est pas le cas pour le gaz naturel dont les équipements sont tous plus modernes. Pour un équipement du même âge, la différence de rendement est faible entre charbon et fueloils, de l'ordre de 2%. Nous avons donc négligé ce facteur dans la comparaison des prix, avec d'autant moins d'hésitation que l'incertitude est du même ordre de grandeur que la précision des relevés statistiques des prix. Cependant, si l'un souhaite atteindre une plus grande exactitude, en disposant de données de rendement plus précises pour certains cas, il est possible de modifier les niveaux de prix en conséquence, mais ceci n'altérera guère les principaux rapports de prix et les conclu sions qui en découlent.
La situation diffère visàvis du gaz naturel dont le rendement dans les appareils est en moyenne de 7,5 à 10 points (soit environ 10 à 15 %) audessus du rendement obtenu avec les combustibles solides ou liquides. Il conviendrait d'en tenir compte. Mais les prix du gaz naturel relevés dans les en
into lower calorific values for purposes of compa-rison with the other sources of energy. The diffe-rence between these two standards of measurement (which varies at different times according to the provenance of the gas) can be said to be between — 7.4 % and — 10 %. Since these two factors are of the same magnitude they operate in opposite directions, and in the interests of avoiding unneces-sary complication they have been assumed to can-cel each other out.
quêtes sont exprimés en pouvoir calorifique supé-rieur, qu'il faut transformer en pouvoir calorifique inférieur pour la comparaison avec les autres sources d'énergie. Or, la différence entre ces deux mesures
(variable dans le temps et dans l'espace selon les gisements) peut être estimée de — 7,4 % à — 10%.
Les deux facteurs ci-dessus sont du même ordre de grandeur et jouent en sens contraire. Dans un but de simplification, on a considéré que leurs effets s'annulaient.
4. The quantitative factor
The present report is not only concerned with es-tablishing series of price margins between the com-peting energy sources, but also considers the effects of such competition on the respective amounts con-sumed. This poses the problem of the degree of interchangeability of the different fuels, and of whe-ther the statistics on consumption should be weeded through in order to rid them of the influence of such extraneous factors as the level of industrial activity or the weather conditions. But since this weeding process calls for complex calculations, and the re-sults never can beone hundred per cent accurate, we have decided against its adoption so as not to over-load the report. We have thought it sufficient in fact to give tables indicating the amounts consumed in the two major sectors (industrial and domestic usage), together with the breakdown for each type of fuel. Since the component elements of weather and in-dustrial activity vary widely their influence should be largely cancelled out by the factor of propor-tionate usage (percentage breakdown).
Naturally, for these two distorting factors to be eli-minated completely it would be necessary for: (a) the climatic equation to apply equally to all
fuels, and
(b) the breakdown of consumption of the different fuels not to be influenced by weather condi-tions or the level of industrial activity.
In practice, we know that these two conditions are not always fulfilled. During spells of intense cold, or at times of booming industrial expansion, the fuels that cost more find a readier market than they do in more normal times. There is in particular a temporary increase in support for coal which is out-side the normal trend.
But as the main purpose of this report is to demon-strate any changes in the main trend, the simplified method employed here would seem to be sufficient.
4. Effets quantitatifs
Cette étude ne se borne pas à présenter des séries d'écarts de prix entre combustibles concurrents, mais elle débouche sur les effets de la concurrence sur les quantités consommées. Ceci pose le pro-blème de l'élasticité de substitution et le propro-blème du filtrage des séries de statistiques de consom-mation pour les débarrasser des autres influences telles que le niveau de l'activité industrielle ou la température. Ce filtrage exige des calculs complexes et conduit à des résultats d'ailleurs imparfaits. Nous y avons renoncé, afin de ne pas trop alourdir cette étude. Nous nous sommes contentés de produire des tableaux donnant les quantités con-sommées dans les deux grands secteurs visés (in-dustrie et foyers domestiques) avec indication de la répartition par combustible. Les composantes climatiques ou d'activité industrielle étant multi-plicatives, le rapport des consommations (% de répartition) devrait les éliminer en grande partie.
Bien entendu, pour éliminer complètement ces facteurs perturbateurs, il faudrait que :
(a) la formule de la composante climatique soit la même pour tous les combustibles ;
(b) le climat ou le niveau d'activité industrielle n'exerce pas d'influence sur la répartition de la consommation entre les différents com-bustibles.
Or, nous savons que ces deux conditions ne sont pas toujours remplies. Pendant les vagues de grand froid ou en période de forte expansion industrielle, les produits les plus chers trouvent plus facilement un débouché qu'au cours des périodes plus nor-males. C'est ainsi que le charbon bénéficie notam-ment de renforcenotam-ments de position passagers qui sortent de la tendance.
Ill — GERMANY (Federal Republic) III ALLEMAGNE (RF)
1. Comparison of oil and coal prices
A — INDUSTRIAL USAGE
Lively competition between solid and liquid fuels was a constant feature of German industrial deve-lopment. It is very important that the real prices and their relationship should be studied; for a long time it was thought sufficient to compare list prices, which gave a false idea of the position, in the ab-sence of a statistical survey bringing out the dis-counts granted to the purchasers.
Apart from basing its findings on the actual purchase prices to consumers, what other standards of com-parison does the report adopt, and what aspects does it exclude ?
In the sections dealing with industry, two activities are left out : iron and steel making, for technical reasons (substitute fuels not available for their spe-cific requirements), and the generation of electricity, for two reasons: on the sales side there is insufficient knowledge about contract terms, and where the authorities are concerned, there are regulations which restrict competition between different fuels. The period covered is from July 1956 — the earliest date of any price listings for fuel oils in Germany — to 1970. It was not possible to ascertain the true prices of fuel oils prior to July 1956, since the quan-tities sold where so slight that no proper market had yet been set up, and statistical listings were point-less.
The fuels selected for this comparative study are as follows:
(a) soft coal (smalls), soft coal (N° 3/4 Nuts) and coke 1/2 the solid fuels in general use; (b) heavy fuel oil (Heizöl Schwer), which accounts
for approximately 70 % of total consumption of liquid fuels in industry.
In the net calorific values scale, soft coal rates 7 000 kcal/kg, coke 6 800 kcal, and heavy fuel oil 9 700 kcal/kg. Putting it another way, 1 386 kg of soft coal or 1 427 kg of coke have to be burnt to obtain the same amount of calories as those obtainable from one metric ton of heavy fuel oil. These quan-tities are therefore taken as the base for comparison, so that the calculations can be made in equivalent calorific values.
Düsseldorf was selected as a suitably representative city for the purpose of comparing prices in industry, since it is in the centre of the most important indus-trial part of Germany, and is close to both coalmines
1. Comparaison des prix pétrole/charbon A — INDUSTRIE
Le développement industriel de l'Allemagne s'est effectué dans un climat de vive concurrence entre combustibles solides et liquides. Aussi, l'intérêt est-il grand d'examiner les rapports de prix réels, alors que pendant longtemps on s'était contenté de comparer les prix de barèmes, qui donnaient une idée inexacte de la situation, faute d'enquête statistique permettant de saisir les rabais accordés aux acheteurs.
Outre le fait de se baser sur les prix réels de marché à la consommation, quelles sont les caractéristiques et les limites de cette comparaison ?
Deux activités sont exclues du secteur industriel : la sidérurgie pour des raisons d'ordre technique (be-soins spécifiques pour ainsi dire non substitua bles), les centrales électriques pour des raisons commer-ciales et réglementaires (souscriptions de contrats dont les termes sont mal connus et intervention des pouvoirs publics limitant la concurrence entre combustibles).
La période couverte va de juillet 1956 — première date de relevés des prix des fuel-oils en Alle-magne — jusqu'à 1970. Il n'a pas été possible en effet de connaître les prix réels des fuel-oils anté-rieurement à juillet 1956, car les quantités vendues étaient alors si ténues que le marché n'était pas encore formé et que les relevés statistiques n'étaient pas significatifs.
Les combustibles choisis pour cette comparaison sont :
(a) d'une part le charbon gras (fines), le charbon gras (noix 3/4) et le coke 1/2, combustibles solides les plus employées ;
(b) d'autre part le fuel-oil lourd (Heizöl schwer), qui représente environ 70 % de l'ensemble des combustibles liquides consommés dans l'industrie.
Les pouvoirs calorifiques inférieurs (PCI) s'élèvent à 7 000 kcal/kg pour les charbons gras, à 6 800 kcal/kg pour le coke et à 9 700 kcal/kg pour le fuel-oil lourd. C'est-à-dire qu'il faut consommer 1 386 kg de charbon gras ou 1 427 kg de coke pour obtenir les mêmes calories qu'à partir d'une tonne de fuel-oil lourd. La comparaison portera donc sur ces quantités, afin de raisonner à équiva-lence de pouvoir calorifique.
On a retenu Dusseldorf comme exemple typique pour la comparaison des prix dans l'industrie car cette ville se trouve au centre de la première région industrielle de l'Allemagne et à proximité des mines
and oil refineries. Comparative figures have also been worked out for other places, for Munich in parti-cular; as the city is a long distance away from any coalmines or oil refineries, the price levels are na-turally higher owing to transport costs, yet on the other hand the relationship between prices for solid and liquid fuels, and the movement of these prices over the years, were found to be similar to their equi-valents in Düsseldorf, so that the same final con-clusions were reached; except that the installation of oil refineries in Bavaria since 1964 — supplied by high capacity pipelines from the terminals at Trieste, Genoa and Marseilles — resulted in lower prices for petroleum products, and consequently made coal less competitive than in Düsseldorf. But in any case all these comparative calculations have not been published, lest the report should be overloaded by an excess of tables.
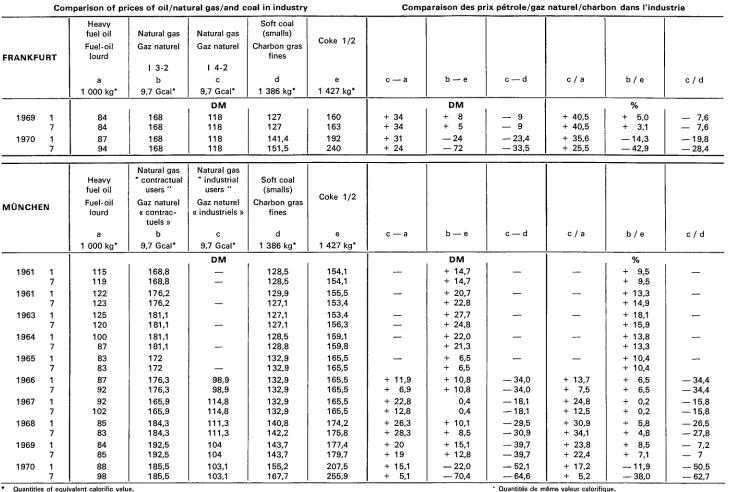
Accordingly, Table N° 1 gives the comparative figures for Düsseldorf, with reference to,
(a) price levels in respect of the quantities men-tioned above;
(b) absolute differences in relation to heavy fuel oil ;
(c) comparative percentage differences worked out in relation to heavy fuel oil.
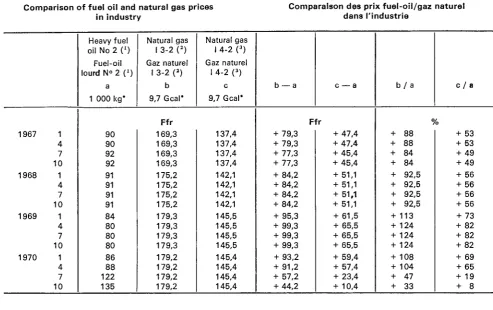
Graph No 1 shows comparative changes in prices in absolute values.
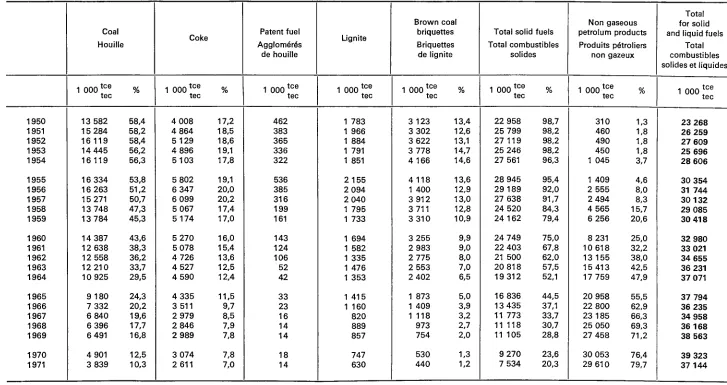
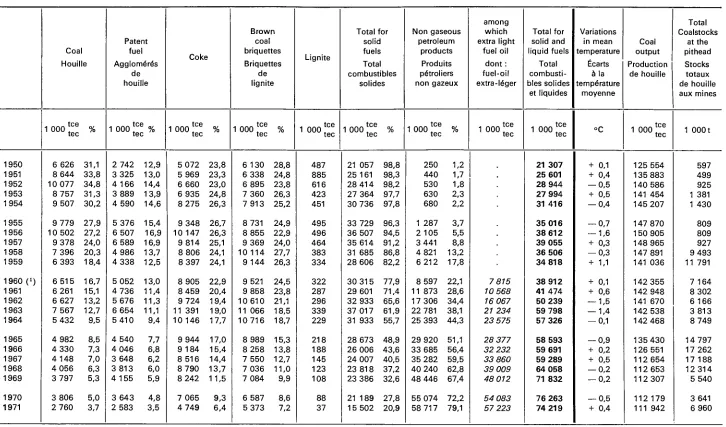
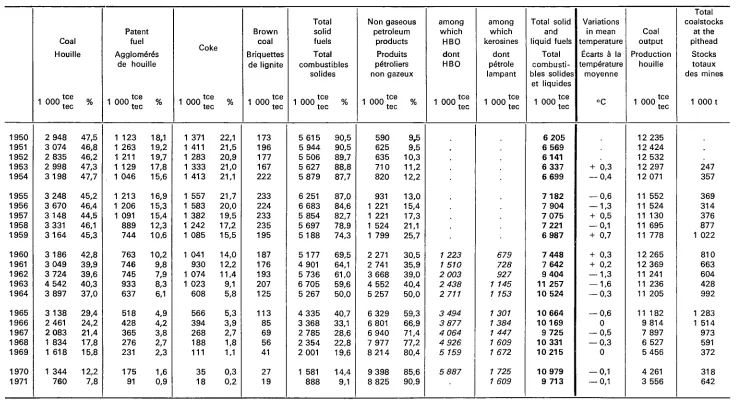
In order to relate the comparative study of prices to other economic data, we show in Table No 2 quan-titative statistics for industrial consumption of the fuels concerned, though over a longer period than in the case of the price statistics, from 1951 to 1971, in order to enable our readers to realize more fully the complete reversal which has taken place in the relative positions of solid and liquid fuels. Two other graphs, Nos 2 and 3, complement this table by showing curves for consumption and for fuels break-down. This statistical apparatus gives rise to a number of observations, the most important of which, in our view, we summarize below.
In the first place, as a general observation, it should be noted that consumption levels for both solid and liquid fuels have been influenced both by the rates of industrial expansion and by comparative price levels.
Graph No 2 indicates clearly that peak consumption levels were reached during periods of rapid growth, as in 1955/56, 1960, 1964/65 and 1968/69, and that at the other end of the scale the troughs occur-red in 1953, 1957/58 and 1967.
Leaving aside fluctuations caused by the general economic situation, it is apparent that the consump-tion of solid fuels was on the increase up to 1956, and that from 1957 on it began to decline.
de houille et des centres de raffinage. Des calculs comparatifs ont également porté sur d'autres places, notamment sur Munich, ville éloignée à la fois des mines de houille et des centres de raffinage, mais si les niveaux de prix y apparaissent évidemment plus élevés en raison des frais de transport, en revanche les rapports de prix entre combustibles solides et liquides et leur évolution dans le temps étaient semblables à ceux observés à Düsseldorf, de sorte que l'on aboutissait aux mêmes conclusions ; à ceci près que l'installation de raffineries en Bavière à partir de 1964 — approvisionnées par des oléoducs de forte capacité au départ de Trieste, Gênes et Marseille — a provoqué des baisses de prix pétroliers, rendant la situation concurrentielle du charbon plus difficile qu'à Düsseldorf. Toutefois, tous ces calculs comparatifs n'ont pas été publiés pour ne pas alourdir cette étude par de trop nombreux tableaux.
Le tableau n° 1 donne les résultats de la comparai-son à Düsseldorf avec indication :
(a) des niveaux de prix pour les quantités signalées plus haut,
(b) des différences absolues par rapport au fuel-oil lourd,
(c) des différences relatives en pourcentages calcu-lés par rapport au fuel-oil lourd.
Un graphique (n° 1) montre l'évolution comparée des prix en valeur absolue.
Afin de lier l'étude comparative des prix aux autres données économiques, on a présenté dans un tableau (n° 2) les statistiques quantitatives de consommation dans l'industrie des combustibles concernés, pour une période d'ailleurs plus large que celle de l'étude de prix, puisqu'elle s'étend de 1950 à 1971 ; ceci pour permettre aux lecteurs de mieux se rendre compte du renversement complet des positions des combustibles solides et liquides. De plus, deux graphiques (nos 2 et 3)
illustrent ce tableau, montrant les courbes de con-sommation, ainsi que les courbes de répartition. Tout cet appareil permet de nombreuses obser-vations, dont nous résumerons ci-après celles qui paraissent essentielles.
En premier lieu, on observe d'un point de vue général que les niveaux de consommation de combustibles solides et liquides subissent à la fois l'influence du taux d'activité industrielle et des niveaux relatifs de prix.
Le graphique n° 2 montre clairement les pointes de consommation dues à des périodes de forte expansion, en 1955/56, 1960, 1964/65, 1968/69; à l'inverse, les années 1953, 1957/58, 1967 mar-quent des creux.
Par-delà ces fluctuations conjoncturelles, il appa-raît que la consommation de combustibles solides croît jusqu'en 1956 et décline à partir de 1957.
Coal and coke prices are seen to be lower than those for heavy fuel oil up to the end of 1957. This was a period marked by rocketing oil prices as a result of the first Suez crisis, by a very limited market in oil, which represented only a tiny part of fuel sales to industry, and by a peak in industrial consumption of solid fuels wich reached its maximum in 1955/56 due to a particularly vigorous rate of expansion.
In 1958, with the consequences of the Suez crisis out of the way, there was a sudden break in the pattern ; fuel oil prices fell abruptly while coal and coke prices rose between 7 and 8 %. From then on coal and coke cost more per calorie than oil. There was an immediate cutback in the consumption of coal and coke, made even sharper by the slow rate of industrial growth at that time. Between 1957 and 1958 the share of non-gaseous petroleum pro-ducts in industrial consumption of solid and liquid fuels jumped from 8.3 to 15.7 %, as is shown clearly by the breakdown curve in Graph No 3. This was the start of the change-over to oil in the industrial sector, a process which was to continue without interruption for the next twelve years. Stockpiles of coal at the pithead rose from 900 000 tonnes to 12 million tonnes between 1957 and 1959. Industry quadrupled its oil consumption in four years. A number of protective measures were then taken : output of coal was cut back from 148 to 112 million tonnes a year ; coal and coke prices were stabilized, and even dropped slightly in 1 9 6 0 ; and a special tax of DM 25 a tonne was levied on heavy fuel oil with effect from May 1960.
Up to the end of 1963 prices of heavy fuel oil re-mained at more or less the same level, whereas soft coal (smalls) was hardly any more expensive, soft coal (medium volatile doubles) was from 9 to 20 % dearer and coke from 30 to 40 % dearer. During this period consumption of coal and coke gradually declined, with the exception of a cyclical peak in 1960, while the share of non-gaseous petroleum products in the solid and liquid fuels market grew steadily larger.
A fresh disruption of the comparative price structure occurred in 1964, when a small rise in the price of coal and coke was accompanied by a substantial fall in the price of heavy fuel oil. All coalmining products ceased to be competitive ; there was a + 32 % difference in the price of soft coal (medium volatile doubles) and one of + 58 % in the price of semi-bituminous coke, calculated in equivalent calo-rific values. Consumption of coal products fell immediately, and there was a dramatic increase in the size of the stockpile at the pitheads, which by 1966 exceeded 17 million tonnes; and coal out-put, which had remained surprisingly stable at 142
Or, les prix de la houille et du coke restent infé-rieurs à ceux du fuel-oil lourd jusqu'à fin 1957. Cette période est caractérisée par la première crise de Suez qui a provoqué une flambée des prix pétroliers, par un marché pétrolier marginal repré-sentant une faible part des ventes aux industries, par l'apogée des consommations de combustibles solides dans l'industrie avec un sommet en 1955/56 sous l'effet d'un taux d'expansion particulièrement vigoureux.
En 1958, se produit une rupture ; une fois dissipées les séquelles de la crise de Suez, les prix du fuel-oil lourd chutent brutalement tandis que les prix charbonniers accusent des hausses de l'ordre de 7 à 8 %. Désormais la calorie-charbon revient plus cher que la calorie-pétrole. Une contraction de la consommation de coke et de houille se produit immédiatement, accentuée par un faible taux d'expansion industrielle. De 1957 à 1958, la part des produits pétroliers non gazeux dans la con-sommation de combustibles solides et liquides de l'industrie saute de 8,3 à 15,7 %, bond très visible sur la courbe de répartition du graphique n° 3. C'est le début de la conversion de l'industrie aux produits pétroliers, phénomène qui va se poursuivre sans arrêt pendant une douzaine d'années. Les stocks de houille aux mines montent de 0,9 à près de 12 millions de t entre 1957 et 1959. La consom-mation pétrolière de l'industrie quadruple en quatre ans. Diverses mesures de sauvegarde sont alors prises : le rythme de l'extraction de houille est ramené de 148 à 142 millions de t/an ; les prix charbonniers sont stabilisés et baissent même légèrement en 1 9 6 0 ; un impôt spécifique frappe le fuel-oil lourd à compter du 1e r mai 1960 à raison de 25 DM par tonne.
Jusqu'à fin 1963, les prix du fuel-oil lourd se maintiennent à peu près au même niveau pendant que le charbon gras (fines) est à peine plus cher, le charbon gras (noix 3/4) plus cher de 9 à 20 % et le coke plus cher de 30 à 40 %. Durant cette période, la consommation de houille et de coke décroît lentement à l'exception d'une pointe con-joncturelle en 1960, et la part des produits pétroliers non gazeux sur le marché des combustibles solides et liquides s'élargit régulièrement.
Une nouvelle rupture de prix se produit en 1964 : à une légère hausse des prix charbonniers correspond une baisse sensible du fuel-oil lourd. Plus aucune catégorie de houille n'est compétitive ; les écarts de prix s'établissent à + 32 % pour le charbon gras (noix 3/4) et à + 5 8 % pour le coke 1/2, ceci calculé à pouvoir calorifique égal. Aussitôt, la consommation de houille chute, les stocks aux mines s'accroissent dans des proportions dramatiques pour dépasser 17 millions de t en 1966, le rythme d'extraction de houille, qui s'était maintenu au niveau remarquablement stable de 142 millions de t/an depuis 1959, est réduit à 112 millions de t/an
million tonnes a year since 1959, was reduced to 112 million tonnes by pit closures. Between 1964 and 1966, two crisis years for the coal industry, the share of non-gaseous petroleum products in indus-trial consumption rose from 48 % to 63 %, which indicates that a large number of conversions must have taken place. And although subsequently the situation eased a little, the use of coal still continued to decline, even during the second Suez crisis, which did not shake the strong competitive position of petroleum.
The introduction of a 10 % VAT regime, which in-creased to one of 11 % on 1 July 1968, on 1 Jan-uary 1968 was especially damaging for coal. The resulting price increases, coupled with the additional obstacle of a fresh fall in the price of oil after Suez, further impaired the competitive position of coal, though the effects were mitigated or concealed by an industrial boom in 1968 and 1969.
Despite increases in the sale price of coal, and var-ious measures of assistance (the setting up of the ' Notgemeinschaft ' in 1965, subsidized pit closures under the ' Rationalisierungsverband ' scheme, and so on), the financial situation of the collieries con-tinued to deteriorate, aggravated in particular by the cost push of miners' wages ; for example, the wages index rose from 233 points in 1968 to 294 in 1970. In the face of growing losses, and since it was now out of the question that a competitive position could be regained, coal prices were allowed to take their own course. The resulting increases were higher than any in the past; between July 1969 and July 1970, for instance, prices of soft coals rose by 22 and 23 % and semi-bituminous coke rose by 50 %. As a consequence, by mid-1970, in terms of equi-valent calorific value, soft coal (smalls) cost 48 %
more than heavy fuel oil, soft coal (medium volatile doubles) 62 % more, and semi-bituminous coke 138 % more. Consumption registered a further fall, as is clearly shown in Graphs Nos 2 and 3, both in regard to the amounts sold and to the share of the market, which by 1971, for all solid fuels, was redu-ced to 20 % of all solid and liquid fuels used in in-dustry. This period represents the end of any real competition between coal and oil. Oil prices, after falling steadily over a long period, could now be increased without any fear of competition from coal.
To sum up this account of the position, there are four distinct stages in the competition between these two sources :
(a) Up to the end of 1957, all categories of coal and coke were cheaper than heavy fuel oil. In these circumstances, fuel oil had little chance of entering the market on a large scale, and its only advantage was that it was simple to use. (b) From 1958 till the end of 1963, in the aftermath of the first Suez crisis, oil was seen to go on the
par des fermetures de sièges. De 1964 à 1966, deux années de crise charbonnière, la part des produits pétroliers non gazeux dans l'industrie monte de 48 à 63 %, prouvant le nombre important des conversions. Et si ce phénomène s'atténue quelque peu par la suite, le déclin du charbon tend à se poursuivre, même pendant la deuxième crise de Suez, qui n'a pas ébranlé la forte position concurren-tielle du pétrole.
Au 1e r janvier 1968, l'instauration de la TVA au
taux de 10 % (porté à 11 % à compter du 1e r juillet
1968) grève particulièrement le charbon. La hausse des prix qui s'ensuit, aggravée par une nouvelle baisse des prix pétroliers après Suez, entraîne encore une détérioration de la position concurrentielle du charbon, dont les effets sont atténués ou masqués par une forte expansion industrielle en 1968 et 1969.
Malgré les hausses de prix de vente et malgré les aides diverses (création de la « Notgemeinschaft » en 1965, primes de fermeture dans le cadre du « Rationalisierungsverband » etc.) la situation finan-cière des charbonnages se dégrade, surtout sous la poussée des salaires dans les mines dont l'indice passe de 233 en 1968 à 294 en 1970 par exemple. Devant les déficits croissants et devant l'imposssi-bilité de renverser la situation concurrentielle, les prix des charbons sont lâchés. Les hausses qui en résultent atteignent des taux jamais égalés dans le passé, entre juillet 1969 et juillet 1970 par exemple + 22 à + 23 % pour les charbons gras et + 50 % pour le coke 1/2. De sorte que, au milieu de 1970, à pouvoir calorifique égal, le charbon gras (fines) est 48 % plus cher que le fuel-oil lourd, le charbon gras (noix 3/4) 62% plus cher et le coke (1/2) 138% plus cher. Les consommations accusent une nouvelle chute, très visible sur les graphiques nos 2 et 3, tant en ce qui concerne les quantités
vendues que la part sur le marché, celle-ci se ré-duisant même en 1971 pour l'ensemble des com-bustibles solides à 20 % du total des comcom-bustibles solides et liquides consommés dans l'industrie. Cette phase traduit la fin de la concurrence charbon-pétrole. Les prix pétroliers, après une longue période de baisse, peuvent augmenter sans craindre de concurrence du côté du charbon.
Pour résumer cet exposé, quatre phases peuvent être distinguées dans cette compétition :
(a) jusqu'à fin 1957, toutes les catégories de houille et de coke sont moins chères que le fuel-oil lourd. Dans ces conditions, le fuel-oil a peu de chance d'envahir massivement le marché, son seul atout résidant dans sa facilité d'emploi ;
(b) de 1958 à fin 1963, au lendemain de la 1r e crise
de Suez, on assiste à une première offensive
offensive for the first time ; heavy fuel oil be-came competitive, though as yet the difference was not decisive because of official measures in support of coal.
(c) Between 1964 and 1969, it became clear that measures in support of coal were weakening, and there was a resultant rise in the price of coal, accompanied by a lowering of prices for heavy fuel oil. Coal ceased to be competitive, and industrial conversion to liquid fuels took place on an extensive scale.
(d) From 1970 on a new phase began, in which coal prices reached new peaks and petroleum to a large extent supplanted its competitor.
The door was wide open for an increase in the price of heavy fuel oil and hence increased profit margins. But this was the moment for the appearance of na-tural gas as a competitor, where the conditions are very different. This aspect will be examined sepa-rately in the following chapter.
pétrolière ; le fuel-oil lourd devient compétitif, mais la différence n'est pas décisive, par suite de mesures et d'interventions officielles qui sou-tiennent le charbon ;
(c) de 1964 à 1969, l'essoufflement des mesures de soutien au charbon devient évident ; il s'ensuit une hausse des prix charbonniers, à laquelle répond une baisse des prix du fuel-oil lourd. Le charbon n'est plus compétitif et la conversion de l'industrie aux combustibles liquides s'effectue sur une grande échelle ; (d) à partir de 1970, une nouvelle phase commence ;
les prix charbonniers décrochent vers des sommets et le pétrole a largement supplanté son concurrent.
Une vaste marge de manœuvre s'est formée, de sorte que les prix du fuel-oil lourd ont la possibilité d'aug-menter afin de devenir plus rémunérateurs. Mais, pen-dant ce temps, s'annonce la période de la concur-rence du gaz naturel, dont les conditions sont toutefois très différentes, et qui sera examinée séparément dans un chapitre suivant.
TABLE 1 TABLEAU
Deutschland (BR) : Düsseldorf
Comparison of oil and coal prices in industry Comparaison des prix pétrole/charbon dans l'industrie
1956 7 1957 1 7 1958 1 7 1959 1 7 1960 1 7 1961 1 7 1962 1 7 1963 1 7 1964 1 7 1965 1 7 1966 1 7 1967 1 7 1968 1 7 1969 1 7 1970 1 7 Heavy fuel oil Fuel-oil lourd a 1 000 kg*
Soft coal (Smalls) Charbon gras (Fines) b 1 386 k g '
Soft coal N ° 3 / 4 (Nuts) Charbon
gras (Noix 3/4)
c 1 386 kg*
Coke 1/2 Coke
1/2
d 1 427 kg'
D M 115,0 159,0 129,0 93,0 97,0 97,0 95,0 70,0 90,0 81,0 85,0 87,0 87,0 91,0 90,0 86,0 80,0 76,0 76,0 76,0 80,0 81,0 90,0 80,0 78,0 77,0 75,0 81,0 89,0 84,7 87,6 90,2 96,4 96,6 96,6 94,5 94,5 92,4 92,4 92,4 92,4 93,7 93,7 93,7 95,1 95,2 98,5 98,5 99,4 100,7 100,7 100,7 105,7 106,7 106,7 106,7 118,3 131,4 93,8 96,6 99,2 105,5 105,6 105,6 106,3 103,5 101,4 101,4 101,4 101,4 103,0 103,0 103,0 105,7 105,9 110,0 109,3 109,3 110,0 110,0 110,7 116,4 117,5 117,5 117,5 130,5 143,7 110,3 115,0 118,4 128,5 128,4 127,7 125,5 118,4 117,0 117,0 117,0 118,2 120,3 120,3 123,9 126,7 126,7 128,4 129,8 128,4 129,8 129,8 132,7 139,7 140,9 141,5 141,5 166,9 212,0
b — a c — a d — a
D M — 30,3 — 71,4 — 38,8 3,4 — 0,4 — 0,4 — 0,5 24,5 2,4 11,4 7,4 5,4 6,7 2,7 3,7 9,1 15,2 22,5 22,5 23,4 20,7 19,7 10,7 25,7 28,7 29,7 31,7 37,3 42,4 — 21,2 — 62,4 — 29,8 12,5 8,6 8,6 11,3 33,5 11,4 20,4 16,4 14,4 16,0 12,0 13,0 19,7 25,9 34,0 33,3 33,3 30,0 29,0 20,7 36,4 39,5 40,5 42,5 49,5 54,7 — 4,7 — 44,0 — 10,6 35,5 31,4 30,7 30,5 48,4 27,0 36,0 32,0 31,2 33,3 29,3 33,9 40,7 46,7 52,4 53,8 52,4 49,8 48,8 42,7 59,7 62,9 64,5 66,5 85,9 123,0
b / a c / a d / a
% — 26,3 — 44,9 — 30,1 3,7 — 0,4 — 0,4 — 0,5 35,0 2,7 14,1 8,7 6,2 7,7 3,0 4,1 10,6 19,0 29,6 29,6 30,8 25,9 24,3 11,9 32,1 36,8 38,6 42,3 46,0 47,6 — 18,4 — 39,2 — 23,1 13,4 8,9 8,9 11,9 47,9 12,7 25,2 19,3 16,6 18,4 13,2 14,4 22,9 32,4 44,7 43,8 43,8 37,5 35,8 23,0 45,5 50,6 52,6 56,7 61,1 61,5 — 4,1 — 27,7 — 8,2 38,2 32,4 31,6 32,1 69,1 30,0 44,4 37,6 35,9 38,3 32,2 37,7 47,3 58,4 68,9 70,8 68,9 62,3 60,2 47,4 74,6 80,6 83,8 88,7 106,0 138,2
Quantities of equivalent calorific value. Quantités de mSrne valeur calorifique.
Comparison of oll and coal prices In industry
Comparaison des prix pétrole/charbon dans l'industrie
D E U T S C H L A N D DÜSSELDORF
D M
400 380 360
o4t)
30Ö
¿o\)
¿4U
ZOO
160
1.40
9Ω
Λ
1
1955 1 19567
' ,
. » « ■ '
, · '
Si
1
■»»«.
, .
■ · "
1
ez 1
19577
c o i sto
^ S
/C
\ ¿
* \
» * *
1
ilstoc ckage
'Λ .
Γ
I■ i M M
(—— ■
19587
[S s de 1
— »
— M ri
1
touille
— « «
. «
1959 7 ^
>«■„
ol In
1
M ■ _ .
r A
taxe pots
I 9 6 07
___
■ " ^
, f ·
i l é t r o l
1
_ _
M ——j
m ~"
ers
1961
__
· · —■ "■ ™ ■
1
~m*
■ ™
1962 — ■
1
1963
— '
1
1964 stoc
» · "
„ . · » ■
1
:kages
• • » ι
. .
1965
. d e h jullie
► - - I » · ·
1 . . . 1
» » " ■
1966 ι · » Ι
■ • M
1
F
* <
■ « ·■
1967
^ · » »
. . . I I I »*"
. * ■ ·
ζ 2
T Í A
1
1968 1
' —
ƒ / / ƒ /
~T
_ . ' - > ' .... ." ..
>0
±^r.^-1969
S
1 1970
s o u coai smaiis
TABLE 2 TABLEAU
Deutschland (BR)
Consumption of solid and liquid fuels in industry
(excluding electric power stations and iron and steel)
Consommation de combustibles solides et liquides dans l'industrie
(sans centrales électriques ni sidérurgie)
1950 1951 1952 1953 1954 1955 1956 1957 1958 1959 1960 1961 1962 1963 1964 1965 1966 1967 1968 1969 1970 1971 Coal Houille
1 000 t c e
tec 13 582 15 284 16119 14 445 16119 16 334 16 263 15 271 13 748 13 784 14 387 12 638 12 558 12210 10 925 9 180 7 332 6 840 6 396 6 491 4 901 3 839 % 58,4 58,2 58,4 56,2 56,3 53,8 51,2 50,7 47,3 45,3 43,6 38,3 36,2 33,7 29,5 24,3 20,2 19,6 17,7 16,8 12,5 10,3 Coke
1 0 0 0t c e
tec 4 008 4 864 5 129 4 896 5 103 5 802 6 347 6 099 5 067 5 174 5 270 5 078 4 726 4 527 4 590 4 335 3 511 2 979 2 846 2 989 3 074 2 611 % 17,2 18,5 18,6 19,1 17,8 19,1 20,0 20,2 17,4 17,0 16,0 15,4 13,6 12,5 12,4 11,5 9,7 8,5 7,9 7,8 7,8 7,0 Patent fuel Agglomérés de houille
1 000 t c e
tec 462 383 365 336 322 536 385 316 199 161 143 124 106 52 42 33 23 16 14 14 18 14 Lignite
1 000 t c e
tec 1 783 1 966 1 884 1 791 1 851 2 155 2 094 2 040 1 795 1 733 1 694 1 582 1 335 1 476 1 353 1 415 1 160 820 889 857 747 630 Brown coal briquettes Briquettes de lignite
1 000 t c e %
tec
3 123 13,4 3 302 12,6 3 622 13,1 3 778 14,7 4 166 14,6 4 118 13,6 1 400 12,9 3 912 13,0 3 711 12,8 3 310 10,9 3 255 9,9 2 983 9,0 2 775 8,0 2 553 7,0 2 402 6,5 1 873 5,0 1 409 3,9 1 118 3,2 973 2,7 754 2,0 530 1,3 440 1,2
Total solid fuels Total combustibles
solides
1 000 t c e %
tec
22 958 98,7 25 799 98,2 27 119 98,2 25 246 98,2 27 561 96,3 28 945 95,4 29 189 92,0 27 638 91,7 24 520 84,3 24 162 79,4 24 749 75,0 22 403 67,8 21 500 62,0 20 818 57,5 19 312 52,1 16 836 44,5 13 435 37,1 11 773 33,7 11118 30,7 11 105 28,8 9 270 23,6 7 534 20,3
Non gaseous petrolum products Produits pétroliers
non gazeux
1 000 t c e %
tec
310 1,3 460 1,8 490 1,8 450 1,8 1 045 3,7 1 409 4,6 2 555 8,0 2 494 8,3 4 565 15,7 6 256 20,6 8 231 25,0 10 618 32,2 13 155 38,0 15 413 42,5 17 759 47,9 20 958 55,5 22 800 62,9 23 185 66,3 25 050 69,3 27 458 71,2 30 053 76,4 29 610 79,7
Total for solid and liquid fuels
Total combustibles solides et liquides
1 000 t c e
tec
23 268 26 259 27 609
25 696 28 606 30 354 31 744 30 132
29 085 30 418 32 980 33 021 34 655
36 231 37 071 37 794
36 235 34 958 36 168 38 563 39 323
DEUTSCHLAND
Consumption of solid and liquid fuels in industry (cumulative curves)
Breakdown of consumption of solid and liquid fuels in industry
Répartition de la consommation de combustibles solides et liquides dans l'industrie
DEUTSCHLAND
break-up of price structure rupture des prix
break-up of price structure rupture des prix
break-up of price structure rupture des prix
non pre
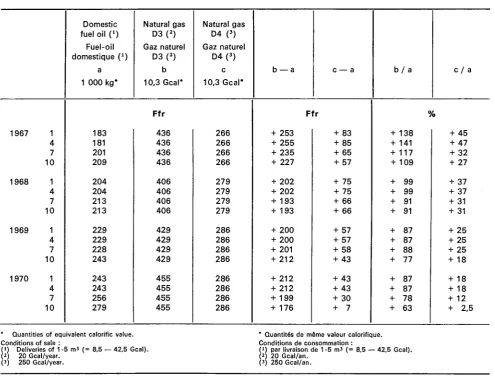
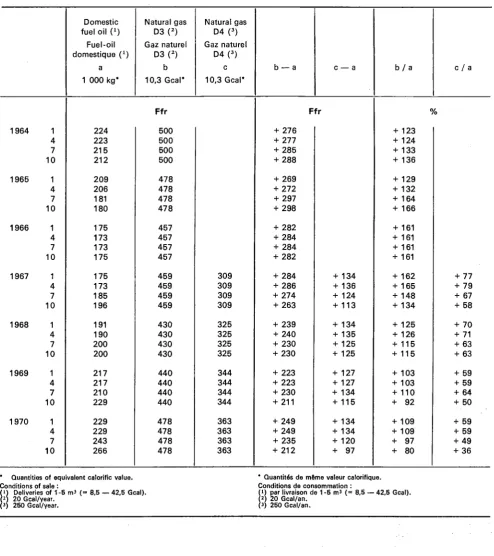
Β — DOMESTIC USAGE Β — FOYERS DOMESTIQUES
The position ¡η the domestic sector is not as clearly defined as it is in industry, but the general picture remains much the same.
We should say first of all that consumption in the domestic sector, of both solid and liquid fuels, ex ceeds industrial consumption, excluding that in the iron a steel industry or in power stations) and that the excess becomes more marked in the course of the period under review.
It follows that any change in market conditions as a result of price changes must have important reper cussions on the economic status of coal.
Dans le secteur des foyers domestiques, la situation apparaît moins clairement que dans l'industrie, mais la ligne générale reste similaire.
Signalons tout de suite que le niveau de consom mation des foyers domestiques en combustibles solides et liquides dépasse celui des industries, mis à part la sidérurgie et les centrales électriques, et se développe même davantage au cours de la période étudiée.
Il en ressort que toute modification du marché sous l'influence des prix se répercutera fortement sur l'économie charbonnière.
Consumption in the domestic sector is not only very large, but it also embraces a greater variety of dif ferent types of fuel product, which makes compa rison more difficult.
Si la consommation du secteur domestique est importante, elle porte aussi sur une plus grande variété de produits, ce qui complique la compa raison.
In view of this, the substances selected as a basis for comparison are as follows :
(a) for coal products, No 3 anthracite nuts, anthra cite ovoids, No 3 coke and lignite briquettes (feinkorn lang), which provide a good coverage of the range of consumption;
(b) for petroleum products, extralight fuel oil, which represents more than 95 % of total con sumption of liquid fuels in the domestic sector.
Since all of these fuels have a different calorific va lue, respective quantities must be obtained giving the same calorific value to avoid misleading price comparisons ; the values are equated as follows :
Dans cette perspective, les éléments choisis pour cette comparaison sont les suivants :
(a) pour le charbon, l'anthracite noix 3, les boulets d'anthracite, le coke 3, les briquettes de lignite (Feinkorn lang), catégories qui couvrent bien l'éventail des consommations ;
(b) pour le pétrole, le fueloil extraléger qui représente plus de 95 % de la consommation des combustibles liquides dans le secteur des foyers domestiques.
Tous ces combustibles ayant des pouvoirs calo rifiques assez différents, il convient d'égaliser les quantités calorifiques pour ne pas fausser la com paraison des prix, égalisation basée sur les chiffres ciaprès :
Extralight fuel oil Fueloil extraléger
Anthracite No 3 nuts
Anthracite noix 3
Anthracite ovoids Boulets d'anthracite
No 3 coke Coke 3
Lignite briquettes Briquettes de lignite (Feinkorn
lang) Net calorific value kcal/kg
Pouvoir calorifique kcal (PCI)/kg Quantities of equivalent calorific value Quantités de même valeur calorifique
10 000
1 000 kg
7 500 1 333 kg
7 500
1 333 kg
6 800 1 470 kg
4 800 2 083 kg
For practical purposes, we have compared the price of 1 333 kg of anthracite and the price of 1 410 kg of coke etc., with the price of 1 000 kg of extra light fuel oil, which is taken as the base. In other words, the prices shown are equated to the pur chase price of 10 Gcal.
Dans un but pratique, on a donc comparé le prix de 1 333 kg d'anthracite (noix ou boulets), de 1 470 kg de coke, etc., au prix de 1 000 kg de fueloil extraléger, pris comme base. Autrement dit, les prix indiqués correspondent à l'achat de 10 Gcal.