A STUDY ON QUALITY OF LIFE (QOL)
IN PATIENTS WITH SCHIZOPHRENIA
DISSERTATION SUBMITTED FOR PARTIAL FULFILLMENT
OF THE RULES AND REGULATIONS
DOCTOR OF MEDICINE
BRANCH - XVIII (PSYCHIATRY)
THE TAMILNADU DR.MGR MEDICAL UNIVERSITY,
CHENNAI,
TAMIL NADU.
CERTIFICATE
This is to certify that the dissertation titled, “A STUDY ON QUALITY OF LIFE IN PATIENTS WITH SCHIZOPHRENIA” is the bonafide work of Dr. SUBASHINI. S, in part fulfillment of the requirements for the M.D. Branch – XVIII (Psychiatry) examination of The Tamilnadu Dr. M. G. R. Medical University, to be held in April 2016. The period of study was from July 2015 – Sep 2015.
The Director, The Dean,
DECLARATION
I, Dr. SUBASHINI. S, solemnly declare that the dissertation titled,
“A STUDY ON QUALITY OF LIFE (QOL) IN PATIENTS WITH
SCHIZOPHRENIA” is a bonafide work done by myself at the Madras Medical College, Chennai, during the period from July 2015 - Sep 2015 under the guidance and supervision of Prof. Dr. JEYAPRAKASH R. MD, DPM, Professor of Psychiatry, Madras Medical College. The dissertation is submitted to The Tamilnadu Dr. M. G. R. Medical University towards part fulfilment for M.D. Branch XVIII (Psychiatry) examination.
Place:
Date: Dr. SUBASHINI. S
ACKNOWLEDGEMENTS
With gratitude, I sincerely thank Professor Dr. Jeyaprakash R, MD, DPM, Director, Institute of Mental Health, Chennai, for his constant guidance and support.
I acknowledge and thank Professor Dr. Vimala R, MD, Dean, Madras Medical College, Chennai, for permitting me to utilise the institutional and academic resources .
I thank my co-guide Dr. Sharon Joe Daniel MD Assistant Professor for his encouragement and support. With deep gratitude I sincerely thank all my Senior Professors, Associate Professors and Assistant Professors of Institute of Mental health, for their constant cooperation and enthusiastic encouragement.
I profoundly thank the statisticians Mr.Padmanaban, ICMR, KMC and Mr.Srinivasan ICMR, TB Research Institute, Chetpet.for analysis and support.
I acknowledge the help and support rendered by my batch colleagues, and also my seniors and juniors towards smooth conduct and coordination of the study.
TABLE OF CONTENTS
Sl.No TOPIC Page No
1. INTRODUCTION 1
2. REVIEW OF LITERATURE 5
3. AIMS AND OBJECTIVES 30
4. HYPOTHESIS 31
5. METHODOLOGY 33
6. RESULTS 45
7. DISCUSSION 77
8. CONCLUSION 91
9. LIMITATIONS 92
10. RECOMMENDATIONS 93
11. BIBLIOGRAPHY 94
INTRODUCTION
Psychological health issues have become a topic of concern over the past years and have found an important place in policy agendas all over the world. Global Estimates found that this burden will raise several fold over the next few decades. World Health Organization points out that, apart from the number of people with mental illness, all of the following factors measure the suffering.
their isolation,
the productivity that is lost,
the hindrance to the human development and the brake on society in general
To the individual, the mental disorder causes a massive disruption to their lives impairing quality of life and posing a burden to their caregivers.
and increased number of hospitalizations (Almond et al.2004). The economic implications of the disease extend beyond the use of health and personal social services to its morbidity and mortality implications as well as its impact on the quality of life of patients and their families. Many people with schizophrenia experience stigma caused by other people's knowledge, attitudes, and behavior; this can lead to impoverishment, social marginalization, and low quality of life (Thornicroft et al. 2009).
Quality of life has emerged as the ideal of modern medicine viewed from a biopsychosocial perspective. The concept has been increasingly used as an important attribute in patient care and clinical studies as well as the basis in many health economic evaluations. The quality of life individuals in general population was found to be greater than that of individuals with schizophrenia (Lehman et al, 1982; Evans et al. 2007; Gupta et al. 1998; Bobes & Carcia-Portilla 2006;Bengtsson-Tops & Hansson 1999; Ponizovsky et al. 2003). Thus, enhancing the quality of life of such patients has become imperative and has been included in all international clinical guidelines .
quality of life and prognosis of disease. Evaluation of patient’s quality of life can help a lot in improving quality of care in Schizophrenic patients.
The commonly used and complete definition of quality of life was given by WHO quality of life Group (1995) where it was defined,- “as individuals' perception of their position in life in the context of the culture and value systems in which they live and in relation to their goals, expectations, standards and concerns”. Another rather simple and informal definition of QOL was provided by Lehman (1996), “as patients' perspective on
what they have,
how they are doing and
how they feel about their life circumstances”.
importance to social relations and finances among the factors the influenced quality of life.
REVIEW OF LITERATURE
Defining Quality of life
Multiple definitions are available for quality of life, which makes it difficult to measure and use in research. As a disorder is found to alter the biological self, the psyche, the social integrity and the economic wellbeing of an individual, the definition should include all these , at the same time delineating each one of them. Hence it is necessary to determine specific aspects of QOL that is affected by various diseases and treatment. A definition of QOL must be equally relevant to both general population and to all defined population subgroups. Over the last few decades, lots of definitions have been framed- most of them from theoretical, focusing on psychological issues like wellbeing and life satisfaction to issues relating to standard of living. (Awad and Voruganti, 2012)
WHO definition
The WHO defines QOL as “an individual’s perception of their position in life in the context of the culture and value systems in which
they live, and in relation to their goals, expectations, standards and
Definition by Friedman
“QOL can be defined by a combination of joy, peace, love, and self esteem.”
Definition in relation to the comprehensive quality of life scale(Cummins,1997)
“Quality of life is both objective and subjective, each axis being the aggregate of seven domains: material wellbeing, health, productivity, intimacy, safety, community, and emotional wellbeing. Objective domains comprise culturally relevant measures of objective well being. Subjective domains comprise domain satisfaction weighted by their importance to individuals.”
Definition by Campbell et al.(1976)
“Quality of life is a vague and ethereal entity, something that many people talk about but which nobody clearly knows about.”
experience by an individual (WHOQOL Group 1995, Harrison et al. 1996, Haas 1999, Bowling 2003, Moons et al. 2006) .Definition of quality of life given by each individual will thus be unique to their own life (Browne et al. 1997, Fayers & Machin 2007). However, various researchers have arrived at a consensus of defining quality of life as “having a positive psychological outlook and emotional well-being, having good physical and mental health and the physical ability to do the things they want to do, having good relationships with friends and family, participating in social activities and recreation, living in a safe neighborhood with good facilities and services, having enough money and being independent” (Bowling, 2005).
Health related quality of life is another term which emphasis the role of illness and its absence on the wellbeing of self (Danovitch & Endicott 2008). Health was defined by WHO six decades ago, as “a state of complete physical, mental and social well-being and not merely the
absence of disease or infirmity”. It is one of the domains of overall
al. 2006 having a focus on health related quality of life will underestimate the influence of factors that are not medical .Clearly none of the definitions are agreed upon and there is a need to frame definitions for quality of life according to the individuals and region under study, course and stage of the disorder and its treatment ,in relation to social expectations at some point of time.
Though there is no consensus definition for quality of life, certain characteristics of quality of life has to be agreed. Firstly, Quality of life is individual oriented as he is the one who experience and is the final assessor of his life events. Secondly, quality of life is multidimensional and it depends on conceptual, pragmatic and empirical purposes for which it is studied. Thirdly, quality of life changes day to day and has its own individuality i.e., each person perceives his quality of life different from others.
Quality Of Life Assessment
A number of tools exist for assessing quality of life due to lack of conceptual clarity. (Bowling 2003).
First, Quality of life assessment has different focuses namely, Emotional wellbeing
Physical health
Roles And Functioning in society.
Second, the type of instrument also varies (Fayers & Machin 2007) as follows
single-item scales including a single global question, multi-item scales producing a total single score, and multi-item scales producing a profile of items
According to Danovitch & Endicott ,2008,the instruments used in mental health research are usually multi-item scale and include physical domain, psychological domain and social domain.
Third, in health care set up there are two types of Quality of life assessment instruments: disease specific and generic (Dijkers 1999, Hays 2005).
Generic instruments are used across various diseases and disorders and for people without illnesses. They assess the relative load of distress among different illness but it will not assess the specific aspects of quality of life, which is distinct to a certain patient group.
is WHOQOL (The WHOQOL Group, 1994; 1995). It was developed as a multinational, multicenteric and multilingual instrument. It subjectively evaluates the respondent under six broad domains and 24 sub-domains of quality of life.
Dijkers in 1999 and Priebe in 2007 gave two strategies to study quality of life, one is subjective and the other is objective.
The world health organization’s definition of quality of life gives importance to the individual’s perception of their life and reveres the fact that he is the best candidate to assess his quality of life.
As the patients with schizophrenia have a lack of insight and have cognitive impairments the validity of their assessment becomes questionable (Atkinson et al. 1997, Doyle et al. 1999).
On the other end of the tunnel ,the studies done by Voruganti et al. 1998, Naber et al. 2005, Nørholm and Bech 2006 discuss that most of the patients with psychiatric illness are able to assess their quality of life.
According to the review there are numerous instruments to assess quality of life in patients with schizophrenia which differ in form and type. The generic instrument must be apt for collection of data and evidence regarding its psychometric properties and its feasibility should be available.
Quality Of Life Assessment in Mental Health Care
The necessity to assess the quality of life in patients with mental illness arose due to ‘deinstitutionalization’ that is discharge of patients with residual symptoms from institutions into the community. Hence there arose the need for healthcare providers to analyze whether this deinstitutionalization led to increase in life satisfaction of the patients.
Quality Of Life assessment as part of outcome assessment in mental
health care
Quality Of Life In Patients With Schizophrenia
Schizophrenia is a syndrome which is included in the wider spectrum ‘ psychosis’, where there is loss of reality. It is characterized with delusions, hallucinations, irrational thinking and bizarre behavior. Internationally the prevalence of schizophrenia is 0.5 to 1% , and the
incidence rate for a year is 0.5 to5 in 10,000 people. The common age of onset of schizophrenia is in early20s although cases have been reported at ages 5 and 6.As far as gender difference is considered in schizophrenia both male and female are affected equally. However patients with early onset and predominant negative symptoms like withdrawn behavior, lack of expression, disinterest, lack of motivation, not communicative, slow in thoughts and activities are more likely to be male and people with late onset are found to be female characterized with less damage to brain structures.
Demographic profile and the quality of life in patients with
schizophrenia
lower physical health domain scores in respect to quality of life compared to males. Authors attributed the lowered score to discrimination that females with the illness face in Chinese society.
Narvez et al study involved 88 outpatients in United States. Lehman quality of life Interview was used in this study. Study showed that females with late onset of schizophrenia and those with less education had lower quality of life. However, there was no analysis regarding the relation between quality of life, employment and marital status. In Brazil, Quality of life scale was used in a study by Cardoso et al, which involved 123 outpatients. This study revealed that the male gender who were single and had low education level and income had low quality of life. In France, Caron et al .did a study in 143 patients using Satisfaction with Life Domains Scale. It was a two phase study which studied relationship between quality of life, demographic profile, coping skills and stressors within a 6 months interval. Study concluded that relationships that are close would enhance emotional wellbeing and therefore the quality of life.
(2002) examined the connections between quality of life and salaried job in a specimen of 97 outpatients with the disorder by utilizing of the Quality of life interview and Quality of life scale in the United States of America. The study revealed that salary enhanced the quality of life for individuals with schizophrenia. The outcomes demonstrated that an expanded number of days the individuals work had high aggregate QLS scores.
An analysis was done between quality of life, gender and marital status of people with schizophrenia by Salokangas et al(2001) in Finland. In the study, interviews were directed with 1,750 men and 1,506 women subjects with schizophrenia utilizing the Global Appraisal Scale (GAS). The outcomes uncovered that solitary males had a lower quality of life than others in practically all of the measurements, including working environment, every day working, lodging condition, number of partners, furthermore, psychosocial solidness. By and large, females were happier with their personal lives and relationships than males unaffected by their marital status.
Schizophrenia and Quality of life world-wide
survey. The research demonstrated that lesser perceived quality of life was connected with unemployment and poor social backing.
The same Nigerian research uncovered that individuals with schizophrenia saw their quality of life to be poorer than quality of life s in other areas of the world. Nigeria is a region where there is poor services for treatment and rehabilitation, which might have contributed to the poorer quality of life in these individuals.
between the quality of life and demographic qualities for 181 outpatients with schizophrenia. They observed that females appreciated a superior quality of life in the range of activities of living (e.g., arrangements for living and status of working) than males. This can be due to the customary and social components that mandates females to be more included in family exercises and shopping. Be that as it may, in the range of instruction, tertiary-taught members reported higher mental prosperity than those with just an essential training. The scores of social support, personal wellbeing, interpersonal relationships and overall quality of life were found to be higher in people who were employed than those who were unemployed.
Mubarak et a1 (2003) did a study on quality of life of 174 persons with schizophrenia in Penang, Malaysia. The members were evaluated with the Quality of life interview. The study demonstrated that individuals who were with schizophrenia and who had been in deinstitutionalized environment confronted numerous difficulties in their regular lives in the areas of lodging, every day activities, , money, work, social relations and wellbeing. The authors advised the formation of community based rehabilitation offices, which are significant for bringing about group base treatment of individuals in Malaysia.
business, , and family relationships, and quality of life . In Ireland, Browne et al.measured the quality of life in 64 subjects who were going to a rehabilitation focus and looked at the relationship between quality of life and demographic qualities utilizing Quality of Life Scale (QLS). The outcomes uncovered that the members appraised their quality of life at less than half of the maximum score of the Quality of life scale, found to be due to the local norms of the catchment region, as every item of the quality of life scale is scored with respect to standards confined to the specific areas. Nonetheless, there was no clarification given by the authors about those norms that influenced the quality of life of individuals with schizophrenia in Ireland. People who lived individually had increased quality of life than those in hostels.
Quality of life of people with schizophrenia in cross cultural studies
Heider et al (2007) did a longitudinal study to study factors affecting quality of life in 3 countries namely, Germany, France and United kingdom.288 individuals from France,302 from Britain and 618 from Germany were included in the 6 months interval study over 2 years. United Kingdom reported lower quality of living health issues, safety issues, legal issues, accommodation and day to day functioning.
facilities in Riyadh, Irbid and Jordan, Saudi Arabia. The members were requested to fill the schizophrenia Quality of life scale. The same study had been used to study the validity and reliability of the scale in the Arab population.. They studied that about a 25% of patients saw their general wellbeing as fantastic or great; one third lived up to their desires, and the reason for evaluating quality of life high was due to the social support got from relatives. In addition, sexual orientation and marital status were observed not to be associated to quality of life , while work placement furthermore, advanced education levels were emphatically identified with better quality of life .
relationship space. In Canada, ladies reported higher quality of life for social connections on the grounds that they found themselves able to access Canadian health services which permitted them to communicate with others. Conversely, Cuban ladies reported lower quality of life for social connections, they had numerous roles to play like employee, spouse and a caregiver who makes their social relationship constrained.
Factors affecting quality of life in patients with schizophrenia
Psychopathology and illness severity
There is a continuous enthusiasm in studying the effects core symptoms of schizophrenia on quality of life. Almost half of all patients with schizophrenia report a favorable quality of life in spite of the presence of symptoms of psychosis. Various studies, including meta-analyses, found more amounts of global clinical symptoms being associated with less quality of life in patients with schizophrenia (Browne et al, 1996; Heider et al, 2007; Daradkeh et al, 2005; Al Habeeb et al, 1998) For instance, in a latest study in patients with chronic schizophrenia, of the aggregate variance in quality of life, symptoms clarified half and social variables clarified 16%. Multivariate examinations affirmed that particularly less depressive symptoms and greater social relationships essentially predicted a higher quality of life (Preibe et al, 1998). Most socio-demographic variables don't contribute to self-rated quality of life .With the special case that higher rates of quality of life were reliably reported by females when compared with male patients with schizophrenia (Vandiver et al,1998).
recommendations that quality of life scales in patients with schizophrenia may share too much variance with symptoms and in this manner not be a valid independant outcome criterion. However, encourage multivariate analysis by Priebe et al (1998) illustrated that just relationship between changes in depression, anxiety, and hostility were related with changes in quality of life. The authors reasoned that quality of life changes are impacted by symptom change, specifically depression and anxiety, yet the level of impact is most certainly not sufficiently strong to trade off quality of life as an autonomous outcome measure.
in influencing perceived quality of life in individuals with schizophrenia (Ritsner et al, 2014). According to a long term study of over ten years, decrease in depressive symptoms with an increase in self efficacy and social support predicted an improvement in quality of life . In a study conducted by Alonso J, Croudace T, Brown J, et al(2009). 18-month trial, quality of life was best anticipated by anxiety, depression, and self-esteem, and to a lesser degree by global functioning and social integration (Meijer et ai,2009).
Negative symptoms of schizophrenia like emotional withdrawal, lack of spontaneity, lack of abstract thinking and blunted emotions have a serious impact on functioning of individuals in all spheres. It poses a hindrance to everyday activities and social functioning. In a work done by Rabinowit et al (2013) in 1447 patients it was found that presence of negative symptoms was associated with decrease in health utility and expert rated quality of life. This and various studies propose that negative symptoms have a negative correlation with expert rated but not with self rated quality of life .most of the studies suggest to use both self and expert rated instruments to study quality of life.
studies it has been found that symptomatic remission in schizophrenia has resulted in enhanced quality of life.
Docherty et al (2007) studied a group for a year who where on antipsychotic treatment and found that patients who had symptom remission had better subjective quality of life and better approach to treatment than the group who had symptoms.
Another study highlighted that absence of symptom remission in early phase of illness had poorer quality of life (Haynes et al, 2012).
Also early subjective feeling of wellbeing was associate with enduring symptom free periods (De Haan et al,2008).However, the remission criteria does not include the absence of depressive or anxiety symptoms and includes only the core symptoms. It has been found that the individuals who persist to have depressive and anxiety symptoms even after remission from core symptoms have low quality of life (Carpiniello, 1997).
Insight and quality of life
the epitome of schizophrenia. Now there are two schools of thought, one is that people with poorer insight have a better quality of life when compared to people with insight ,This is because in people with greater insight have internal stigmatization of the illness ,depression due to illness realization, reduced self esteem and social withdrawal .
Second school of thought is that due to the link between increased insight and medication adherence, there is early symptom reduction and improved functioning thereby leading to a better quality of life . More comprehensive studies are needed in this arena and socio-demographic profiles have to be incorporated in such studies.
Quality of life and treatment concerns
the quality of life after treatment with SGAs was better when compared to first generation drugs, perhaps due to the lower neuroleptic induced dysphoria with SGAs (Hayhurst et al, 2013).But most of these studies used QLS a scale which studies negative symptoms and patient’s functioning rather than patient’s perspective as defined by the WHO (Harway et al, 2009; Alwad et al, 2013).
Schizophrenia is a chronic mental illness which requires pharmacological treatment for long periods. In addition to the treatment patients has to suffer the side effects that the drugs produce in the individuals (Fakhoury et al., 2001), which as often as possible result in an early stopping or changing of prescription (Lieberman et al., CATIE-study 2005; Kahn et al., 2008; Ücok and Gaebel, 2008). Over the past 30 years there have been several studies which have reported the ill effects of these drugs on the individual’s satisfaction with life and self.(e.g., Voruganti, 1997). Studies by Naber, 1998; Voruganti et al., 2002; Hofer et al., 2004 all point out to the fact that adverse effects due to the antipsychotics is one of the determinants for the perceived quality of life.
Disability and quality of life
psychiatric disorders as well which is known as psychiatric or psychosocial disability. Anthony et.al., recommended that a comprehension of psychiatric disability ought to be derived from the deficiencies that impact the living, learning and workplaces of a person. Liberman additionally underscored that inabilities ought to be measured and assessed in a social setting.
Ronald, Anton and Hans reasoned that disability is connected with schizophrenia, as other psychiatric issue. Chaves et al. found that men had greater handicap than females; however they reported no distinctions in social role execution between the sexes. Interestingly, an Indian study by Radha et al.reported that ladies were more incapacitated than men, which was a direct result of the prevalent social conditions.
Perceived social support and quality of life in patients with
schizophrenia
requirements for community relations are not available to individuals with schizophrenia in psychological health settings.
In addition, individuals with schizophrenia have little, poor- interpersonal relationship constituting mostly of relatives (Brunt & Hansson, 2002). This absence of social communities in psychologically unwell patients may add to symptoms, which in turn lead to decreased quality of life.
Past studies have shown that increased social backing can enhance the QOL of persons with schizophrenia ( Yanos et al., 2001; Nelson et al., 1995). Social support acts to support the effect of distressing encounters, for example, those identified with physical wellbeing (Swindells et al., 1999).
AIMS AND OBJECTIVES OF THE STUDY
The main purpose of this study was to evaluate the quality of
life in patients with schizophrenia in Indian population.
AIM
1) To determine the quality of life in patients with schizophrenia
2) To compare it with individuals without mental illness in general population.
HYPOTHESIS
1. Quality of life of patients with schizophrenia is lower than
quality of life of individuals without mental illness.
2. Quality of life of patients with schizophrenia is influenced by
demographic factors, clinical profile, psychopathology, insight,
disability antipsychotics side effects and social support.
The Research Questions are
a. How patients rate their quality of life in different domains?
b. How each domain influences the patients overall quality of life?
c. How it differs from that of people with schizophrenia?
d. What are the effects of different age groups on the quality of life?
e. What are the effects of gender on quality of life?
f. What are the effects of marital status on quality of life?
g. What are the effects of education on quality of life?
h. What are the effects of employment on quality of life ?
i. What are the effects of religion on quality of life?
k. Does phase of the illness affect the quality of life?
l. Does duration of treatment and number of hospitalizations have an effect on quality of life?
m. Are there any differences among the perceived quality of life among different subtypes of schizophrenia?
n. How positive syndrome affect quality of life?
o. How negative syndrome affect quality of life?
p. How general psychopathological symptoms affect quality of life?
q. How depressive symptoms affect quality of life?
r. Does the presence or absence of insight affect the quality of life?
s. Does disability affect the perceived quality of life in patients with schizophrenia?
t. Do unwanted effects of antipsychotic drugs have an effect on quality of life?
u. Does perceived social support have an effect on quality of life?
METHODOLOGY
ETHICAL CONSIDERATIONS
The study methodology and validated tools were scrutinized by the institutional ethics committee following the academic regulations of Dr.MGR medical university.Ethics committee approval was granted in the month of July 2015 to conduct the research in Institute Of Mental Health of Madras Medical College. The ethical committee approval document is enclosed in the appendix.
Nature and point of the study, voluntary participation, the
capacity to pull back from study, secrecy and security of the patient’s
information, stockpiling and production of the information, and the advantages of the research were disclosed in writing with the potential participants.
STUDY DESIGN, SETTING AND SAMPLE
The study was a Cross sectional Case control study performed in Institute of Mental health.
SAMPLING
group of individuals. This technique would help the researcher to get specific and relevant information about the quality of life for the group of people with schizophrenia. It was a purposive, judgmental and non random selection procedure.
STUDY GROUP
The 50 subjects for the study group were selected from the patients attending the outpatient department of Institute of mental health. The study was conducted from July 2015 to September 2015. The members of the study group fulfilled the inclusion and exclusion criteria as follows
Inclusion criteria
1. Subjects diagnosed to have schizophrenia according to ICD-10 criteria belonging to all subtypes.
2. Subjects of either sex between age group 18-45 years.
3. Subjects who were willing to participate, after an informed consent.
Exclusion criteria
CONTROL GROUP
The 50 subjects for the control group were selected from the attendees of other mental disorders patients coming to Institution of mental health. The study was conducted from July to September 2015.The subjects of the control group fulfilled the inclusion and exclusion criteria.
Inclusion criteria
1. Subjects of either sex between the age groups 18-45 years.
2. Subjects willing to participate in the study.
Exclusion criteria
1. Subjects with any mental disorder.
2. Subjects with other medical conditions.
3. Subjects with neurological disorders.
TOOLS
Semi structured interview schedule: The schedule was developed for the study to collect data regarding the following
1. Socio demographic details
a. Duration of illness
b. Phase of the illness
c. Number of hospitalizations
d. Family history of illness
e. Duration of treatment
World health organization-quality of life (WHOQOL-BREF)
questionnaire to evaluate the quality of life.
Positive and negative syndrome scale (PANSS) to assess psychopathology in patients with schizophrenia.
Calgray depression scale for schizophrenia (CDSS) to assess depression in patients
Beck’s cognitive insight scale to assess insight in patients with schizophrenia.
WHODAS-II scale is administered to evaluate disability due to the illness
Social support questionnaire for assessing perceived social support in patients with schizophrenia.
DESCRIPTION OF INSTRUMENTS
WHOQOL-BREF
WHOQOL-100 is the scale that was developed from field trial data. WHOQOL-BREF is the short version of the WHOQOL-100. WHOQOL-BREF is a 26 item questionnaire. It includes two benchmark questions one for overall quality of life and the other for overall health. The scores are transformed on a scale from 0 to 100 to enable comparisons to be made between domains composed of unequal numbers of items. The domains and its components are-
1. Physical health
i. Activities of daily living
ii. Dependence on medicinal substances and medical aids iii. Energy and fatigue
iv. Mobility
2. Psychological
i. Bodily image and appearance
ii. Negative feelings
iii. Positive feelings
iv. Self-esteem
v. Spirituality / Religion / Personal beliefs
vi. Thinking, learning, memory and concentration
3. Social relationships
i. Personal relationships
ii. Social support
iii. Sexual activity
4. Environment
i. Financial resources
ii. Freedom, physical safety and security
iii. Health and social care: accessibility and quality
iv. Home environment
vi. Participation in and opportunities for recreation / leisure activities
vii. Physical environment (pollution / noise / traffic / climate)
viii. Transport
POSITIVE AND NEGATIVE SYNDROME SCALE FOR
SCHIZOPHRENIA (PANSS)
This is a 30m item semi structured interview. It is used to assess the positive, negative and general psychopathology symptoms. It has 7 items for positive symptoms, 7 items under negative symptoms domain and 16 items under general psychopathology domain. It is scored relying on information of the past week, on a 0-6 point continuum. Kay et al.(1987) developed this instrument. The psychometric estimates showed Cronbach’s alpha of 0.809 and 0.931for internal consistency and reliability.
CALGARY DEPRESSION RATING SCALE FOR
SCHIZOPHRENIA (CDSS)
observable item. It is rated in a scale of 0-3.Scores more than 6 indicate the existence of depression. The scale has a Cronbach’s alpha of 0.79.
BECK’S COGNITIVE INSIGHT SCALE
Beck Cognitive Insight Scale (BCIS) (Beck et al., 2004) was created to assess how people with psychosis realize their own thinking procedures, convictions and judgments. It was developed by Beck et al. in 2004...It is a 15 item scale with subscales of self reflectiveness and self certainty. Self reflectiveness subscale has 9 items and self certainty has 6 items. The items are rated in a 4 point scale ranging from do not agree to completely agree. The self certainty domain has score ranging from 1-18 and gives us information about the patient’s certainty about self and their resistance to correction. The self reflectiveness subscale carries scores from 0-27 and measures the expression introspection and willingness to acknowledge fallibility.
UKU SIDE EFFECT RATING SCALE
is rated on 0-3 point continuum. Psychometric properties of the scale have high Cronbach’s alpha.
WORLD HEALTH ORGANIZATION DISABILITY
ASSESSMENT SCHEDULE-II (WHODAS-II)
To assess the disability of an individual irrespective of the disease or disorder WHO developed an instrument WHODAS-II (2000).It is based on the information regarding the past 30 days. Domains included are
Understanding and communicating, Involvement in society
Socialization and mobility, Life activities
Relationship with others, Self care,
SOCIAL SUPPORT QUESTIONNAIRE (SSQ)
The social support scale used is the one developed by Pollack and Harris, 1998.It measures the perceived social support. The 27 item scale has included
o Information related to support, assistance, concern, disapproval or reinforcement that an individual receives from working colleagues, one's family, friends and social acquaintances.
o If the scores are higher it indicates that the social support is higher.
The psychometric properties for this scale are very satisfactory .
It is designed to be of use where perceived social support is needed as dependant or independent factor.
PROCEDURE
The information regarding the study and the procedure were given to each patient and control and an informed consent was obtained.
The Disease-related characteristics i.e duration of the disease, family history of disease, duration of treatment, number of hospitalization were collected from the patients using the schedule.
WHOQOL-BREF scale was administered to both patients and individuals without mental illness to assess their quality of life.
Positive and negative syndrome scale (PANSS) was administered to evaluate the symptoms in the patients with schizophrenia.
Calgary depressive rating scale was administered to evaluate the presence of depression in the patients.
Beck cognitive insight scale was administered to evaluate insight about illness.
WHODAS-II was administered to evaluate disability due to the illness
UKU side effects scale was administered to evaluate unwanted effects of antipsychotics.
ANALYSIS OF DATA
All the data obtained were entered in the Microsoft Office Excel sheets to prepare the Master Charts for the entire sample size.
Normal distribution of the data of the individual groups was checked.
The sociodemographic details were analyzed using the descriptive statistics.
RESULTS
A. Sample characteristics
1. Age and sex distribution
Most of the patients with schizophrenia in the study group were in the age group 36-45 years. (Table.2). There were more females than males (Table 2).
2. Marital Status
There were 23 married subjects and 21 subjects who were never married.6 subjects were separated or widowed.
3. Socio economic status
82% of the subjects in study group belonged to the low socioeconomic status.
4. Education
38% of the subjects had no formal education,30% had below high school,12% had high school and 8% had higher secondary education. None of the subjects were graduates.
5. Occupation
B. Disease characteristics in the study group
1. Duration of illness
Of the 50 subjects, 25 had the illness in the range 5 to 10 years which accounts for 50%.36 percent of the subjects had illness for less than 5 years and 14% had the illness for more than 10 years.
2. Family history
50% of the subjects had family history.
3. Phase of the illness
For 28% of the subjects this was the first episode of the illness. Among the rest who were in subsequent episodes 17% of the
Duration of illness
subjects were in active phase, 30% were in remission and 8% were in relapse phase of the illness which is illustrated as follows.
4. Duration of treatment and number of hospitalizations
68% of subjects have had treatment for less than 5 years and 32%for more than 5 years. 39 subjects had less than 5 hospitalizations and 11 of them had more than 5.
5. Subtype of schizophrenia
37 (74%) subjects had paranoid subtype, 2(4%) had catatonic, 1(2%) was hebephrenic and 10 (20%) had other type of schizophrenia
Phase of illness
Table 2-Distribution of socio demographic profile of study and control group
Variable Schizophrenia N=50,f %
Control N=50,f% Age in years
18-25 10 (20) 13(26)
26-35 13 (26) 17(34)
36-45 27 (54) 20(40)
Sex
Male 23 (46) 20(40)
Female 27 (54) 30(60)
Marital status
Never married 21 (42) 23(46)
Married 23 (46) 22(44)
Separated/widowed 6 (12) 5(10)
Education
No education 19 (38) 11(22)
Below high school 15 (30) 11(22)
High school 12 (24) 16(32)
Higher secondary 4 (8) 12(24)
Occupation
Unemployed 41 (82) 23(46)
Employed
9 (18) 27(54)
Socio economic status
Low 41 (82) 35(70)
Middle 9 (18) 15(30)
Religion
Hindu 39 (78) 31(62)
Christian 9 (18) 15(30)
0 10 20 30
cases controls
Age Distribution
18-25 26-35 36-45
0 10 20 30
cases controls
Sex distribution
male female
0 5 10 15 20
CASES CONTROLS
Education
higher secondary
high school
Table 3 Distribution of clinical profile of study population
Variable Schizophrenia N=50,f %
Duration of illness –in years
< 5 18 (36)
5 - 10 25 (50)
>10 7 (14)
Phase of illness
First episode 14 (28)
Active 17 (34)
Remission 15 (30)
Relapse 4 (8)
Family history in years
yes 25 (50)
no 25 (50)
Duration of treatment in years
<5 34 (68)
>5 16 (32)
Number of hospitalizations
<5 39 (78)
>5 11 (22)
Subtype of schizophrenia
Paranoid 37 (74)
Catatonic 2 (4)
Hebephrenic 1 (2)
GROUP CHARACTERISTICS OF THE QUALITY OF LIFE OF STUDY AND CONTROL GROUP
Table 4-Mean Of The Qol Domains Among Cases And Controls
N Mean Std. Deviation
Std. Error Mean QUESTION
1
cases 50 2.94 .890 .126
controls 50 3.88 .627 .089 QUESTION
2
cases 50 2.78 1.055 .149 controls 50 3.90 .931 .132 PHYSICAL
DOMAIN
cases 50 38.4998 17.86859 2.52700 controls 50 67.2140 10.91163 1.54314 PSYCHOL
OGICAL DOMAIN
cases 50 41.6670 19.52573 2.76135 controls 50 70.4160 12.32139 1.74251 SOCIAL
DOMAIN
cases 50 28.4992 19.63999 2.77751 controls 50 65.1660 15.76522 2.22954 ENVIRON
MENTAL DOMAIN
cases 50 40.5648 18.11710 2.56215 controls 50 68.1276 13.57019 1.91911
found to be lower than the mean scores of control population with 67.2, 70.4, 65.1 and 68.1 respectively.
INDEPENDENT SAMPLES ‘T’ TEST FOR SIGNIFICANCE IN
VARIATIONS BETWEEN THE GROUPS
The significance value in the Levene’s test of variances is all greater than 0.05 which shows that the variability in the two groups is about the same except for physical and environmental domains. This means that variability in the two domains is not significant.
29.4 27.8
38.5 41.7
28.4
40.5 38.8 39
67.2 70.4 65.1 68.12
COMPARISON OF QUALITY OF LIFE
Table 5-Independent Samples Test-Variation between groups Variables
Levene's Test t-test for Equality of Means
F Sig. t df Sig.
Q1 Equal variances
assumed 1.855 .176 -6.104 98 .000
Q2 Equal variances
assumed .775 .381 -5.626 98 .000
PHYS Equal variances
assumed 3.989 .049 -9.698 98 .000
PSYCH Equal variances
assumed 1.813 .181 -8.805 98 .000
SOCIAL Equal variances
assumed .219 .641 -10.295 98 .000
ENVIR Equal variances
assumed 4.873 .030 -8.610 98 .000
ROC-RECEIVER OPERATING CHARACTERISTICS PLOT
Table 6 ROC Curve-statistics
Variables
Area under curve
P value Youden
index Cutoff value
Q1 0.798 <0.0001 0.54 3
Q2 0.781 <0.0001 0.54 3
physical 0.924 <0.0001 0.84 50
psychological 0.914 <0.0001 0.76 54
social 0.898 <0.0001 0.80 33.3
environmental 0.885 <0.0001 0.72 56.2
QUESTION1
0 20 40 60 80 100
0 20 40 60 80 100
100-Specificity
S
e
n
sitiv
ity
The receiver operating characteristics curves were created to find the ability of the different “quality of life” domains score in recognizing people with schizophrenia from those without. The table shows different results of the ROC plot for the different domains.
Accuracy is measured by the area under the ROC curve. An area of 1 represents a perfect test; an area of .5 represents a worthless test. The area under curve for all the test ranges from 0.781 to 0.924, which shows that all the domains have the ability to predict the patients with schizophrenia in our sample. Moreover the level of significance for the area under curve is found to be <0.0001, which means it is statistically significant. A rough guide for classifying the accuracy of a diagnostic test is the traditional academic point system:
.90-1 = excellent
.80-.90 = good
.70-.80 = fair
.60-.70 = poor
.50-.60 = fail
is in the range of 0.70-0.85 which means the various domain scores has the ability to differentiate people with schizophrenia.
The cut off score for question one is 3, for question 2 is 3, for physical domain is 50, for psychological domain is 54, for social domain is 33.33, for environmental domain is 56.2. Hence it is concluded that the social domain score has greater specificity than other domains.
SOCIAL
0
20
40
60
80
100
0
20
40
60
80
100
100-Specificity
S
e
n
sit
iv
ity
ANALYSIS OF AGE VERSUS QUALITY OF LIFE DOMAINS
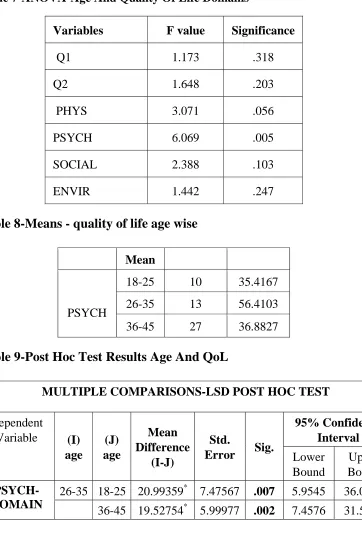
Table 7-ANOVA-Age And Quality Of Life Domains
Variables F value Significance
Q1 1.173 .318
Q2 1.648 .203
PHYS 3.071 .056
PSYCH 6.069 .005
SOCIAL 2.388 .103
ENVIR 1.442 .247
Table 8-Means - quality of life age wise
Mean
PSYCH
18-25 10 35.4167 26-35 13 56.4103 36-45 27 36.8827 Table 9-Post Hoc Test Results Age And QoL
MULTIPLE COMPARISONS-LSD POST HOC TEST
Dependent
Variable (I)
age (J) age Mean Difference (I-J) Std.
Error Sig.
95% Confidence Interval Lower Bound Upper Bound PSYCH-DOMAIN
26-35 18-25 20.99359* 7.47567 .007 5.9545 36.0327 36-45 19.52754* 5.99977 .002 7.4576 31.5975
[image:64.612.192.455.116.309.2]psychological domain which showed significant difference among the groups. The age group between 26-35 showed greater variation when compared to age groups 18-25 and 36-45.
There was a statistically significant difference between groups in psychological domain as determined by one-way ANOVA (F(2,27) = 6.069, p = .005). A LSD post-hoc test revealed that the psychological quality of life was statistically significantly higher in the age groups 26-35 when compared to age groups 18-25 and 36-45.
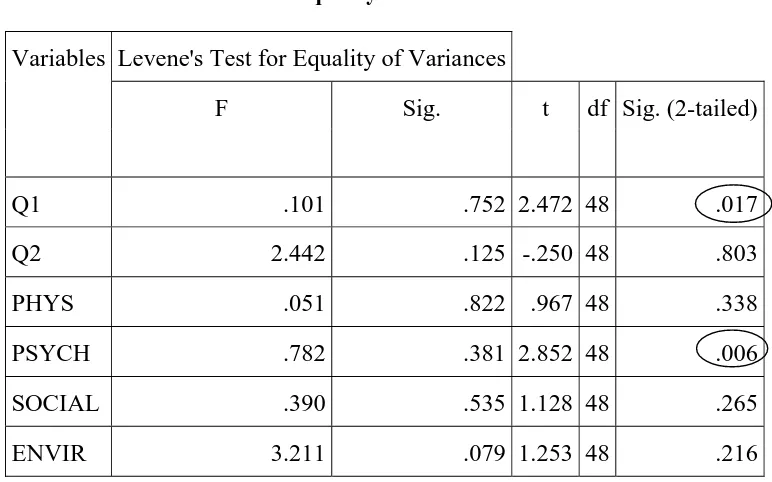
[image:65.612.131.517.365.606.2]GENDER AND QUALITY OF LIFE
Table-10 GENDER –‘t’ test for equality of means
The group descriptive statistics reveal that the male gender has higher mean values for all domains of quality of life. The p value of significance in the Levene’s equality of variances is more than 0.05 for
Variables Levene's Test for Equality of Variances
F Sig. t df Sig. (2-tailed)
Q1 .101 .752 2.472 48 .017
Q2 2.442 .125 -.250 48 .803
PHYS .051 .822 .967 48 .338
PSYCH .782 .381 2.852 48 .006
SOCIAL .390 .535 1.128 48 .265
all six domains. Thus there is no difference in variability in the two groups. In the ‘t’ test for significance (2 tailed) of mean differences the domain Q1 has a p value of 0.017 and the psychological domain has a p value of 0.003, both of which are less than 0.05 which is statistically significant. Because of this we conclude that the male gender has a higher overall quality of life and the psychological quality of life is also
[image:66.612.157.486.327.660.2]high in males.
Table 11-Means-Qol In Gender
Variables sex N Mean
Q1
male 23 3.26
female 27 2.67
Q2
male 23 2.74
female 27 2.81
PHYS male 23 41.1491
female 27 36.2434
PSYCH
male 23 49.6377
female 27 34.8765
SOCIAL male 23 31.8841
female 27 25.6173
ENVIR
male 23 44.0217
SOCIO ECONOMIC STATUS AND QUALITY OF LIFE
Table 12 Means Qol In Socioeconomic Status
Variables Socio economic status N Mean
Q1 low 41 2.78
middle 9 3.67
Q2 low 41 2.66
middle 9 3.33
PHYS low 41 36.9338
middle 9 45.6349
PSYCH low 41 39.5325
middle 9 51.3889
SOCIAL low 41 22.1545
middle 9 57.4074
ENVIR low 41 37.3476
middle 9 55.2083
Table 13- student t Test –Qol And Socio Economic Status
Variables
Levene's Test for
Equality of Variances T test for equality of means
F Sig. t df Sig.
(2-tailed)
Q1 Equal variances
assumed 4.727 .035 -2.902 48 .006
Q2
Equal variances
assumed 2.593 .114 -1.775 48 .082
Equal variances
not assumed -1.448 9.949 .178
PHYS Equal variances
assumed 7.426 .009 -1.333 48 .189
PSYCH Equal variances
assumed 57.160 .000 -1.680 48 .099
SOCIAL Equal variances
assumed 24.478 .000 -6.727 48 .000
ENVIR Equal variances
assumed 10.952 .002 -2.869 48 .006
[image:67.612.131.520.401.646.2]domains have higher means in the middle socioeconomic group than in the low socioeconomic group. An analysis of how much socioeconomic status influences the quality of life in patients with schizophrenia was done, the Levene’s test for equality of variances showed p values of >0.05 hence we conclude that there is no difference in variability in the groups. The significance (two tailed) in the t test was found to be less than 0.05 for the Q1, social domain and environmental domains .Thus we can conclude that patients with low socioeconomic status have poorer quality of life.
EDUCATION AND QUALITY OF LIFE DOMAINS
Table 14 Means-Qol and Education
Education Q1 Q2 PHYS PSYCH SOCIAL ENVIR
No Education 2.79 2.53 29.6992 37.7193 25.4386 32.2368 Below High
School 2.53 2.20 37.8571 35.5556 22.7778 38.5417 High School 3.17 3.33 41.9643 39.5833 27.7778 45.0521
Higher Secondary 4.50 4.50 72.3214 89.5833 66.6667 74.2188
[image:68.612.121.526.384.563.2]Total 2.94 2.78 38.5000 41.6667 28.5000 40.5625
Table 15-ANOVA-Education and Quality of life domains
Variables F value significance
Q1 7.957 .000
Q2 10.179 .000
PHYS 10.058 .000
PSYCH 18.019 .000
SOCIAL 8.041 .000
On performing Analysis Of Variance between the different education levels and quality of life, the statistical result showed statistically significant variations among all the different education levels. There was a statistically significant difference between groups in all domains as determined by one-way ANOVA. A LSD post-hoc test revealed that the group with higher secondary education had higher quality of life when compared to other groups which were statistically significant with all p values <0.05 for all domains.
Table 16-Education and Quality of Life Domains-Post Hoc
LSD-post hoc comparison Mean
difference significance
Q1
Higher secondary
No education 1.711* .000
Below high school 1.967* .000
High school 1.333* .003
Q2
Higher secondary
No education 1.974* .000
Below high school 2.300* .000
High school 1.167* .021
PHYS
Higher secondary
No education 42.62218* .000 Below high school 34.46429* .000
High school 30.35714* .001
PSYCH
Higher secondary
No education 51.86404* .000 Below high school 54.02778* .000
High school 50.00000* .000
SOCIAL
Higher secondary
No education 41.22807* .000 Below high school 43.88889* .000
High school 38.88889* .000
ENVIR
Higher secondary
No education 41.98191* .000 Below high school 35.67708* .000
EMPLOYMENT AND QUALITY OF LIFE
Table 17-Means –Quality Of Life And Employment
Variables Occupation N Mean
Q1 Unemployed 41 2.83
Employed 9 3.44
Q2 Unemployed 41 2.61
Employed 9 3.56
PHYS Unemployed 41 35.6272
Employed 9 51.5873
PSYCH Unemployed 41 38.3130
Employed 9 56.9444
SOCIAL Unemployed 41 23.1707
Employed 9 52.7778
ENVIR Unemployed 41 38.1098
Employed 9 51.7361
Table 18-Individual Samples‘t’ Test -Employment
Levene's Test for Equality of Variances
F Sig. t df Sig. (2-tailed)
Q1 5.883 .019 -1.929 48 .060
Q2 2.278 .138 -2.570 48 .013
PHYS 3.578 .065 -2.560 48 .014
PSYCH 28.597 .000 -2.762 48 .008
SOCIAL 18.422 .000 -4.998 48 .000
ENVIR 10.819 .002 -2.114 48 .040
[image:70.612.148.492.443.601.2]statistically significant. From the descriptive statistics we found that the mean scores of the group that is employed are higher than that of those who are unemployed. Thus, we conclude that the quality of life is higher in patients who are employed.
Thus, we conclude that the quality of life is higher in patients who are employed than the unemployed.
MARITAL STATUS AND QUALITY OF LIFE
Table 19-Mean-Qol And Marital Status
Marital status Q1 Q2 PHYS PSYCH SOCIAL ENVIR
Never married 3.05 2.76 43.0272 46.6270 28.9683 44.0476 Married 3.00 3.00 35.4037 42.2101 27.5362 40.6250
Separated/widowed 2.33 2.00 34.5238 22.2222 30.5556 28.1250
[image:71.612.121.526.327.584.2]Total 2.94 2.78 38.5000 41.6667 28.5000 40.5625
Table 20-
ANOVA –Marital status and QUALITY OF LIFE psychological domain
Sum of
Squares df
Mean
Square F Sig.
PSYCH
Between Groups 2792.012 2 1396.006 4.130 .022 Within Groups 15888.544 47 338.054
Table 21-Marital Status-Post Hoc Comparison
Dependent
Variable (I) marital status
(J) marital
status
Mean Difference
(I-J)
significance
PSYCH-domain
Widowed/separated
never
married -24.40476* .006
married -19.98792* .022
On comparing the mean scores of various QUALITY OF LIFE domains for groups with different marital status, the group which is widowed/separated has the lowest scores. On performing analysis of variance significant difference was found only with the psychological domain, which was confirmed by the post hoc test. Thus we can conclude that the group which was divorced or widowed had a lower quality of life especially the psychological domain which was statistically significant.
[image:72.612.122.526.92.203.2]DURATION OF ILLNESS AND QUALITY OF LIFE
Table 22-Mean-Qol And Duration Of Illness
Duration Of Illness
Q1 Q2 PHYS PSYCH SOCIA L
ENVIR
Table 23-Anova- Qol And Duration Of Illness
ANOVA
Variables Sum of
Squares
df Mean Square
F Sig.
Q1 Between Groups 3.412 2 1.706 2.264 .115 Within Groups 35.408 47 .753
Q2 Between Groups 2.207 2 1.103 .990 .379 Within Groups 52.373 47 1.114
PHYS Between Groups 1614.541 2 807.270 2.704 .077 Within Groups 14030.612 47 298.524
PSYC H
Between Groups 1331.570 2 665.785 1.804 .176 Within Groups 17348.986 47 369.127
SOCIA L
Between Groups 4083.951 2 2041.975 6.477 .003 Within Groups 14817.438 47 315.265
ENVIR Between Groups 896.487 2 448.244 1.387 .260 Within Groups 15187.302 47 323.134
Table 24-Post Hoc –Duration of Illness
Dependent Variable (I) duration of illness (J) duration of illness Mean Difference (I-J) Std.
Error Sig.
SOCIAL 5-10 yrs <5 yrs -15.98148* 5.48865 .005 >10 yrs -22.00000* 7.59265 .006
[image:73.612.129.521.382.495.2]PHASE OF ILLNESS AND QUALITY OF LIFE
Table 25-Mean- Phase Of Illness And Quality Of Life
Phase of illness
Q1 Q2 PHYS PSYCH SOCIA L
ENVIR
First episode 3.14 3.00 43.3673 52.9762 39.2857 51.5625
Active illness 2.82 2.71 36.3445 33.3333 23.0392 30.5147
Remission 3.07 2.87 39.2857 44.7222 26.1111 45.6250
Relapse 2.25 2.00 27.6786 26.0417 22.9167 25.7813
Total 2.94 2.78 38.5000 41.6667 28.5000 40.5625
Table 26-ANOVA Phase Of Illness And Quality Of Life
Variables Sum of
Squares
df Mean Square
F Sig.
Q1 Between Groups 2.952 3 .984 1.262 .299 Within Groups 35.868 46 .780
Q2 Between Groups 3.317 3 1.106 .992 .405 Within Groups 51.263 46 1.114
PHYS Between Groups 888.331 3 296.110 .923 .437 Within Groups 14756.822 46 320.800
PSYCH Between Groups 4087.839 3 1362.613 4.295 .009 Within Groups 14592.717 46 317.233
SOCIAL Between Groups 2345.882 3 781.961 2.173 .104 Within Groups 16555.507 46 359.902
[image:74.612.121.524.390.686.2]CHART DEPICTING PHASE OF ILLNESS AND QUALITY OF LIFE
-Table 27-POST HOC TEST-
Phase of Illness and Quality of Life
Dependent Variable
(I) phase of illness
(j) phase of illness
Mean Difference
(I-J) Sig.
PSYCH First episode Relapse 26.93452
*
.011 First episode -19.64286* .004
ENVIR
First episode Active illness 21.04779
*
.001 Relapse 25.78125* .006
Active illness First episode -21.04779
*
.001 Remission -15.11029* .009 SOCIAL First episode Active illness 16.24650* .022
Although in the descriptive table the mean score are lower for the group in the relapse it was not found to be statistically significant. There was statistical difference between the groups only in the psychological, environmental and social domains.
43.4 36.3 39.3 27.6 52.2 33.3 44.7 26.04 39.2 23.03 26.1 22.9 51.5 30.5 45.6 25.7 0 20 40 60 80 100 120 140 160 180 200
FIRST EPISODE ACTIVE ILLNESS
REMISSION RELAPSE
Q
O
L
PHASE OF SCHIZOPHRENIA
ENVIRONMENTAL SOCIAL
[image:75.612.125.538.82.348.2]FAMILY HISTORY AND QUALITY OF LIFE
Table 28-Means- Family History And Quality Of Life
family h/o N Mean
Q1 yes 25 3.20
no 25 2.68
Q2 yes 25 3.00
no 25 2.56
PHYS yes 25 33.8571
no 25 43.1429
PSYCH yes 25 43.6667
no 25 39.6667
SOCIA L
yes 25 30.0000
no 25 27.0000
ENVIR yes 25 44.2500
no 25 36.8750
Table 29-t test- Family History And Quality Of Life
Variables Levene's Test for Equality of Variances
F Sig. t df Sig. (2-tailed)
Q1 10.815 .002 2.140 48 .057
Q2 .566 .455 1.492 48 .142
PHYS 5.475 .023 -1.885 48 .066 PSYCH 4.434 .040 .721 48 .475 SOCIAL 2.556 .116 .536 48 .594 ENVIR 1.085 .303 1.456 48 .152
[image:76.612.168.479.391.600.2]QUALITY OF LIFE AND PSYCHOPATHOLOGICAL SYMPTOMS
Table 30-Descriptive Statistics- Psychopathological Symptoms
Variables Mean Std. Deviation N
Positive symptoms 15.9600 9.31963 50 Negative symptoms 12.6600 10.80931 50 General
psychopathology 29.0200 19.84788 50
Table 31-Pearson correlation-QoL and psychopathology Variables Q1 Q2 PHY
S
PSYCH SOCIAL ENVIR
Positive symptoms
Pearson
Correlation .374** .202 .178 .265 .248 .178 Sig. (2-tailed) .008 .159 .215 .062 .083 .217
Negative symptoms
Pearson
Correlation -.036 -.300* -.253 -.379** -.066 -.354* Sig. (2-tailed) .803 .034 .076 .007 .647 .012 General
Psycho pathological
symptoms
Pearson
Correlation .239 .059 -.026 -.093 .177 -.047 Sig. (2-tailed) .094 .686 .859 .522 .220 .745
QUALITY OF LIFE AND DEPRESSION
Table 32-Correlation-Qol And Depression
Variables
C1 C2 C3 C4 C5 C6 C7 C8 C9 CDSS
total Q1 Pearson Correlatio n -.447* *
-.485** -.300* -.238 -.116 -.328* -.428** -.469** -.466** -.558**
Sig.
(2-tailed) .001 .000 .035 .096 .424 .020 .002 .001 .001 .000
Q2 Pearson Correlatio n -.389* *
-.451** -.095 -.188 .142 -.223 -.349* -.558**
-.166 -.399**
Sig.
(2-tailed) .005 .001 .513 .192 .324 .119 .013 .000 .249 .004
PHYS
Pearson Correlatio n
-.246 -.206 -.064 -.126 -.056 -.072 -.140 .046 -.179 -.183
Sig.
(2-tailed) .085 .152 .660 .382 .698 .619 .334 .752 .214 .203
PSYCH Pearson Correlatio n -.593* * -.336 *
-.217 -.291* -.161 -.555** -.548** -.422** -.500** -.614**
Sig.
(2-tailed) .000 .017 .131 .041 .264 .000 .000 .002 .000 .000
SOCIAL
Pearson Correlatio n
-.008 -.127 -.081 .064 -.091 .102 .023 -.222 -.028 -.057
Sig.
(2-tailed) .959 .381 .576 .657 .529 .480 .876 .121 .847 .694
ENVIR
Pearson Correlatio n
-.357* -.006 -.124 -.177 .015 -.243 -.362
** -.177 -.192 -.276
Sig.
(2-tailed) .011 .965 .390 .219 .919 .089 .010 .220 .182 .052
**. Correlation is significant at the 0.01 level (2-tailed). *. Correlation is significant at the 0.05 level (2-tailed).
environmental domain. The maximum negative correlation is found between total depression score and question 1 of the WHOQOL BREF.
[image:79.612.125.519.209.487.2]QUALITY OF LIFE AND COGNITIVE INSIGHT
Table 33-Correlation Between Quality Of Life And Cognitive Insight
Variables Q1 Q2 PHYS PSYCH SOCIAL ENVIR
Self
reflectiveness
Pearson
Correlation .446 **
.511** .115 .304* .515** .371**
Sig.
(2-tailed) .001 .000 .428 .032 .000 .008
N 50 50 50 50 50 50
Self certainty
Pearson
Correlation .467 **
.523** .330* .367** .694** .450**
Sig.
(2-tailed) .001 .000 .019 .009 .000 .001
N 50 50 50 50 50 50
Insight
Pearson
Correlation -.043 -.056 -.350 *
-.084 -.313* -.099
Sig.
(2-tailed) .769 .701 .013 .560 .027 .495
N 50 50 50 50 50 50
QUALITY OF LIFE AND DISABILITY SCORE
Table 34-Correlation-Quality of Life and Disability
Variables Q1 Q2 PHYS PSYCH SOCIA
L ENVIR
Who Disability score
Pearson
Correlation -.205 -.479
**
-.153 -.527** -.246 -.496**
Sig.
(2-tailed) .153 .000 .289 .000 .085 .000
Pearson correlation analysis between the WHO disability score and the various domains of quality of life showed a very strong negative correlation between them. Maximum was found in the health and the environment domain.
[image:80.612.121.527.118.252.2]QUALITY OF LIFE AND SIDE EFFECTS
Table 35-Correlation-Quality Of Life And Antipsychotic side effect
Variables Q1 Q2 PHYS PSYCH SOCIAL ENVIR
UKU
Pearson
Correlation -.129 -.137 -.480
**
-.423** -.436** -.403** Sig. (2-tailed) .374 .343 .000 .002 .002 .004
N 50 50 50 50 50 50
QUALITY OF LIFE AND PERCEIVED SOCIAL SUPPORT
Table 36-Correlation-Quality of Life And perceived social support
Variables Q1 Q2 PHYS PSYCH SOCIAL ENVIR
SSQ
Pearson
Correlation .211 .256 .034 .145 -.121 .204 Sig. (2-tailed) .141 .073 .817 .316 .403 .156
N 50 50 50 50 50 50
There was no significant correlation found between the perceived social support and perceived quality of life in this study.
[image:81.612.128.554.312.695.2]MULTIPLE REGRESSION ANALYSIS Table 37-FOR dependant variable Q1
Model Unstandardized
Coefficients
Standardized
Coefficients t Sig.