University of Southern Queensland
Faculty of Engineering & Surveying
Tensile strength of sawdust reinforced phenolic resin
composite materials
A dissertation submitted by
Shashi Shekhar
In fulfilment of the requirements of
Courses ENG4111 and 4112 Research Project
towards the degree of
Bachelor of Engineering (Mechanical)
Abstract
The basic aim of this project is to study the tensile strength properties of sawdust reinforced phenolic resin composites.
The phenolic resin composite materials with sawdust as filler are tested for tensile strength, where sawdust composition is varied from 5% -15% by weight. Also, three different grain sizes of sawdust were used simultaneously: 1.18mm, 300 microns and 425 microns. The composite is made from: Resin- Hexion Cellobond J2027L, Catalyst- Hexion Phencat 15 & Sawdust.
Earlier project works have covered phenolic resin composites with other filler materials such as glass powder, slg, etc. and/or for studying other properties such as flexural strength of sawdust reinforced resin composites. This project comprising the study of the sawdust reinforced composites for tensile strength properties would enable us to further understand detailed behaviour of phenolic composites.
University of Southern Queensland
Faculty of Engineering and Surveying
ENG 4111 & 4112 Research Project
Limitations of Use
The Council of the University of Southern Queensland, its Faculty of Engineering and Surveying, and the staff of the University of Southern Queensland, do not accept any responsibility for the truth, accuracy and completeness of material contained within or associated with this dissertation.
Persons using all or any part of this material do so at their own risk, and not at the risk of the Council of the University of Southern Queensland, its Faculty of Engineering and Surveying or the staff of the University of Southern Queensland.
This dissertation reports an education exercise and has no purpose or validity beyond this exercise. The sole purpose of the course “Project and Dissertation” is to contribute to the overall education within the student’s chosen program. This document, the associated hardware, software, drawings and other material set out in the associated appendices should not be used for any other purpose: if they are so used, it is entirely at the risk of the user.
Prof Frank Bullen
Dean
Certification
I certify that the ideas, designs and experimental work, results, analyses and conclusions set out in this dissertation are entirely my own effort, expect where otherwise indicated and acknowledged.
I further certify that the work is original and not been previously submitted for assessment in any other course or institution, expect where specifically stated.
Shashi Shekhar
Student Number: 0050069475
Acknowledgements
I take this opportunity to sincerely and deeply express my gratitude to my project supervisor, Dr. Harry Ku, University of Southern Queensland for his invaluable guidance, kind support, precious time, and encouragement throughout my project work.
I would also like to thank Dr. Francisco Cardona and Mr. Mohan Trada for their valuable advice and generous assistance and advice. I am also indebted to my family, colleagues and friends for their encouragement and support.
Shashi Shekhar
University of Southern Queensland
CONTENTS
Abstract... iii
Limitations of Use ... iv
Certification... v
Acknowledgements ... vi
List of Figures... x
List of Tables ... xii
Nomenclature ... xiii
Chapter 1 Introduction... 1
1.1 Introduction... 1
1.2 Project Aims... 2
1.3 Applications of Composite Materials ... 2
1.4 Advantages of Composite Materials... 2
1.5 Assessment of Consequential Effects ... 3
1.6 Risk Assessment ... 4
1.6.1 Risk Assessment for Resin: ... 4
1.6.2 Risk Assessment for Catalyst: ... 6
Chapter 2 Literature Review ... 9
2.1 Fibre Composites ... 9
2.1.1 Matrix... 9
2.1.2 Reinforcement... 9
2.5.1 Filler (Sawdust)... 13
2.5.2 Resin: Hexion Cellobond J2027L... 14
2.5.3 Choice of Phencat 15 as Catalyst... 14
2.6 Phenolics ... 15
2.6.1 Resoles and Novolacs ... 18
Chapter 3 Experimental Methodology... 19
3.1 Manufacture of Phenolic Resin Composites... 19
3.1.1 Sawdust Sieving... 19
3.1.2 Preparation of the Open Mold/ Cast ... 20
3.1.3 Preparation and Weighing Of Ingredients ... 21
3.1.4 Mixing Of the Ingredients... 22
3.1.5 Pouring In the Mold ... 24
3.1.6 Natural Curing (Hardening Process)... 25
3.1.7 Post Curing (Heat Treatment in Oven) ... 26
3.2 Tensile Property Testing (ASTM D 638) ... 29
3.3 Safety Issues and Precautions ... 31
3.4 Resource Analysis... 32
Chapter 4 Results and Discussions... 34
Conclusion ... 36
References ... 37
Appendix A: Project Specification ... 38
Appendix D: MTS 810 Tensile Testing System Data & Plots ... 46
Sawdust: 0% by Weight... 47
Sawdust: 300 Micron -5% by Weight... 52
Sawdust: 300 Micron -10% by Weight... 61
Sawdust: 300 Micron -15% by Weight... 70
Sawdust: 425 Micron -5% by Weight... 76
Sawdust: 425 Micron -10% by Weight... 85
Sawdust: 425 Micron -15% by Weight... 94
Sawdust: 1.18 mm -5% by Weight ... 102
Appendix E: Viscosity Measurements ... 110
Appendix F: Calculations of Tensile Strength from Raw Data ... 115
Appendix G: Composite Mixture Table ... 117
Appendix H: Calculations of Material Costs... 120
Appendix I: Plots for Tensile Strength of Various Specimen ... 122
Appendix J: MATLAB Scripts ... 124
Script A: MATLAB Script- Plot for the Variation in Tensile Strength among Specimen (BAR Graph)... 124
Script B: MATLAB Script- Plot for the Variation in Tensile Strength among Specimen (Line Graph)... 126
List of Figures
Figure 1. 1: Hazard rating for resin... 5
Figure 1. 2: Hazard rating for catalyst ... 6
Figure 2. 1: Classification of composite materials (Mukhopadhayay, 2004) ... 10
Figure 2. 2: Classification of materials into polymers/ plastics (Source: Strong 2000, p.2) ... 11
Figure 2. 3: Condensation polymerization of Phenolformaldehyde resins... 16
Figure 2. 4: Phenol with active sites marked ... 17
Figure 3. 1: Sieves and manual sieving ... 19
Figure 3. 2: Prepared PVC mold... 20
Figure 3. 3: Application of wax (lubricant) to the mold ... 21
Figure 3. 4: Measured resin and sawdust (ready to be mixed) ... 22
Figure 3. 5: Resin, sawdust and catalyst mixed by gradual stirring ... 23
Figure 3. 6: Resin, catalyst and sawdust mixture poured in the mold ... 24
Figure 3. 7: Natural curing of resin mixture at room temperature for 48 hours or more.. 25
Figure 3. 8: Naturally cured specimen after removal from mold (Ready for heat treatment) ... 26
Figure 3. 9: Oven for heat treatment of specimen ... 27
Figure 3. 10: Specimen tied together with thread to prevent warping during heat treatment ... 28
Figure 3. 11: Specimen held in the hydraulic wedge grips of Tensile Testing Machine (Ready for testing) ... 29
Figure C. 1: Phenol with active sites marked ... 45
Figure E. 1: Brookfield Programmable DV-II+ viscosity testing machine ... 110
Figure E. 2: Spindles for Brookfield Programmable DV-II+ Viscometer... 110
Figure E. 3: Viscosity reading trend ... 112
Figure E. 4: A very high viscous resin mixture ... 113
Figure E. 5: Density measuring machine... 114
Figure F. 1: Load vs extension plot from Tensile testing machine... 115
Figure I. 1: Tensile strength of various phenolic resin composite... 122
Figure I. 2: Tensile strength of composite specimen with 300µm sawdust... 122
Figure I. 3: Tensile strength of composite specimen with 425µm sawdust... 123
List of Tables
Table 1. 1: Examples of common polymers and their applications. (Source: ‘Materials Science of Polymers for Engineering’ T.A.Oswald, G.Menges. Hanser published NY, 1996) ... 12
Table 2. 1: Examples of common polymers and their applications. (Source: ‘Materials Science of Polymers for Engineering’ T.A.Oswald, G.Menges. Hanser published NY, 1996) ... 12
Table 4. 1: Tensile strength of specimen for various sizes and percentage of sawdust.... 35
Table E. 1: Viscosity reading for resin and 1.18 mm grain size sawdust (0-25%) taken using Brookfield Programmable DV-II + Viscometer ... 111 Table E. 2: Density of the 1.18mm grain size mixed with the resin of different ratio of percentage by weight ... 114
Nomenclature
FCDD Fibre Composite Design and Development
CEEFC Centre of Excellence in Engineered Fiber Composites MSDS Material Safety Data Sheet
F = Force (in Newtons) A = Cross section area L = Original length
σ = Stress
ε = Strain
Chapter 1 Introduction
1.1 Introduction
In order to improve the properties and performance of various materials, we need to find new materials, new ways of manufacturing or use the existing materials and form new ones with the use already available materials by varying compositions to achieve desired properties. The most desired properties are low cost, ease of manufacture, availability, low weight, mechanical properties such as strength, fire resistance, corrosion resistance, environmental friendly (bio-degradable), etc.
Composite materials are thus finding increasing use today, as they can cater to various desired properties in a material. Composites are engineered material made up of two or more different materials. Some common examples are: concrete, bones, teeth, fibre glass, wood, chobham armour, ceramics, plywood, plastics, mastic asphalt, etc.
The use of natural fibres has been ever increasing in today’s composite industry. Sawdust is one of the most commonly used natural fibres in thermoplastic industry. The fibrous nature of the sawdust particles provide enhanced mechanical properties to phenolic resin composite materials. In this research, different percentage by weight of sawdust is added to phenolic resin to find the optimum percentage by weight of sawdust in the composite to achieve best tensile strength. The sawdust used in this research is use in three different particulate sizes (300 microns, 450 microns and 1.18 mm). The sawdust is dry and not subjected to any kind of processing before use.
1.2 Project Aims
The research will try to find the optimum percentage by weight of sawdust as filler in the phenolic resin composite. The tensile strength testing on the produced specimen is done after they are naturally cured at room temperature and later post cured in conventional oven at set temperatures for specified intervals of time.
1.3 Applications of Composite Materials
Some of the applications/ uses of composites in the various industries are also categorized and mentioned below:
- Aerospace (Space crafts, passenger aircrafts, unmanned drones, etc.)
- Mechanical and Automotive Engineering (Tools, bearing materials, engine blocks, piston rods, chassis, brakes, clutch pads, etc.)
- Marine (Catamarans, yachts, canoes, lifeboats, etc.)
- Military (Armoured vehicles, humvees, arms, weaponry, etc.) - Civil engineering (Interiors, beams, window panels, etc.) - Electrical (Electrical contacts, fuse plugs body, etc.)
- Medical (Composite teeth, synthetic bones, medical equipments, etc.) - Fire proofing (Buildings, aircrafts, oil rigs, etc.)
- Sports (Composite cricket bats, helmets, golf clubs, pool and snooker balls, etc.)
mass transit vehicles, and as interior construction materials where out gassing in case of fire should be extremely low.
• Phenolics have found their use in sheet molded compound (SMC), pultrusion, filament winding, etc.
• Processing of phenolic resins is quite different from other thermosets, but successful production has been achieved at good production rates and mechanical properties.
• Cost of phenolic resins is comparative with polyesters and are thus is used in various applications, for its very low cost per unit volume.
1.5 Assessment of Consequential Effects
The data obtained during the experiments will be used for analysis and may form the basis of future research work. Thus we need to assess and be aware of the safety and other ethical issues related to the technical tasks performed/ undertaken.
A detailed risk assessment needs to be carried out before the commencement of any technical tasks, such that the potential dangers and risks could be identified and minimized. There are very severe penalties and fine for negligence in case of injury. We must also keep in mind that some of the equipment and facilities are worth multi-thousand –dollars.
We need to be fully aware of the Workplace Health and Safety Act, 1995. This must be used as a reference only and apart from it the ‘duty of care’ of each individual involved must be emphasized. Codes of practice must be adhered to such that risks can be minimized to humans and machinery.
assessment are covered as below: - Risk identification
- Risk evaluation - Risk control
The reference material can be found by browsing the internet and also from some course books from USQ, e.g. Engineering Management, Technology and Society, etc.
1.6 Risk Assessment
The correct assessment of various risks and safety issues involved in this research project must be analysed. The various processes such as mold preparation, raw material handling, casting of composites, removing of cured composites from casts, heat treatment of specimen in oven, tensile testing in laboratory, etc. all involve risk factors that must be taken into account.
At all times personal protective equipment must be used, workshop and laboratory rules and regulations must be adhered to. The personal protective gear include, eye protection- safety goggles, fully covered shoes, face masks, safety hand gloves for chemical handling, etc. While working in laboratory ventilation must be used at all times to get rid of toxic fumes generated during the composite formation processes.
Figure 1. 1: Hazard rating for resin
Risk
• Toxic by inhalation, skin contact and if swallowed • Causes burns
• Carcinogenic effect
• May cause serious damage to eyes
Safety
• Keep locked up
• Keep container in well ventilated place • Avoid exposure, keep container tightly closed • Keep away from food, drink and animal feed
Swallowed
• Contact doctor immediately • Do not vomit if swallowed • Give patient water to rinse mouth • Observe the patient carefully
Eye
• Removal of contact lenses only to be taken by skilled personnel
Other details enlisted in the MSDS: • Extinguishing media
• Fire Fighting
• Fire/ Explosion Hazard • Fire Incompatibility
• Personal Protective Equipment • Minor Spills
• Major spills
• Handling procedures • Storage Requirements
1.6.2 Risk Assessment for Catalyst:
Product name: Hexion Phencat 15 (aka Phenolic resin hardener catalyst) Use: Composite phenolic resin hardener
Safety
• Keep locked up
• Keep container in well ventilated place • Avoid exposure
• Use water to clean floor or contamination • Take off immediately contaminated clothing • Immediately contact doctor in case of emergency
Swallowed
• If swallowed do not induce vomiting • Observe the patient carefully
• Give water to rinse mouth • Seek medical advise
Eye
• Immediately flush with running water • Continue flushing till about 15 min. • Transport to doctor as soon as possible
• Removal of contact lenses must be done only by an expert
Skin
• Immediately flush body parts
• Quickly remove all contaminated clothing • Wash skin and hair with running water • Transport to hospital or doctor immediately
• Notes to physician • Extinguishing media • Fire fighting
• Fire/ explosion hazards
• Personal protective equipment • Minor spills
• Major spills
Chapter 2 Literature Review
2.1 Fibre Composites
Composites have bee in use since a long time by ancient civilizations such as Romans, Egyptians, Chinese, etc. Many of these composite materials were manufactured by man by mixing two or more different materials to get desired properties. Many composites are naturally occurring as well such as wood, teeth, bones, etc.
The structure of a typical fibre reinforced composite comprises a matrix material and a reinforcing material. Thus basically fibre composite materials are made up of 2 phases: where the 2nd phase reinforces the 1st phase known as matrix. The fibre phase is responsible for bearing loads by their orientation in the matrix of composite.
2.1.1 Matrix
This part of the composite is mostly in larger quantity and homogeneous in the composite. The various matrices in a composite can be ceramic, metallic or polymeric. The matrix properties are enhanced when a composite is formed by addition of other constituent.
2.1.2 Reinforcement
reinforcement inter-phase. (Matthews; 2003)
The composite materials are generally classified as per their matrix materials, thus called as metal matrix composites (MMC), polymer matrix composites (PMC), ceramic matrix composites (CMC), etc. (Mallick 1997)
[image:23.612.64.559.251.493.2]2.2 Classification of Composite Materials
Figure 2. 1: Classification of composite materials (Mukhopadhayay, 2004)
2.3 Polymers
Particle reinforced Fiber reinforced composites Structural
Large particle
Dispersion strengthened
Continuous (aligned)
Discontinuous (short)
Laminates Sandwich
panels
Aligned Randomly oriented
Polymers due to their low densities as compared to metals, etc. are easier to shape and molded at relatively lower temperatures. It is due to these properties and ease of manufacturing that polymers have been replacing conventional materials such as metals, wood, glass, etc.
[image:24.612.115.495.234.504.2]The diagram below show the classification of materials as polymers:
Figure 2. 2: Classification of materials into polymers/ plastics (Source: Strong 2000, p.2)
2.4 Polymer Composites
[image:25.612.87.522.240.641.2] [image:25.612.91.518.242.637.2]
2.4.1 Thermoplastics
Thermoplastics are the type of polymers which are able to flow when heated. They are solid when they have cooled but the flow characteristics are regained on heating. The flow can be explained by the ability of the polymer molecules to slide against each other. The thermoplastics are also of two types: amorous and semi-crystalline. Amorous thermoplastics have a random molecular distribution in their structure while the semi-crystalline thermoplastics have a particular order of structure.
2.4.2 Thermosets
Thermosetting resins are fluid at room temperature. This property is used in mixing various desired ingredients/ additives such as fillers, additives, etc. Phenolics, epoxies, polyamides, etc. are the most commonly used thermosetting resins used today. The selection of a particular resin depends upon the application in which it is to be used.
2.5 Materials Used To Manufacture Phenolic Resin Composites
2.5.1 Filler (Sawdust)
2.5.2 Resin: Hexion Cellobond J2027L
Hexion Cellobond J2027L is the phenolic resin used in the preparation of composites in this research; it is actually the product name for phenol formaldehyde resin solution. It is a classic resin which is brownish and with a phenolic odour. The viscosity is around 2800 cp at 25 deg. C. Its composition consists of:
Phenol/ formaldehyde resin- 30-60% Phenol- 1-10%
Formaldehyde- 1-5% Water- 30-60%
It is worth noting that phenolic resins are thermosetting polymers with high chemical resistance and thermal stability but low toughness and mechanical strength. Also, they have intrinsic resistance to ignition, generate low smoke and relatively cheap.
2.5.3 Choice of Phencat 15 as Catalyst
We have a few choices of catalysts to go with phenolic resins, namely: - Phencat 15
- Phencat 382 - UH
resins resulting in exothermic reaction. Its typical composition is: Phosphoric acid- 40 to 80%
Water- 20 to 60%
UH is typically urea hydrochloride solution with 1:1 ratio of urea to hydrochloric acid. The reaction is highly exothermic in this case and hence making it even more dangerous to use.
2.6 Phenolics
[image:29.612.148.477.137.553.2]
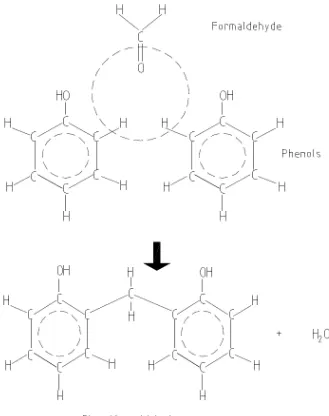
The figure below shows the condensation polymerisation reaction between phenol and formaldehyde, producing Phenolformaldehyde.
Figure 2. 4: Phenol with active sites marked
2.6.1 Resoles and Novolacs
The condensation reaction of phenolics can be carried out in two different conditions resulting in different intermediate materials: Resoles and Novolacs. Both of these intermediate products are used in the molding process, although Novolacs are more common (Shackelford, 1992; Smith and Hashemir, 2006).
Resoles are formed by carrying out by a controlled condensation polymerisation reaction in an alkali solution with excess formaldehyde. These results in the formation of a linear, non-crosslinked polymer liquid called resole. The resole can be molded by heating the viscous liquid which achieves cross linking. Since a crosslinked part can be achieved by simply heating the resoles, these are called as one-stage resins (Smith and Hashemir, 2006)
Chapter 3 Experimental Methodology
3.1 Manufacture of Phenolic Resin Composites
3.1.1 Sawdust Sieving
Sawdust is a by-product of sawing process of wood and can be procured from a wood mill. The bulk of sawdust then needs to be manually sieved to segregate three different sizes of sawdust particles: 1.18 mm, 425 microns and 300 microns. If this needs to be done at a large or industrial scale, then the use of automated and mechanized equipment might be productive.
3.1.2 Preparation of the Open Mold/ Cast
It is very important to prepare the mold before mixing of resin, catalyst and sawdust. The reason being that once the ingredients are mixed the curing process and reactions have already started to take place and with time the fluidity of the mixture decrease rapidly making it very difficult for us to pour it into the mold.
Figure 3. 2: Prepared PVC mold
Figure 3. 3: Application of wax (lubricant) to the mold
Earlier instead of wax, canola oil was also tried for lubrication, but results were not that satisfactory which could be due to the unstable nature of the liquid oil. It tends to form globules and did not stay evenly spread after a while.
3.1.3 Preparation and Weighing Of Ingredients
The resin is now measured using an electronic measuring scale in a clean container. Catalyst and appropriate size of sawdust is also measured separately and kept in clean containers ready to do the mixing.
Upper half of mold
Screw and wing nut to clamp both halves of mold Lower half of
3.1.4 Mixing Of the Ingredients
[image:35.612.90.523.212.388.2]Before we proceed for mixing, the ventilator in the laboratory must be started in exhaust mode so as to get rid of toxic fumes being generated during mixing process.
Figure 3. 4: Measured resin and sawdust (ready to be mixed)
Firstly the sawdust is mixed gradually with resin by stirring very carefully. A lot of care needs to be taken at this stage, since rapid mixing might allow air bubbles to get trapped into the mixture. The weighted catalyst is then added to this mixture and again mixing is done as described earlier. Typically mixing takes from 5- 10 minutes till a homogenous mixture can be seen.
Figure 3. 5: Resin, sawdust and catalyst mixed by gradual stirring
[image:37.612.131.481.197.410.2]
3.1.5 Pouring In the Mold
Figure 3. 6: Resin, catalyst and sawdust mixture poured in the mold
[image:38.612.112.505.129.363.2]
3.1.6 Natural Curing (Hardening Process)
Figure 3. 7: Natural curing of resin mixture at room temperature for 48 hours or more
The molds are now left, after proper marking, at a safe place for natural curing at room temperature. It has been found that the specimens take from 24 – 48 hours to set. Still, the specimens could be left a bit longer to cure as it will make sure that they have set properly.
[image:39.612.135.476.129.353.2]
3.1.7 Post Curing (Heat Treatment in Oven)
Figure 3. 8: Naturally cured specimen after removal from mold (Ready for heat treatment)
Post curing is done in oven to further harden and set the cast phenolic resin composites and to increase its mechanical properties, etc. The post curing is done as per a specific temperature and time chart, which is given as below:
• 4 hours at 50 degree Celsius; • 4 hours at 80 degree Celsius; • 2 hours at 100 degree Celsius
Figure 3. 9: Oven for heat treatment of specimen
It has been found by earlier experiments that heating the specimens directly at high temperature would increase brittleness in the specimens. Hence the heating is required to be done gradually in stages.
We must be quite carefully during the heating process as it has been found in earlier experiments that the specimens tend to warp during heating. To prevent this from happening, the bunch of specimen is made and weights put at the ends during the heating. This will produce generally straight and uniform shape.
Thermometer
Figure 3. 10: Specimen tied together with thread to prevent warping during heat treatment
One of the advantages of using conventional oven is that the heating of the samples will be even. Although on its flip side, conventional ovens take more time and are power hungry.
The resin in discussion is Phenol- formaldehyde (PF), which are formed by the reaction of phenol with formaldehyde. We can produce different types of resin composites by doing variations during the formation process: variation in the reaction time, ratio of formaldehyde to phenol, reaction temperature, catalyst type, etc.
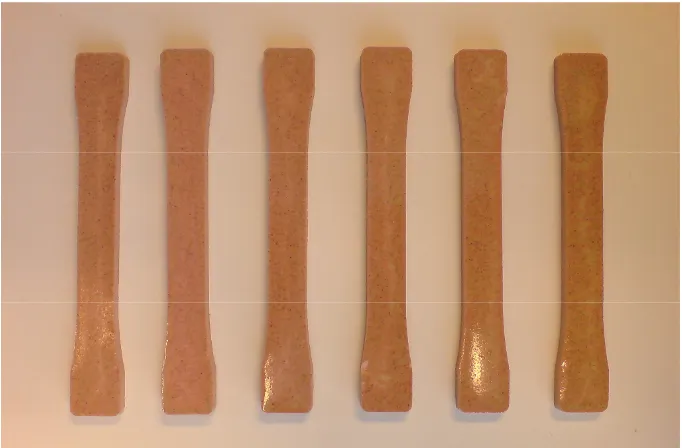
3.2 Tensile Property Testing (ASTM D 638)
The specimens acquired have to be tested for tensile strength. This is done in the University of Southern Queensland’s engineering faculty laboratory. The equipment used is the Universal Testing Machine or Tensile Testing Machine. This is a hydraulically operated machine and uses a hydraulic power pack and set of valves to control the rate of operation. A load cell mounted on the top vice measures the load values during the experiment. The data obtained from this test can be used to calculate Young’s modulus, yield strength and tensile strength.
[image:42.612.43.553.300.591.2]Tensile testing machine’s hydraulic wedge grips with sample (Ready for testing)
Figure 3. 11: Specimen held in the hydraulic wedge grips of Tensile Testing Machine (Ready for testing)
The generally accepted test method standard for plastics and low strength composites is ASTM D 638 [‘Test Method for Tensile Properties of Polymer Matrix Composite Materials”, ASTM Standard D 638-95, ASTM, Philadelphia, PA (1996).] This incorporates an un-tabbed, dog-boned, flat specimen of various prescribed geometries. The ends are to increase the cross sectional area and thus reduce the stresses there as compared to that in the gage length and thus hopefully maintaining failure in the gage length during the testing.
Universal testing machine in USQ lab uses hydraulic wedge grips, where the gripping pressure is controlled by the operator. These specially designed grips also prevent the side ways movement of the samples during testing. Some other types of testing devices also use mechanical type of grips where gripping pressure is independent of the operator. Hydraulic type gripping gives greater control but the pressure has to be right. If too little a pressure is applied, the specimen will slip, hence ruining the test. Otherwise too much of pressure could possibly crush the specimen ends, ruining the tests again.
allowed to get cured completely before trying to remove from the molds. Extra care taken by putting weight on top of specimen during heat treatment goes a long way in getting best samples for testing by eliminating pre-stress factors.
3.3 Safety Issues and Precautions
We need to be fully aware of the workplace safety and health regulations before we proceed to do the work in the laboratories. This objective is generally achieved by a safety familiarization demonstration conducted by laboratory staff. Material Safety Data Sheet (MSDS) is also provided beforehand such that we are familiar with the chemicals we are going to deal with during the project. The MSDS provides information on the hazards, preventive and emergency measures associated with the chemical handling procedure. The figures given below show the hazard ratings of resin: Hexion Cellobond J2027L and catalyst: Hexion Phencat 15. It is always advisable to keep a copy of the MSDS near to the chemical handling area (laboratory).
3.4 Resource Analysis
The experiments basically need various resources required to carry out the experiments and produce the final specimens.
The most critical to the experiments are the supply of resins and catalyst. The suppliers for Resin: Hexion Cellobond J2027J and Catalyst: Hexion Phencat 15 is:
• Hexion Specialty Chemicals Pty Ltd, Murarrie (QLD) and • Hexion Specialty Chemicals Pty Ltd, Laverton North (VIC).
The sawdust can be procured in bulk, free of cost from local sawmills. Care must be taken to take dry sawdust with no contamination with soil, leaves, etc.
The safety gears are provided by the supervisor. These gears normally include: • Safety chemical grade gloves
• Disposable surgical gloves and other disposable gloves • Chemical mask and dust masks
• Safety glasses.
Other things needed to do the experiments vary as per the need: • Cast/ molds (02 sets)
• Plastic containers, plastic spoons, rags, wax, scrapper, screws and wing nuts, screw driver, etc.
original place so that others may find it without hassle. The experimental work such as casting, natural curing, etc. is mostly done in USQ laboratory- Z106.
Other very critical equipments for the successful completion of the research are: • Tensile testing machine (USQ laboratory- Z105)
Chapter 4 Results and Discussions
Table 4.1 below shows the values of tensile strength for specimens related to this research work. Tensile strength has been found for a sample with no sawdust. This is for reference and to also compare the improvement in the tensile strength on addition of sawdust as fillers in phenolic resin composite materials.
0% Sawdust:
We can see in the Table 4.1 that the tensile strength for 0% sawdust is only 1.17 MPa, which is relatively very low as compared to other values for sawdust reinforced resins.
300 µm Sawdust:
We can see that the maximum tensile strength achieved is 12.38 MPa for 5% sawdust w/w (300 µm). Also, 15% sawdust for same size sawdust gives us strength of 11.07 MPa. The tensile strength for 15% sawdust is only slightly lower (1.31 MPa) than for 5% sawdust but this would mean much lower manufacturing cost due to increased sawdust content in the final composite. The value of tensile strength for 10% sawdust is lower than both 5% and 10% sawdust specimens.
425 µm Sawdust:
The tensile strength for 15% w/w of sawdust is 10.63 which is more than tensile strength for 5% (2.77 MPa) and 10% (4.95 MPa) sawdust. The strength trend is increasing as we are increasing the percentage of sawdust of this size.
Tables of calculated values of tensile strength for oven cured composite specimen.
Tensile Strength (MPa) = Peak Stress (MPa)
Specimen # 1 2 3 4 5 6 Average
No Sawdust
0% Sawdust 1.07 1.04 1.40 NA NA NA 1.17
300 µm Sawdust
5% Sawdust 13.50 11.79 11.30 12.94 11.70 13.06 12.38
10% Sawdust 6.42 6.59 9.78 9.70 6.74 4.21 7.24
15% Sawdust 10.46 14.16 10.56 9.10 NA NA 11.07
425 µm Sawdust
5% Sawdust 1.63 3.69 2.68 2.79 3.33 2.52 2.77
10% Sawdust 5.23 4.99 2.67 7.14 5.02 4.65 4.95
15% Sawdust 8.11 10.98 13.31 9.16 12.02 10.18 10.63
1.18 mm Sawdust
5% Sawdust 1.67 1.64 1.81 1.65 1.94 1.85 1.76
[image:48.612.83.716.146.429.2]
Figure 4. 1: Tensile strength of various phenolic resin specimens
Conclusion
The bar chart (Figure 4.1) given above depicts the values of tensile strength for comparison. Clearly the 300 µm sawdust gives the best results, the highest value being 12.38 MPa for 5% sawdust w/w. This is approximately 10.5 times more than the tensile strength of composite with no sawdust (1.17 MPa). This clearly demonstrates that 0% 5% 10% 15% 5% 10% 15% 0%
References
1145.2 Australian Standard, Determination of tensile properties of plastic materials- Test conditions for mouldings and extrusion plastics, 2001.
Askeland, D R, The Science and Engineering of Materials, 4th Edition, Stanley thornes, 1999, pp.191-193, 620.
ASTM, Test Method for Tensile Properties of Polymer Matrix Composite Materials, ASTM Standard D 638-95, Philadelphia, PA, 1996.
Chemwatch 4601-85, Issue Date: 20/6/2005, Hexion Cellobond J2027L, Material Safety Data Sheet, pp.1-14.
Chemwatch 4601-93, Issue Date: 23/6/2005, Hexion Phencat 15, Material Safety Data Sheet, pp 1-14.
Shackelford, J F, 1992, Introduction to Material Science for Engineers, 3rd Edition, Macmillan, pp. 435-437.
Strong, A B, Plastics: Materials and Processing, 3rd Edition, Pearson/Prentice-Hall, 2006, pp. 2, 182-183, 304-309, 323-333.
Swallowe, G M 1999, Mechanical Properties and Testing of Polymers, Vol. 3, Kluwer, 1999.
Turner S, 2000, Mechanical Testing of Advanced Fibre Composites, edited by Hodgkinson, J M, pp 5.
University of Southern Queensland
FACULTY OF ENGINEERING AND SURVEYING
ENG 4111/4112 Research Project PROJECT SPECIFICATION
VERSION B
FOR: SHASHI SHEKHAR (00500 694 75)
TOPIC: TENSILE STRENGTH OF SAWDUST
REINFORCED PHENOLIC COMPOSITES.
SUPERVISOR: Dr. Harry Ku
SPONSOR/S: Dr. Harry Ku and Dr. F. Cardona
(Faculty of Engineering and Surveying, USQ)
ENROLMENT: ENG4111 – S1 2008;
ENG4112 – S2 2008
PROGRAMME TIMELINE:
1. Safety orientation in the lab, equipment familiarisation and literature reviews.
Begin : 3rd March 2008
Completion : 20thMarch 2008
Approx. Hours : 30 hours
2. Sieving and segregating sawdust for the tests.
Begin : 25th March 2008
Completion : 7th April 2008
Approx. Hours : 30 hours
3. Casting specimens in the laboratory and curing.
Begin : 9th April 2008
Completion : 18th April 2008
Approx. Hours : 25 hours
4. Perform tensile strength test and examination of specimens.
Begin : 21st April 2008
Completion : 16th May 2008
Approx. Hours : 40 hours
5. Analysis of results.
Begin : 19th May 2008
6. Draw up conclusions.
Begin : 3rd June 2008
Completion : 27th June 2008
Approx. Hours : 50 hours
7. Software package analysis (Time permitting)
Begin : 30th June 2008
Completion : 11th July 2008
Approx. Hours : 20 hours
8. Discussion for the thesis outline with supervisors.
Begin : 14th July 2008
Completion : 1st August 2008
Approx. Hours : 20 hours
9. Thesis initial drafting and each chapter in draft form and shown to supervisors.
Begin : 4th August 2008
Completion : 22nd August 2008
Approx. Hours : 60 hours
11. Complete the thesis in requested format.
Begin : 15th September 2008
Completion : 31st October 2008
Approx. Hours : 40 hours
AGREED:
[image:57.612.151.476.173.602.2]
[image:58.612.156.465.176.512.2]
Appendix C: Phenol with Active Sites
Appendix D: MTS 810 Tensile Testing System Data &
Plots
Tensile Test Plot Obtained On MTS 810 For:
shashi-sd-0%
Test Date : 11/09/2008
Method : MMT Tensile Test with return.msm
Specimen Results: Specime n # Thicknes s mm Width mm Area mm^2 Peak Load N Peak Stress MPa Break Load N Break Stress MPa
1 5.800 14.550 84 91 1.07 91 1.07
2 5.620 14.380 81 84 1.04 79 0.98
3 5.500 14.450 79 112 1.40 112 1.40
Mean 5.640 14.460 82 95 1.17 94 1.15 Std Dev 0.151 0.085 3 14 0.20 17 0.22
Specime n # Elongatio n At Break mm Stress At Offset Yield MPa Load At Offset Yield N
1 0.229 0.577 48.677 2 0.287 0.748 60.427 3 0.223 0.739 58.748
Mean 0.246 0.688 55.951 Std Dev 0.035 0.096 6.355
11/09/2008
Sample ID: shashi-sd-0%-1.mss Specimen Number: 1
Tagged: False 0 10 20 30 40 50 60 70 80 90 100
0.0 0.1 0.2 0.3 0.4 0.5 0.6 0.7
Load (N) Extension (mm) [1] F Y M Specimen Results:
Name Value Units Thickness 5.800 mm Width 14.550 mm
Area 84 mm^2
Peak Load 91 N
Peak Stress 1.07 MPa
Break Load 91 N
11/09/2008
Sample ID: shashi-sd-0%-2.mss Specimen Number: 2
Tagged: False
0 10 20 30 40 50 60 70 80 90
0.0 0.1 0.2 0.3 0.4
Load (N)
Extension (mm)
[2]
F Y
B
M
Specimen Results:
11/09/2008
Sample ID: shashi-sd-0%-3.mss Specimen Number: 3
Tagged: False 0 10 20 30 40 50 60 70 80 90 100 110 120
0.00 0.02 0.04 0.06 0.08 0.10 0.12 0.14 0.16 0.18 0.20 0.22 0.24 Load (N) Extension (mm) [3] F Y M Specimen Results:
Name Value Units Thickness 5.500 mm Width 14.450 mm
Area 79 mm^2
Peak Load 112 N
Tensile Test Plot Obtained On MTS 810 For:
shashi-sd300-5%
Test Date : 13/05/2008
Method : MMT Tensile Test with return.msm
Specimen Results: Specime n # Thicknes s mm Width mm Area mm^2 Peak Load N Peak Stress MPa Break Load N Break Stress MPa
1 5.200 14.480 75 1016 13.50 1016 13.50 2 5.280 14.440 76 899 11.79 899 11.79 3 5.440 14.800 81 910 11.30 910 11.30 4 5.500 14.690 81 1046 12.94 1046 12.94 5 5.200 14.350 75 873 11.70 873 11.70 6 5.280 14.580 77 1005 13.06 1005 13.06
Mean 5.317 14.557 77 958 12.38 958 12.38 Std Dev 0.125 0.167 3 73 0.90 73 0.90
Specime n # Elongatio n At Break mm Stress At Offset Yield MPa Load At Offset Yield N
1 0.871 7.624 574.053 2 0.841 6.473 493.484 3 0.649 6.505 523.698 4 1.426 7.604 614.338 5 0.672 6.613 493.484 6 0.779 7.501 577.410
0 1 0 0 2 0 0 3 0 0 4 0 0 5 0 0 6 0 0 7 0 0 8 0 0 9 0 0 1 0 0 0 1 1 0 0
0 .0 0 .1 0 .2 0 .3 0 .4 0 .5 0 .6 0 .7 0 .8 0 .9 1 .0 1 .1 1 .2 1 .3 1 .4 1 .5 L o a d ( N)
13/05/2008
Sample ID: shashi-sd300-5%-1.mss Specimen Number: 1
Tagged: False 0 100 200 300 400 500 600 700 800 900 1000 1100
0.0 0.1 0.2 0.3 0.4 0.5 0.6 0.7 0.8 0.9
Load (N) Extension (mm) [1] F B M Specimen Results:
Name Value Units Thickness 5.200 mm Width 14.480 mm
13/05/2008
Sample ID: shashi-sd300-5%-2.mss Specimen Number: 2
Tagged: False
0 100 200 300 400 500 600 700 800 900
0.0 0.1 0.2 0.3 0.4 0.5 0.6 0.7 0.8 0.9
Load (N)
Extension (mm)
[2]
F
B
M
Specimen Results:
Name Value Units Thickness 5.280 mm Width 14.440 mm
13/05/2008
Sample ID: shashi-sd300-5%-3.mss Specimen Number: 3
Tagged: False 0 100 200 300 400 500 600 700 800 900 1000
0.0 0.1 0.2 0.3 0.4 0.5 0.6 0.7
Load (N)
Ex tens ion (mm)
[3] F Y B M Specimen Results:
Name Value Units Thickness 5.440 mm Width 14.800 mm
Area 81 mm^2
Peak Load 910 N
13/05/2008
Sample ID: shashi-sd300-5%-4.mss Specimen Number: 4
Tagged: False
0 100 200 300 400 500 600 700 800 900 1000 1100
0.0 0.1 0.2 0.3 0.4 0.5 0.6 0.7 0.8 0.9 1.0 1.1 1.2 1.3 1.4 1.5 Load (N)
Ex tens ion (mm)
[4]
F Y
B
M
Specimen Results:
Name Value Units Thickness 5.500 mm Width 14.690 mm
13/05/2008
Sample ID: shashi-sd300-5%-5.mss Specimen Number: 5
Tagged: False
0 100 200 300 400 500 600 700 800 900
0.0 0.1 0.2 0.3 0.4 0.5 0.6 0.7
Load (N)
Extension (mm)
[5]
F
M
Specimen Results:
Name Value Units Thickness 5.200 mm Width 14.350 mm
Area 75 mm^2
Peak Load 873 N
13/05/2008
Sample ID: shashi-sd300-5%-6.mss Specimen Number: 6
Tagged: False
0 100 200 300 400 500 600 700 800 900 1000 1100
0.0 0.1 0.2 0.3 0.4 0.5 0.6 0.7 0.8
Load (N)
Extension (mm)
[6]
F
M
Specimen Results:
Name Value Units Thickness 5.280 mm Width 14.580 mm
Tensile Test Plot Obtained On MTS 810 For:
shashi-sd300-10%
Test Date : 13/05/2008
Method : MMT Tensile Test with return.msm
Specimen Results: Specime n # Thicknes s mm Width mm Area mm^2 Peak Load N Peak Stress MPa Break Load N Break Stress MPa
1 5.340 14.560 78 499 6.42 499 6.42
2 5.390 14.690 79 522 6.59 522 6.59
3 5.280 14.590 77 754 9.78 754 9.78
4 5.350 14.610 78 758 9.70 758 9.70
5 5.280 14.630 77 520 6.74 520 6.74
6 5.270 14.580 77 323 4.21 323 4.21
Mean 5.318 14.610 78 563 7.24 563 7.24 Std Dev 0.049 0.046 1 167 2.15 167 2.15
Specime n # Elongatio n At Break mm Stress At Offset Yield MPa Load At Offset Yield N
1 0.559 3.476 270.241 2 0.712 3.858 305.490 3 0.834 5.284 407.041 4 0.868 5.272 412.076 5 0.642 3.998 308.847 6 0.336 2.709 208.136
0 1 0 0 2 0 0 3 0 0 4 0 0 5 0 0 6 0 0 7 0 0 8 0 0
0 .0 0 .1 0 .2 0 .3 0 . 4 0 . 5 0 . 6 0 . 7 0 . 8 0 . 9 L o a d ( N )
13/05/2008
Sample ID: shashi-sd300-10%-1.mss Specimen Number: 1
Tagged: False
0 100 200 300 400 500
0.0 0.1 0.2 0.3 0.4 0.5 0.6
Load (N)
Ex tens ion (mm)
[1]
F
M
Specimen Results:
13/05/2008
Sample ID: shashi-sd300-10%-2.mss Specimen Number: 2
Tagged: False
0 100 200 300 400 500 600
0.0 0.1 0.2 0.3 0.4 0.5 0.6 0.7 0.8
Load (N)
Ex tens ion (mm)
[2]
F
B
M
Specimen Results:
Name Value Units Thickness 5.390 mm Width 14.690 mm
Area 79 mm^2
Peak Load 522 N
13/05/2008
Sample ID: shashi-sd300-10%-3.mss Specimen Number: 3
Tagged: False
0 100 200 300 400 500 600 700 800
0.0 0.1 0.2 0.3 0.4 0.5 0.6 0.7 0.8 0.9
Load (N)
Ex tens ion (mm)
[3]
F
B
M
Specimen Results:
13/05/2008
Sample ID: shashi-sd300-10%-4.mss Specimen Number: 4
Tagged: False
0 100 200 300 400 500 600 700 800
0.0 0.1 0.2 0.3 0.4 0.5 0.6 0.7 0.8 0.9
Load (N)
Ex tens ion (mm)
[4]
F Y
B
M
Specimen Results:
Name Value Units Thickness 5.350 mm Width 14.610 mm
Area 78 mm^2
Peak Load 758 N
13/05/2008
Sample ID: shashi-sd300-10%-5.mss Specimen Number: 5
Tagged: False
0 100 200 300 400 500 600
0.0 0.1 0.2 0.3 0.4 0.5 0.6 0.7
Load ( N)
Ex tens ion ( mm)
[5] F
Y
B
M
Specimen Results:
Name Value Units Thickness 5.280 mm Width 14.630 mm
Area 77 mm^2
13/05/2008
Sample ID: shashi-sd300-10%-6.mss Specimen Number: 6
Tagged: False
0 100 200 300 400
0.0 0.1 0.2 0.3 0.4
Load (N)
Extension (mm)
[6]
F Y
M
Specimen Results:
Name Value Units Thickness 5.270 mm Width 14.580 mm
Area 77 mm^2
Peak Load 323 N
Tensile Test Plot Obtained On MTS 810 For:
shashi-sd300-15%
Test Date : 11/09/2008
Method : MMT Tensile Test with return.msm
Specimen Results: Specime n # Thicknes s mm Width mm Area mm^2 Peak Load N Peak Stress MPa Break Load N Break Stress MPa
1 6.200 14.550 90 943 10.46 943 10.46 2 6.150 14.750 91 1285 14.16 1175 12.95 3 6.020 14.520 87 923 10.56 923 10.56
4 5.850 14.550 85 775 9.10 775 9.10
5 6.030 14.650 88 456 5.16 456 5.16
Mean 6.050 14.604 88 876 9.89 854 9.65 Std Dev 0.136 0.095 2 300 3.24 265 2.87
Specime n # Elongatio n At Break mm Stress At Offset Yield MPa Load At Offset Yield N
1 0.489 6.782 611.820 2 0.873 9.539 865.276 3 0.437 8.689 759.529 4 0.371 7.454 634.480 5 0.212 4.864 429.701
Mean 0.476 7.466 660.161 Std Dev 0.245 1.805 164.358
11/09/2008
Sample ID: shashi-sd300-15%-1.mss Specimen Number: 1
Tagged: False
0 100 200 300 400 500 600 700 800 900 1000
0.0 0.1 0.2 0.3 0.4 0.5 0.6
Load (N)
Extension (mm)
[1]
F Y
B
M
Specimen Results:
11/09/2008
Sample ID: shashi-sd300-15%-2.mss Specimen Number: 2
Tagged: False 0 100 200 300 400 500 600 700 800 900 1000 1100 1200 1300
0.0 0.1 0.2 0.3 0.4 0.5 0.6 0.7 0.8 0.9 1.0
Load (N) Extension (mm) [2] F Y B M Specimen Results:
Name Value Units Thickness 6.150 mm Width 14.750 mm
11/09/2008
Sample ID: shashi-sd300-15%-3.mss Specimen Number: 3
Tagged: False
0 100 200 300 400 500 600 700 800 900 1000
0.0 0.1 0.2 0.3 0.4 0.5
Load (N)
Extension (mm)
[3]
F
B
M
Specimen Results:
11/09/2008
Sample ID: shashi-sd300-15%-4.mss Specimen Number: 4
Tagged: False
0 100 200 300 400 500 600 700 800
0.0 0.1 0.2 0.3 0.4
Load (N)
Extension (mm)
[4]
F Y
B
M
Specimen Results:
Name Value Units Thickness 5.850 mm Width 14.550 mm
Area 85 mm^2
Peak Load 775 N
Tensile Test Plot Obtained On MTS 810 For:
shashi-sd425-5%
Test Date : 11/09/2008
Method : MMT Tensile Test with return.msm
Specimen Results: Specime n # Thicknes s mm Width mm Area mm^2 Peak Load N Peak Stress MPa Break Load N Break Stress MPa
1 5.350 14.660 78 128 1.63 128 1.63
2 5.610 14.450 81 299 3.69 299 3.69
3 5.510 14.460 80 213 2.68 213 2.68
4 5.410 14.560 79 220 2.79 220 2.79
5 5.300 14.490 77 256 3.33 256 3.33
6 5.280 14.550 77 194 2.52 194 2.52
Mean 5.410 14.528 79 218 2.77 218 2.77 Std Dev 0.129 0.079 2 58 0.71 58 0.71
Specime n # Elongatio n At Break mm Stress At Offset Yield MPa Load At Offset Yield N
1 0.164 1.626 127.567 2 0.392 2.226 180.441 3 0.289 2.022 161.138 4 0.347 1.918 151.067 5 0.398 2.186 167.852 6 0.288 2.010 154.424
0 100 200 300
0.0 0.1 0.2 0.3 0.4 0.5
Load (N)
Extension (mm)
Sample ID: shashi-sd425-5%-1.mss Specimen Number: 1
0 10 20 30 40 50 60 70 80 90 100 110 120 130
0.00 0.02 0.04 0.06 0.08 0.10 0.12 0.14 0.16 0.18
Load (N) Extension (mm) [1] F B M Specimen Results:
Name Value Units Thickness 5.350 mm Width 14.660 mm
Area 78 mm^2
Peak Load 128 N
Tagged: False
0 100 200 300
0.0 0.1 0.2 0.3 0.4 0.5
Load (N)
Extension (mm)
[2]
F Y
B
M
Specimen Results:
Name Value Units Thickness 5.610 mm Width 14.450 mm
Area 81 mm^2
Peak Load 299 N
Tagged: False 0 20 40 60 80 100 120 140 160 180 200 220
0.0 0.1 0.2 0.3 0.4
Load (N) Extension (mm) [3] F Y B M Specimen Results:
Name Value Units Thickness 5.510 mm Width 14.460 mm
Area 80 mm^2
Peak Load 213 N
11/09/2008
Sample ID: shashi-sd425-5%-4.mss Specimen Number: 4
Tagged: False
0 20 40 60 80 100 120 140 160 180 200 220
0.0 0.1 0.2 0.3 0.4
Load (N)
Extension (mm)
[4]
F Y
B
M
Specimen Results:
11/09/2008
Sample ID: shashi-sd425-5%-5.mss Specimen Number: 5
Tagged: False 0 20 40 60 80 100 120 140 160 180 200 220 240 260
0.0 0.1 0.2 0.3 0.4 0.5
Load (N) Extension (mm) [5] F B M Specimen Results:
Name Value Units Thickness 5.300 mm Width 14.490 mm
Area 77 mm^2
Peak Load 256 N
11/09/2008
Sample ID: shashi-sd425-5%-6.mss Specimen Number: 6
Tagged: False
0 20 40 60 80 100 120 140 160 180 200
0.0 0.1 0.2 0.3 0.4
Load (N)
Extension (mm)
[6]
F Y
B
M
Specimen Results:
Tensile Test Plot Obtained On MTS 810 For:
shashi-sd425-10%
Test Date : 11/09/2008
Method : MMT Tensile Test with return.msm
Specimen Results: Specime n # Thicknes s mm Width mm Area mm^2 Peak Load N Peak Stress MPa Break Load N Break Stress MPa
1 5.440 14.400 78 410 5.23 410 5.23
2 5.420 14.400 78 389 4.99 389 4.99
3 5.660 14.460 82 218 2.67 218 2.67
4 5.430 14.550 79 564 7.14 564 7.14
5 5.460 14.770 81 405 5.02 405 5.02
6 5.420 14.700 80 370 4.65 370 4.65
Mean 5.472 14.547 80 393 4.95 393 4.95 Std Dev 0.093 0.157 1 110 1.43 110 1.43
Specime n # Elongatio n At Break mm Stress At Offset Yield MPa Load At Offset Yield N
1 0.355 3.685 288.705 2 0.365 3.828 298.776 3 0.176 -0.046 -3.760 4 0.503 4.483 354.167 5 0.351 3.580 288.705 6 0.330 4.045 322.275
0 100 200 300 400 500 600
0.0 0.1 0.2 0.3 0.4 0.5 0.6
Load (N)
11/09/2008
Sample ID: shashi-sd425-10%-1.mss Specimen Number: 1
Tagged: False
0 100 200 300 400 500
0.0 0.1 0.2 0.3 0.4
Load (N)
Extension (mm)
[1]
F Y
B
M
Specimen Results:
11/09/2008
Sample ID: shashi-sd425-10%-2.mss Specimen Number: 2
Tagged: False
0 100 200 300 400
0.0 0.1 0.2 0.3 0.4
Load (N)
Extension (mm)
[2]
F
B
M
Specimen Results:
Name Value Units Thickness 5.420 mm Width 14.400 mm
Area 78 mm^2
Peak Load 389 N
11/09/2008
Sample ID: shashi-sd425-10%-3.mss Specimen Number: 3
Tagged: False
0 20 40 60 80 100 120 140 160 180 200 220
0.00 0.02 0.04 0.06 0.08 0.10 0.12 0.14 0.16 0.18
Load (N)
Extension (mm)
[3]
F
B
M
Specimen Results:
11/09/2008
Sample ID: shashi-sd425-10%-4.mss Specimen Number: 4
Tagged: False
0 100 200 300 400 500 600
0.0 0.1 0.2 0.3 0.4 0.5 0.6
Load (N)
Extension (mm)
[4]
F
B
M
Specimen Results:
Name Value Units Thickness 5.430 mm Width 14.550 mm
Area 79 mm^2
Peak Load 564 N
11/09/2008
Sample ID: shashi-sd425-10%-5.mss Specimen Number: 5
Tagged: False
0 100 200 300 400 500
0.0 0.1 0.2 0.3 0.4
Load (N)
Extension (mm)
[5]
F Y
B
M
Specimen Results:
11/09/2008
Sample ID: shashi-sd425-10%-6.mss Specimen Number: 6
Tagged: False
0 100 200 300 400
0.0 0.1 0.2 0.3 0.4
Load (N)
Extension (mm)
[6]
F Y
B
M
Specimen Results:
Name Value Units Thickness 5.420 mm Width 14.700 mm
Area 80 mm^2
Peak Load 370 N
Tensile Test Plot Obtained On MTS 810 For:
shashi-sd425-15%
Test Date : 11/09/2008
Method : MMT Tensile Test with return.msm
Specimen Results: Specime n # Thicknes s mm Width mm Area mm^2 Peak Load N Peak Stress MPa Break Load N Break Stress MPa
1 5.610 14.610 82 665 8.11 665 8.11
2 5.550 14.650 81 893 10.98 893 10.98 3 5.760 14.590 84 1119 13.31 1119 13.31
4 5.720 14.690 84 770 9.16 770 9.16
5 5.620 14.620 82 988 12.02 988 12.02 6 5.750 14.420 83 844 10.18 844 10.18
Mean 5.668 14.597 83 880 10.63 880 10.63 Std Dev 0.087 0.093 1 160 1.90 160 1.90
Specime n # Elongatio n At Break mm Stress At Offset Yield MPa Load At Offset Yield N
1 0.352 7.373 604.266 2 0.534 7.391 600.909 3 0.617 8.588 721.763 4 0.448 6.712 563.982 5 0.580 7.702 632.801 6 0.453 7.004 580.767
Mean 0.497 7.462 617.415 Std Dev 0.098 0.650 56.158
11/09/2008
Sample ID: shashi-sd425-15%-1.mss Specimen Number: 1
Tagged: False
0 100 200 300 400 500 600 700
0.0 0.1 0.2 0.3 0.4
Load (N)
Extension (mm)
[1]
F Y
B
M
Specimen Results:
Name Value Units Thickness 5.610 mm Width 14.610 mm
11/09/2008
Sample ID: shashi-sd425-15%-2.mss Specimen Number: 2
Tagged: False
0 100 200 300 400 500 600 700 800 900
0.0 0.1 0.2 0.3 0.4 0.5 0.6
Load (N)
Extension (mm)
[2]
F
B
M
Specimen Results:
Name Value Units Thickness 5.550 mm Width 14.650 mm
Area 81 mm^2
Peak Load 893 N
11/09/2008
Sample ID: shashi-sd425-15%-3.mss Specimen Number: 3
Tagged: False
0 100 200 300 400 500 600 700 800 900 1000 1100 1200
0.0 0.1 0.2 0.3 0.4 0.5 0.6 0.7
Load (N)
Extension (mm)
[3]
F
B
M
Specimen Results:
11/09/2008
Sample ID: shashi-sd425-15%-4.mss Specimen Number: 4
Tagged: False 0 100 200 300 400 500 600 700 800
0.0 0.1 0.2 0.3 0.4 0.5
Load (N) Extension (mm) [4] F Y B M Specimen Results:
Name Value Units Thickness 5.720 mm Width 14.690 mm
Area 84 mm^2
Peak Load 770 N
11/09/2008
Sample ID: shashi-sd425-15%-5.mss Specimen Number: 5
Tagged: False
0 100 200 300 400 500 600 700 800 900 1000
0.0 0.1 0.2 0.3 0.4 0.5 0.6
Load (N)
Extension (mm)
[5] F
Y
M
Specimen Results:
Name Value Units Thickness 5.620 mm Width 14.620 mm
Area 82 mm^2
Peak Load 988 N
11/09/2008
Sample ID: shashi-sd425-15%-6.mss Specimen Number: 6
Tagged: False 0 100 200 300 400 500 600 700 800 900
0.0 0.1 0.2 0.3 0.4 0.5
Load (N) Extension (mm) [6] F Y M Specimen Results:
Name Value Units Thickness 5.750 mm Width 14.420 mm
Area 83 mm^2
Peak Load 844 N
Tensile Test Plot Obtained On MTS 810 For:
shashi-sd118-5%
Method : MMT Tensile Test with return.msm
Specimen Results: Specime n # Thicknes s mm Width mm Area mm^2 Peak Load N Peak Stress MPa Break Load N Break Stress MPa
1 5.520 14.410 80 133 1.67 133 1.67
2 5.350 14.550 78 128 1.64 128 1.64
3 5.560 14.700 82 148 1.81 148 1.81
4 5.620 14.800 83 138 1.65 138 1.65
5 5.650 14.580 82 159 1.94 156 1.89
6 5.520 14.720 81 150 1.85 145 1.79
Mean 5.537 14.627 81 143 1.76 141 1.74 Std Dev 0.106 0.141 2 12 0.12 11 0.10
Specime n # Elongatio n At Break mm Stress At Offset Yield MPa Load At Offset Yield N
1 0.469 0.865 68.819 2 0.405 1.143 88.961 3 0.704 1.140 93.158 4 0.607 0.817 67.980 5 0.626 1.039 85.604 6 0.606 1.157 93.997
Mean 0.569 1.027 83.087 Std Dev 0.111 0.151 11.774
11/09/2008
Sample ID: shashi-sd118-5%-1.mss Specimen Number: 1
Tagged: False
0 10 20 30 40 50 60 70 80 90 100 110 120 130 140
0.0 0.1 0.2 0.3 0.4 0.5
Load (N)
Extension (mm)
[1]
F
Y
M
Specimen Results:
11/09/2008
Sample ID: shashi-sd118-5%-2.mss Specimen Number: 2
Tagg