GENDER DIFFERENCES IN TERTIARY ENTRANCE SCORES
Bob Peck and Karen Trimmer Secondary Education Authority Western Australia
Abstract
The imbalance between the numbers of male and female students at high levels of achievement continues to attract comment, not only from the public but also from some of those engaged in studies of gender difference. In all Australian states, university
admission is based primarily on a single aggregate mark (known as Tertiary Entrance Score, Tertiary Entrance Rank, Overall Position, etc.) which is intended to capture students'
achievement in a wide range of secondary courses, and which is also intended to be a good predictive measure of aptitude for tertiary study. In some states, students who achieve very high tertiary entrance scores (TES) have not only been able to enter high-demand university courses but are also rewarded with well publicised awards and exhibitions. This paper discusses some well known sources of gender difference and goes on to discuss some features in the formulation of a TES which amplify these differences, namely:
(i) Males are more variable than females between courses and thus benefit more from the use of a restricted number of course marks in the TES.
(ii) Males benefit more than females from a lack of requirements for breadth of study.
A number of changes to the formulation of tertiary entrance scores, which will achieve a more equitable outcome, are recommended.
Key Words: Gender Issues
Tertiary Entrance Score
Abstract of a paper to be presented at the annual conference of the Australian Association for Research in Education, Newcastle, New South Wales, 27 November to 1 December, 1994.
GENDER DIFFERENCES IN TERTIARY ENTRANCE SCORES
Introduction
When the Western Australian Secondary Education Exhibitions and Awards for 1993 were published (Secondary Education Authority, 1994) it could be seen that the Beazley Medal (awarded to the student with the highest TES) went to a male; twenty eight general exhibitions (awarded to the forty students with the highest TES) went to males as opposed to twelve to females; and seventeen subject exhibitions (awarded to the student with the highest examination mark in each TES subject) went to males as opposed to twelve to females. This gender difference is a
or for requests for the SEA to explain. The imbalance in the
numbers of males and females achieving the highest marks (see Figure 1) also gives rise to suspicions that the Tertiary
Entrance Examinations are biased, or that the Australian Scaling Test (ACER, 1993) is biased, or that the entire scaling process is biased. This paper offers the view, less often heard amongst the other complaints about gender inequality, that the
formulation of a tertiary entrance score (TES) is inherently biased.
The way in which tertiary entrance scores are formulated differs from state to state, but all states, and also the Australian Capital Territory and the Northern Territory, base admission to university primarily on a single criterion. The name of this criterion varies from state to state (Tertiary Entrance Score, Tertiary Entrance Rank, Overall Position, etc) and the way it is derived from marks obtained in secondary school courses also varies. There are also variations between states and territories in the other criteria for university admission. In describing the TES as the primary criterion for university admission we have simplified matters considerably, but as far as most students are concerned it is perceived as the main obstacle between
themselves and their desired tertiary course.
It is now widely accepted that Year 12 assessment needs to be gender-fair as a requirement for validity and public credibility. This is not to say that the outcomes for males and females need always be identical; on the contrary, if a policy of norming the statistics for males and females were adopted, assessment could be accused of covering up inequalities in the delivery of
education. If this were the case, removing the bias arising from a gendered curriculum would be considerably harder. Unbiased assessment should result in outcomes (e.g. course marks) which depend only on students' achievement of course objectives; the outcomes should not be a function of some other extraneous variable such as gender, religion, ethnicity etc.
In Western Australia, as in some other states, the final mark in each course is an equally weighted mixture of school-based (internal) assessment and an externally administered
examination, which is subjected to a scaling process so that the marks for all courses are in the same metric and can thus be legitimately aggregated. By using a combination of internal assessment which has been found to favour female students and external assessment which has been found to favour male students (Stobart, 1992; SSABSA, 1993) some of the gender differences due to mode of assessment can be balanced. However, there
are some gender differences which are less easy to eliminate, namely the difference between males and females in:
(i) variability within a course,
(ii) variability of individuals between courses, and (iii) participation in courses.
These three gender differences, which have no direct dependence on students' achievement of course objectives, are sources of bias in Tertiary Entrance Scores. Their effect and ways of addressing some of them will be discussed below.
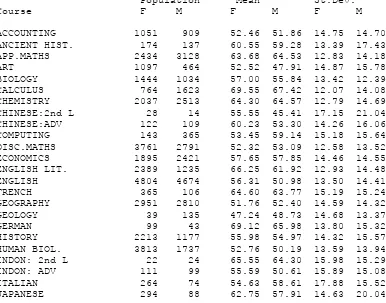
Table 1 shows the scaled marks statistics for Western Australian students in 1993. The final mark received in each course is
called the "scaled" mark because it has undergone scaling onto a scale of measurement common to all subjects; i.e. all of the statistics in Table 1 are in the same metric. The table shows, for males and females separately, the number with a scaled mark in each subject, the mean scaled mark and the standard deviation of scaled marks.
Before the sex differences in Table 1 can be evaluated, statistical tests have to be carried out to assess the
significance of the differences. Two-tailed t-tests were carried out to estimate the probability that the means for males and females are equal, and Levene tests were used to estimate the probability that the standard deviations were equal (Table 2).
[The actual Tertiary Entrance Score used for selection by universities depends not only on the marks of an applicant, but also on the university's policy on TES subjects and on the prerequisites of the course applied for. For the sake of
simplicity , in this paper we have used the aggregate mark (maximum 500) calculated by the SEA for the purpose of
[image:3.595.76.462.463.766.2]identifying winners of awards and exhibitions, and will refer to it as the TES.]
Table 1. Scaled Marks Statistics by Sex, Western Australia, 1993
Population Mean St.Dev. Course F M F M F M
MUSIC 266 113 63.18 59.49 14.45 18.81 PHYS.SCIENCE 306 249 54.18 50.30 12.91 13.35 PHYSICS 1010 2387 65.23 65.40 12.93 14.41 POLITICS 276 177 56.77 57.53 14.50 14.92
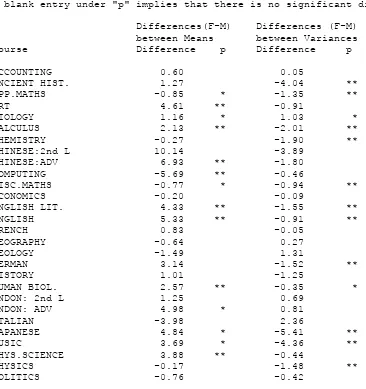
Table 2. Scaled Marks Statistics, Probability of Sex Differences, WA 1993
* signifies that the probability of equal statistics for males and females is less than 0.05.
** signifies that the probability of equal statistics for males and females is less than 0.01.
A blank entry under "p" implies that there is no significant difference.
Differences(F-M) Differences (F-M) between Means between Variances Course Difference p Difference p
ACCOUNTING 0.60 0.05
ANCIENT HIST. 1.27 -4.04 ** APP.MATHS -0.85 * -1.35 ** ART 4.61 ** -0.91
BIOLOGY 1.16 * 1.03 * CALCULUS 2.13 ** -2.01 ** CHEMISTRY -0.27 -1.90 ** CHINESE:2nd L 10.14 -3.89
CHINESE:ADV 6.93 ** -1.80 COMPUTING -5.69 ** -0.46 DISC.MATHS -0.77 * -0.94 ** ECONOMICS -0.20 -0.09
ENGLISH LIT. 4.33 ** -1.55 ** ENGLISH 5.33 ** -0.91 ** FRENCH 0.83 -0.05
GEOGRAPHY -0.64 0.27 GEOLOGY -1.49 1.31
GERMAN 3.14 -1.52 ** HISTORY 1.01 -1.25
HUMAN BIOL. 2.57 ** -0.35 * INDON: 2nd L 1.25 0.69
INDON: ADV 4.98 * 0.81 ITALIAN -3.98 2.36
JAPANESE 4.84 * -5.41 ** MUSIC 3.69 * -4.36 ** PHYS.SCIENCE 3.88 ** -0.44
PHYSICS -0.17 -1.48 ** POLITICS -0.76 -0.42
There are several expected differences between the mean marks, such as in English, English Literature, several of the languages, Art and Music where females score higher than males. In Computing there is a tendency for males to score higher than females, and similar but much smaller
difference are found for Discrete Mathematics and Applicable Mathematics. An exception to the expected pattern concerns Calculus, where females score significantly higher than males. However, the intended point of interest in Table 2 is the difference between the standard deviations which shows that, where as ignificant sex difference exists, males are generally more variant within a course than females. A similar finding was reported by the Gender Equity in Senior Secondary School Assessment
to give males a better chance of being represented at the extremes of the distribution of marks - notably at the top end of the distribution where the Subject Exhibition winner will be found. This is illustrated in
Figure 1 which shows the distribution of TES by Sex for Western Australia in 1993, for males (sd = 72.84) and females (sd = 67. 29) separately. Although the mean for males (299.84) was nearly equal to that for females
(298.89), it may be seen that above a TES of about 410 there are more males than females. This is despite the fact that females outnumber males overall.
Figure 1. Effect of a Greater Standard Deviation on the Top Marks.
The greater variability of males has been reported widely, and applies to a variety of mental abilities (Maccoby & Jacklin, 1974; Feingold, 1994;
Cresswell, 1990). As well as making it more likely that males will be over-represented amongst the awards and exhibitions, and amongst the successful applicants for high-demand tertiary courses, it also means that they will also be over-represented amongst the lowest marks. However, the latter effect seldom generates complaints.
The Variability of Individuals between Courses
A student's TES is calculated from a number of course marks - usually less than the number of courses studied. For example, in Western Australia the marks from as few as four courses may be aggregated into a TES. Since most university-bound students study five or six TES courses, this means that the lowest one or two scaled marks may be discarded. This procedure gives an advantage to a person whose scaled marks vary greatly between courses, compared with another person of equal ability who tends to be less variable. Let us consider two people, Student A and Student B, whose mean scaled mark is 70 (Table 3).
Table 3: Example of two students of equal ability but different variability.
Scaled Marks
Student A Student B
90 70
90 70
70 70
70 70
50 70
50 70
If both students are allowed to discard the two lowest marks, Student A will have a mean mark of 80 while Student B will have a mean mark of 70. This formulation of an average mark tends to reward variability (or
specialisation) rather than consistency (or breadth of achievement).
A study of the variability of scaled marks of Western Australian students was carried out using data from the 1991 leavers. Each student's set of scaled marks (usually 5 or 6 of them) had their standard deviation
calculated as a measure of variability. The students were classified according to ability groups (decile rank on the Australian Scaling Test) and for each ability group the standard deviations of scaled marks were averaged for males and females separately. The results are shown in Table 4 and Figure 2. It may be seen that for most of the ability range males are more variable in their scaled marks than females, and would thus benefit from a TES formulation which allows the lowest marks to be
ability group (AST decile place 1). When this work was replicated with data from the 1992 leavers, similar results were obtained and the same conclusion was reached.
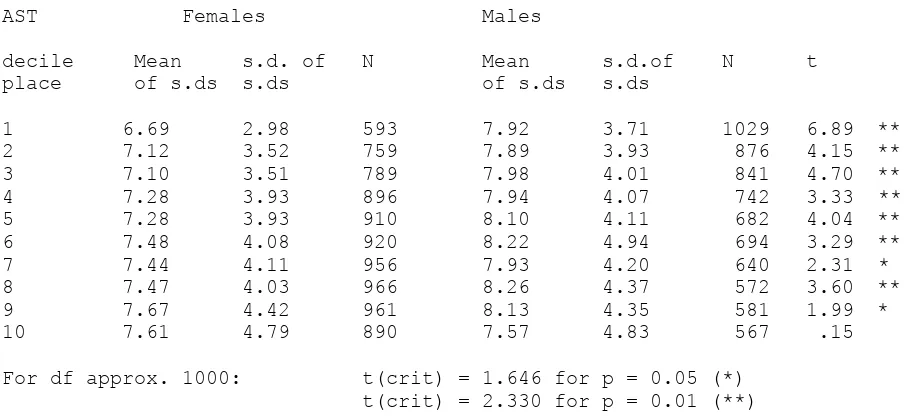
Table 4. Variability of Individuals' Scaled Marks between Courses, by Sex, by Ability Group, 1991.
AST Females Males
decile Mean s.d. of N Mean s.d.of N t place of s.ds s.ds of s.ds s.ds
1 6.69 2.98 593 7.92 3.71 1029 6.89 ** 2 7.12 3.52 759 7.89 3.93 876 4.15 ** 3 7.10 3.51 789 7.98 4.01 841 4.70 ** 4 7.28 3.93 896 7.94 4.07 742 3.33 ** 5 7.28 3.93 910 8.10 4.11 682 4.04 ** 6 7.48 4.08 920 8.22 4.94 694 3.29 ** 7 7.44 4.11 956 7.93 4.20 640 2.31 * 8 7.47 4.03 966 8.26 4.37 572 3.60 ** 9 7.67 4.42 961 8.13 4.35 581 1.99 *
10 7.61 4.79 890 7.57 4.83 567 .15
[image:6.595.73.485.429.712.2]For df approx. 1000: t(crit) = 1.646 for p = 0.05 (*) t(crit) = 2.330 for p = 0.01 (**) Note: AST decile place 1 consists of the top 10% of students. Figure 2. Variability of Individuals' Scaled Marks between Courses, by Sex, by Ability Group, 1991. The extent to which students are allowed to discard their lowest marks varies from state to state in Australia. Table 5 summarises information on the number of course marks required for a TES (or equivalent) in various states. It may be seen that all states allow some course marks to be discarded. The Western Australian system, between 1985 and 1991, allowed a TES to be formulated from as few as 3 course marks, i.e. only 50 percent of course marks were required. From and including 1992, it has been necessary to use at least four course marks. Although this change was probably made for other reasons, it was a step in the right direction for reducing sex bias. Table 5. Number of course marks required for a TES compared with a full load. State Normal Student's Minimum Percentage Maximum Load Requirement for a Required Subjects/Units TES % Western Aust 6 4 67
New South Wales 12 10 83
Victoria 24 16 67
Queensland 24 20 83
South Aust 6 5 83
Tasmania 8 5 63
Aust Cap Terr 6 3.6 60
Differences in Participation
chances of achieving a high TES. This can be seen by examining the
correlation matrix in Table 6. The table displays the Western Australian TES subjects divided into two categories: List 1 contains the languages and social studies, while List 2 contains the science and quantitative
subjects. For ease of interpretation the correlation coefficients have been rounded to one significant figure. It may be seen that, as a general rule, correlations between List 2 course marks are higher than those between List 1 course marks.
In Western Australia students must use, in the compilation of their TES, at
least one subject from List 1 and one subject from List 2. English
is in neither List 1 nor List 2 but may be used in the calculation of the TES provided that the list requirements have been met by other subjects. This requirement for at least one subject from each list goes a little way towards requiring breadth of study.
If a group of subjects is highly intercorrelated this means that the top student in one of them may be expected to be close to the top in the other subjects. This is the case with the mathematics and quantitative
subjects. It is not exceptional to find a student with three scaled marks (the maximum number of quantitative subjects which may be used to make up a TES based on four subjects, under the Western Australian system) from this group of subjects which are each in excess of 90. On the other hand, if students participate in subjects whose marks are poorly correlated with each other, they are unlikely to achieve very high marks in all of these subjects. For example, the person who gets the top mark in English Literature is unlikely to be close to the top in Economics and French as well, because the correlations between these subjects are relatively low; it is more likely that an individual student will gain three high marks from Calculus, Applicable Mathematics and Physics.
Table 1 shows the numbers of male and female students who participated in each TES subject in Western Australia in 1993. It is evident that
there are some big gender differences, particularly in English Literature, LOTE subjects, History, Politics, Geology, Human Biology, Physics,
Physical Science, Calculus, Art and Music. As a generalisation, it may be said that more females participate in the List 1 subjects, which are relatively poorly intercorrelated, and more males tend to participate in the relatively better intercorrelated List 2 subjects. More male students than females may therefore be expected to have a collection of three extremely high marks.
Table 6. Correlations between Scaled Marks of TES Subjects, Western Australia, 1993
Pearson correlations (x10) for subjects with over 20 common students. Blank entries represent subject pairs with 20 or less common students.
Since it is well known that many of the students who achieve the highest TES have studied Mathematics, Physics and Chemistry, it is often wrongly assumed that this combination of subjects is a prescription for maximising one's TES. It should be noted from Table 6 that students who favour List 1 subjects can also find in that list a group of highly intercorrelated subjects, namely: Economics, Geography, History and Politics.
In order to study the effect of reducing the number of highly intercorrelated subjects, the TES was formulated with a variety of different list requirements. The course marks of students who completed Year 12 in 1992 were used. The minimum number of List 1 (Humanities) and List 2 (Quantitative) course marks was varied, as was the number of course marks used to formulate a TES. Table 7 and Figure 3 show the proportions of males and females amongst the top 100 students and the top 200
students.
Table 7. Effect on the sex of the top 100 students of varying the TES formulation.
Figure 3A.
Proportions by Sex of the top 100 students based on various TES formulations.
Figure 3B.
Proportions by Sex of the top 200 students based on various TES formulations.
At present the TES in Western Australia is formulated by Method 7. Table 7 and Figures 3A and 3B show that the difference between the proportions of each sex are reduced by requiring a minimum of two subjects from each list (Methods 1-4). As expected, the effect of removing the list
requirements (Methods 8-10) is to increase the superiority of males. The same conclusions may be reached from the course marks of the 1993
leavers.
The requirement for at least two subjects from each list would force university-bound students to take at least two of the poorly
intercorrelated subjects from List 1 and would reduce the number of highly intercorrelated subjects. Although a change in the rules would probably change students' course selection, a more gender-fair outcome would still be expected.
This source of gender bias - the greater participation by males in the well intercorrelated subjects - is addressed in
some states by breadth of study requirements. South Australia and New South Wales have list requirements similar to Western Australia, but other Australian states and territories appear to allow freedom of choice
amongst the courses from which a TES may be formulated. It should be noted that different scaling methodologies may also address this problem to varying degrees.
Conclusion
The first of these sources of bias could be addressed by maximising, as far as other educational decisions allow, the number of course marks that are used to formulate a TES. The second could be addressed by offering a curriculum which is equally attractive to students of either sex. However, since equality of access is likely to be slow in arriving (assuming that it is feasible), it is recommended that this source of bias could be counteracted by imposing breadth of study requirements on university- bound students.
References
Australian Council for Educational Research (1993). Australian Scaling Test : Series C, Melbourne, Victoria.
Cresswell, M.J. (1990). "Gender Effects in the GCSE: Some Initial Analyses", cited in Stobart, Elwood and Quinlan (see below).
Feingold, A. (1994). "Gender Differences in Variability in Intel
lectual Abilities: a Cross-cultural Perspective", Sex-Roles: a Journal of Research, 30(1-2), pp.81-92.
Maccoby, E.E. & Jacklin, C.N. (1974). The Psychology of Sex Differences, p.118, Stanford University Press.
Secondary Education Authority (WA) (1993). "Exhibitions and Awards", The West Australian, West Australian Newspapers Limited, Perth, WA.
Stobart, G., Elwood, J. and Quinlan, M. (1992). Gender Bias in
Examinations: How Equal Are the Opportunities?", British Educational Research Journal, 1 8(3), pp.261-276.
SSABSA (1993). Gender Equity in Senior Secondary School Assessment Project (ESSSA Project), Final Report, Adelaide, South Australia.