Heat distribution and thermal analysis of joining thermoplastic composites
using microwave energy
H S Ku, C W Li and K F Lee
Faculty of Engineering and Surveying, University of Southern Queensland, West Street, Toowoomba, 4350, Australia.
E-mail: [email protected]
Short title: Thermal analysis of joining composites
Corresponding author
Name: Harry S Ku
Address: Faculty of Engineering and Surveying, Unversity of Southern Queensland, West Strret, Toowoomba, 4350, Australia.
E-mail: [email protected]
Keywords: complex relative permitivity, loss tangent, random glass fibre-reinforced polystyrene, lap shear bond strength and microwaves.
1. Introduction
High energy rate joining of thermoplastic composites using microwave was studied because it was believed that the microwave/materials interactions of some of thermoplastic composites with and without fillers (Araldite) will favour the process. In microwave processing of materials, most of the heat absorbed by the test pieces is due to the absorption of microwave irradiation and then conversion of the microwaves into heat by the samples.
Ku et al. [1-3] used the equipment shown in Figure 1 for this study. Menumaster is the trademark of the microwave oven used. Its cavity dimensions are 500 mm x 700 mm x 500 mm. Referring to Figure 1, the microwaves generated from the magnetron are guided through WR340 waveguide to the test pieces. Avoiding radiation leakage is of primary concern and the joining process is enclosed within a microwave oven cavity so that microwaves will not radiate to the environment.
With reference to Figure 1, the incident waves generated by the magnetron travelled downwards through three sections of WR340 waveguide and interacted with the test pieces located in the second section before being reflected back by the top face of the adjustable plunger. The plunger was designed and manufactured to have a sliding fit contact with the waveguide. The interaction between the incident and the reflected waves set up a standing wave and as desired the maximum electric field occurred at the seam of the lapped test pieces. This was achieved by adjusting the moveable piston so that its top face was an odd multiple
plunger can be moved up and down by rotating the knob at the bottom of the plunger. The sliding fit between the plunger and the waveguide would permit the leakage of microwaves to the surrounding. The problem was solved by the use of short circuit plunger. After joining by microwaves with Araldite as primer, the joints of the PS/GF (33%) test pieces were lap shear tested, using a Shimadzu tensile testing machine. The lap shear strengths of the composite material, the details of the plunger used and the risks involved in the joining process can be found in a paper published earlier [4].
In a university based establishment in Queensland, Australia, Siores et al. used a ridge waveguide (shown in Figure 2) to join thermoplastics successfully; they joined PMMA (polymethyl methacrylate) and HDPE (high desity polyethylene) with professional Araldite, Araldite and RS High Strength Epoxy as primer but found that Araldite was the best primer [5].
2. Theoretical backgrounds
2.1 Materials microwaves interaction considerations
The material properties of greatest importance in microwave processing of a dielectric are the
complex relative permittivity ε = ε′ - jε″,and the loss tangent, tan δ = ε″/ ε′. The real part of
the permittivity, ε′, sometimes called the dielectric constant, mostly determine how much of
the incident energy is reflected at the air-sample interface, and how much is absorbed. The
most important property in microwave processing is the loss tangent, tan δ, which predicts the
ability of the material to convert the absorbed energy into heat. For optimum microwave
energy coupling, a moderate value of ε′, to enable adequate penetration, should be combined
Random GF reinforced (33%) PS was selected because the material has a similar value of loss tangent to that of random GF reinforced (33%) low-density polyethylene (LDPE) and it would be convenient to compare the results of the two materials [1, 2, 6]. The composite is not readily available in the market and it was specially manufactured in Plastic and Rubber Technical Education Centre (PARTEC) in Brisbane, Australia. The length of the reinforcing fibre was 6 mm or a little bit less as fibres longer than 6 mm will not improve the strength of injection-moulded test pieces. However, typical lengths of fibres used in reinforced injection moulding materials were 0.8 to 25 mm [7].
2.2 Test piece microwave interaction results
3. Results
3.1 Temperature distribution
In most cases, only the parts smeared with filler were warmed or heated depending on the power level used and the time of microwave exposure. The parts not smeared with Araldite had much lower loss and did not absorb much of the microwave irradiation. After bonding, the temperatures at different locations, noted by EL4, EL3, EL2, EL1, E, ER1, ER2, ER3, ER4
(Figure 5) were measured using infrared thermometer. E is the mid point of the lapped test pieces with EL1 and ER1 are at 10 mm from left and right of E respectively. Similarly, EL2 and
ER2 are at 20 mm from left and right from E respectively and so on for EL3 and ER3 and EL4
and ER4 respectively. Referring to Figure 5, microwaves travelled from the top of the test
pieces. The hottest spots of the sample were expected to be on the lapped area and along points, EL2, EL1, ER1 and ER2. This is because the lapped area contained the applied Araldite,
which absorbed the microwave energy more and converted it into heat. Figure 5 shows the temperature distribution of samples exposed to different duration of microwave irradiation of 800 W. The distribution of electric fields along the cross-section of the WR 340 rectangular waveguide had a similar shape to that of the curves in Figure 6 [13] . The test pieces were plunged into the curve with the highest electric field in line with the samples. The electric field along the test pieces was therefore strongest. At an exposure time of 60 seconds, the recorded temperatures for points EL1, E and ER1 were 32 oC, 33 oC and 31.5 oC respectively.
points adjacent to the midpoint, E, ie, EL1, ER1 also recorded significant temperature rise.
Furthermore, the longer the time of exposure of the sample to microwave energy, the greater the temperature difference between E and EL1, and E and ER1 respectively. This is illustrated
by the more acute the angle EL1EER1; at shorter duration of microwave irradiation, the angle
was obtuse, ie, there was not much temperature difference between E and EL1, and E and ER1
respectively (see the 15 second-exposure in Figure 6) but the temperatures were much higher than the ambient temperature. The temperature of points outside the lapped area, ie, EL4, EL3,
EL2 on the left and ER2, ER3, ER4 on the right were also much higher than the ambient
temperature. The rise in temperature might have been due to the heat conducted from the lapped area where the Araldite had absorbed more microwave energy. It can also be noted that the temperatures of the points to the left of the lapped area were more or less the same to those on the right because the test pieces were inserted into the rectangular waveguide through the slit symmetrically and the electric fileds inside the waveguide were also symmetric.
Figure 7 shows the temperature distribution of samples exposed to different duration of microwave irradiation of 400 W. The temperature distribution along the points considered is similar to that of the 800 W microwave power exposure in Figure 6. The temperature of points outside the lapped area, ie, EL4, EL3, EL2 on the leftand ER2, ER3, ER4 on the right were
also much higher than the ambient temperature. This is expectable and the reason is the same as in the case of 800 W microwave irradiation mentioned above.
3.2Heat flow and temperature gradient
pieces along the point E and consider the right hand side of them, for two positions along the sample separated by distance dx, the average temperature gradient between the two positions
is dx dθ
where dθ is the temperature difference between the two positions. The heat flow, t Q
,
along the sample depends on [9]:
i) the temperature gradient
L
2 1 θ
θ −
along the sample;
ii) the cross-sectional area of the sample and iii) the material of the test piece.
To measure heat flow, the heat energy Q conducted along the test piece in time t must be measured.
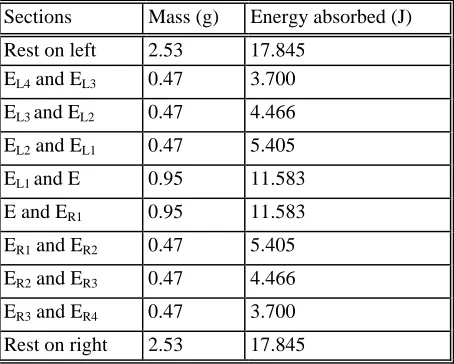
The specific heat capacity of PS/GF (33%), using the techniques mentioned in a text, was measured to be 1086 Jkg -1K-1 [9]. By referring to Figure 4, the total energy, Q, absorbed by the test pieces during their exposure to microwave irradiation can be estimated by dividing the test pieces into sections of different temperatures. Consider the section of E and ER1 of
PS/GF (33%), the temperature of E and ER1 after exposing to microwaves of 800 W for 60
seconds were 33.5 oC and 31.5 oC respectively. Their average temperature was
2 5 . 31 33oC+ oC
=32.25 oC. The volume of the section = 10 mm x 10 mm x 3 mm x 2 (lapped
area) = 600 mm3. The volumes and average temperatures of the other sections of the test pieces were similarly calculated and were tabled in Table 1. The mass of the test pieces was 9.80 g. Since the total volume of the test pieces was 6200 mm3 or 6.2 cm3, the density of
LDPE/GF (33%) = 3
2 . 6 80 . 9 cm g volume mass
= = 1.58 g/cm3.
The microwave power absorbed =
(mass) x (specific heat capacity) x (rise in temperature)
= 0.95g x 1086 Jkg-1K-1 x [(32.25 +273) K – (21 +273) K] = 11.583 J
The mass and energy absorbed of other sections can be similarly calculated and are shown in Table 2. The total energy absorbed by the test pieces was the sum of energy absorbed by each section and was 86 J.
The heat energy stored in the section E R4 and the end of the test piece on the right hand side
was 17.845 J, this rise in temperature in the samples was due to heat energy flow from Eto the same end of the test piece. Despite the low loss of the composite material, PS/GF (33%), the heat stored in the test pieces came overwhelmingly from the microwave absorption of the samples smeared with Araldite.
The temperature distribution along the half test piece for 60 seconds exposure to microwaves of 800 W (in Figure 6) was split into two parts. One to the left of point E and the other to the right of it. Two polynomials were obtained using MATLAB 6 to represent temperature distribution to the left and right of point E. MATLAB 6 was chosen for obtaining the three equations because it is readily available in the university.
To do this in MATLAB (for Equation 1) first define the variables l and T, using MATLAB’s automatic linear interpolation. The Langrange polynomial will be called P and it will be constructed piecemeal, beginning with P=0;. Then for each data point the coefficients for the corresponding Lk (base) polynomial will be constructed as follow:
P=0 for k=1:6
u = l(l∼=l(k)); % pick pout the values of $l$ other than $l_k$
p = [1, -u(1)]; % first factor in the polynomial product q = l(k) –u(1); % first factor in the denominator
for j=2:5
p = conv (p, [1, –u(j)]); % polynomial multiply by each successive factor q = q* (l(k) –u(j)); % multiply denominator by each successive factor r = p/g; % coefficients of the base component polynomial end
P = P + T(k) *r; % The Lagrange polynomial end
fprintf(‘%1.8f’,P)
The coefficients of one of the polynomial (Equation 1) are 0. 00000052, 0.00007325, 0.0034, 0.056623, 0.40079 and 33. The polynomial is therefore,
T(l) = 0.00000052x5 + 0.00007325x4 + 0.0034x3 + 0.056623x2 + 0.40079x + 33
Similarly, Equation 2 is
T(l) = -0.00000052x5 + 0.00007325x4 - 0.0034x3 + 0.056623x2 - 0.40079x + 33
From these two equations, the temperature of a particular location along the samples can be easily computed. Equations 1 and 2 for other duration of exposure to microwaves at power levels of 400 W and 800 W can be similarly obtained. In addition, by substituting the values of maximum temperature at positions E (see Figure 5) for each duration of exposure to CONV
function in MATLAB, a polynomial, Equation 3 = -0.0000087x5 + 0.000160x4 - 0.01115x3 + 0.3633x2 – 5.4x + 0.955 for finding the temperature at location E in the test pieces and at a particular duration of exposure can be obtained. By using Equation 3, and Equations 1 and 2 for different duration of exposure, the temperatures along the samples at a particular time of exposure can be estimated.
3.3 Lap shear bond strengths
exposed to microwaves for over 2 minutes and 45 seconds for power levels of 400 W and 800 W respectively, might be due to over-curing of the adhesive [3].
Figure 10 shows the relationship of lap shear bond strengths and temperatures of the centre points of the test pieces with respect to the duration of exposure to 800 W microwave irradiation. At all duration of exposure to microwaves, the temperatures of the centre points of the test pieces increased steadily with the increase in time of microwave exposure; the lap shear strength of them showed the same trend initially but when the duration of exposure was over 50 seconds, the values of the lap shear strength fell and this was due to over-cured of the Araldite [1].
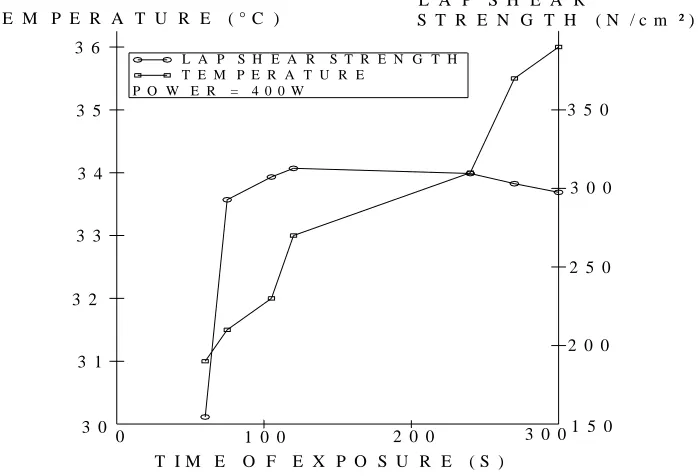
Figure 11 shows the relationship of lap shear bond strengths and temperatures of the centre points of the test pieces with respect to the duration of exposure to 400 W microwave irradiation. The temperatures of the centre points of the test pieces increased steadily with increase in microwave exposure and the lap shear strength showed the same trend but flattened and declined slightly when the exposure time was over 120 seconds. Exposure times of over 300 seconds will deform the samples. The selected cycle times were the most optimum ones because they gave good quality bond with high strength [1-4].
4. Conclusions
2.45 GHz = 5.3 x 10⁻⁴, and GF with loss tangent = 5.3 x 10⁻⁵ are low loss material and it is therefore expected that the composite itself, PS/GF (33%) with loss tangent at 2.45 GHz = 3.73 x 10⁻⁴ is a low loss material as well [3, 13]. The Araldite with loss tangent at 2.45 GHz = 0.244, therefore plays a vital role in absorbing microwave energy and converted it into heat and cures itself rapidly [14]. The absorption of microwaves and hence the rise in the temperature of the samples did promote the curing of the Araldite.
of the test pieces will also deform them because at higher temperatures the samples will be very soft and can be deformed with ease [1, 2]. This study enables one to predict the quality of the bond strength obtained in joing two pieces of thermoplastic composite samples by microwave irradiation without destructing the test pieces but by measuring the temperatures reached by the samples.
It should, however, be noted that the combination of cycle times and power levels obtained in the experiments gives only an indication on how to apply this knowledge universally. The effective combination of the two factors depend on the magnitude of power source as well as the effeciency of the applicators. In addition, the loss tangent of the materials will also play an important part in the cycle times as well as the power levels used in carrying out the bonding.
References
[1] Ku, H S, Siores, E, Ball, J A R, Weldability and heat afftected zone (HAZ) Eevaluation for high energy rate joining of thermoplastic composites using microwave. Proceedings of the Eleventh International Conference on Composite Materials (ICCM-11), Vol.VI, 1997, pp. 55 - 64.
[3] Ku, H S, Siores, E, Ball, J A R and Horsfiled, B, Microwave processing and permittivity measurement of thermoplastic composites at elevated temperatures, Journal of Materials Processing Technology, Vol. 89-90, 1999, pp. 419-24.
[4] Ku, H S, Siores, E and Ball, J A R, Microwave Facilities for Welding Thermoplastic Composites and Preliminary Results, Journal of Microwave Power and Electromagnetic Energy, USA, Vol. 34, No. 4, 1999, pp.195-205.
[5] Siores, E, Groombrdige, P and Oloyede, A, Preliminary Investigation into the Use of Microwave Energy for Fast Curing of Adhesively Bonded Joints formed Using Engineering Thermoplastics, Ceramic Society Bulletin, USA, Vol. 80, 1997, pp. 437-444.
[6] National Research Council, NRC, Microwave Processing of Materials, National Advisory Board Commission on Engineering and Technical Systems, National Research Council, 1994, pp. 7, 100, 105.
[7] Strong, A B, Fundamentals of composite manufacturing: materials, methods and applications, Society of Manufacturing Engineers, USA, 1989, p. 143.
[8] Selleys Araldite, Five minute epoxy adhesive user instructions, Selleys Chemical, undated, p.1.
[9] Breithaupt, J, Understanding Physics for Advanced Level, 2nd ed., U.K., 1991, pp. 111-112,116-118, 848-851.
[11] Ku, H S, Siores, E and Ball, J A R, Joining of thirty three percent by weight random Glass fibre reinforced polystyrene using variable frequency microwave, Journal, Institution of Engineers, Malaysia, Vol. 63, No. 2,2002, pp. 18-24.
[12] Ku, H S, Joining of thirty three percent by weight random carbon fibre reinforced low density polyethylene using variable frequency microwave, Transactions, Institution of Engineers, Singapore, Vol. 43, No. 1, 2003, pp. 20-25.
[13] Metaxas, A.C. and Meredith, R.J., Industrial Microwave Heating, Peter Peregrinus Ltd., U.K., 1983, pp. 6-7, 43, 278.
[14] Ku, H S, Siores E and Ball, J A R, Lap shear strength comparison between two types of random carbon fibre reinforced thermoplastic matrix composites bonded using variable
MAGNETRON
COMMERICAL OVEN
WAVEGUIDE
MOVEABLE PLUNGER
WAVEGUIDE SLIT
TEST PIECE
323 1109
Figure 1. Microwave Facilities Configuration
FILLER
RUBBER BAND
3 2020
20
RUBBER BAND
Figure 3: Test Pieces tightened by a Dielectric Band
20 40
152 43.18
TE MODE CAVITY
10
CLAMP
SPRING
ALUMINUM BLOCK
INTERFACE
WAVEGUIDE
SECTION A - A'
SLIT
TEST PIECE
MICROWAVE A'
A
Figure 5: Locations at which temperature measurements (in the sample) are taken
24 27 30 33 36
1 2 3 4 5 6 7 8 9
EL4 EL3 EL2 EL1 E ER1 ER2 ER3 ER4
Locations in samples where temperatures measured
Temperature (
o C)
60 sec 53 sec
15 sec
24 27 30 33 36
1 2 3 4 5 6 7 8 9
EL4 EL3 EL2 EL1 E ER1 ER2 ER3 ER4
Locations in samples where temperatures measured
Temperature (
o C)
300 sec
270 sec
60 sec
θ2
θ1
Figure 8: Heat flow and temperature gradient of test pieces exposed to a power level of 800 W and a duration of 60 seconds.
Figure 9: Lap Shear Strength of PS/GF (33%) Joined by Fixed Frequency Microwave (2.45 GHz) in a Slotted Rectangular Waveguide using Rapid Araldite
TIME OF EXPOSURE (S)
POWER = 800W
LAP SHEAR STRENGTH TEMPERATURE
27 0 29
28 30
10 20
TEMPERATURE (°C)
31 32 33
100
30 40 50 60
150 200 LAP SHEAR STRENGTH (N/cm²)
250 300 350
L A P S H E A R S T R E N G T H
T E M P E R A T U R E
T I M E O F E X P O S U R E ( S ) 3 3
0 3 0 3 2
3 1
1 0 0 T E M P E R A T U R E ( ° C )
3 4 3 5 3 6
P O W E R = 4 0 0 W
2 5 0
2 0 0
1 5 0
2 0 0 3 0 0
L A P S H E A R
S T R E N G T H ( N / c m ² )
3 5 0
3 0 0
[image:23.595.120.469.98.336.2]Figure 11: Lap shear bond strength and temperature against time of Exposure to microwaves of 400W in the samples of PS/GF (33%)
Table 1: Volume and Average Temperature of Different Sections of Test Pieces
Sections Volume (mm3) Average temperature (oC)
Rest on left 1600 27.5
EL4 and EL3 300 28.25
EL3 and EL2 300 29.75
EL2 and EL1 300 31.5
EL1 and E 600 32.25
E and ER1 600 32.25
ER1 and ER2 300 31.5
ER2 and ER3 300 29.75
ER3 and ER4 300 28.25
Table 2: Mass and Energy of Different Sections of Test Pieces
Sections Mass (g) Energy absorbed (J)
Rest on left 2.53 17.845
EL4 and EL3 0.47 3.700
EL3 and EL2 0.47 4.466
EL2 and EL1 0.47 5.405
EL1 and E 0.95 11.583
E and ER1 0.95 11.583
ER1 and ER2 0.47 5.405
ER2 and ER3 0.47 4.466
ER3 and ER4 0.47 3.700